Using Compound Vision Geometry for Diffusion Tower
Re-Enactment
S. Joseph Gabriel
1, MD. Dawood Hussain
2, P. Rizwan Ahmed
31
Associate Professor & Head of Computer Science, Mazharul Uloom College, Ambur (India)
2
Research Scholar, Mazharul Uloom College, Ambur (India)
3
Assistant Professor & Head of Computer Application, Mazharul Uloom College, Ambur (India)
ABSTRACT
Automated platforms that conduct power line inspections need to have a vision system which is robust for their
harsh working environment. State-of-the-art work in this field focuses on detecting primitive shapes in 2D
images in order to isolate power line hardware. Recent trends are starting to explore 3D vision for autonomous
platforms, both for navigation and inspection.
However, expensive options in the form of specialized hardware is being researched. A cost effective approach
would begin with multiple view geometry. Therefore, this study aims to provide a 3D context in the form of a
reconstructed transmission pylon that arises from image data. To this end, structure from motion techniques
are used to understand multiple view geometry and extract camera extrinsic. Thereafter, a state-of-art line
reconstruction algorithm is applied to produce a tower. The pipeline designed is capable of reconstructing a
tower up to scale, provided that a known measurement of the scene is provided. Both 2D and 3D hypotheses are
formed and scored using edge detection methods before being clustered into a final model.
The process of matching 2D lines is based on an exploitation of epipolar geometry, where such 2D lines are
detected via the Line Segment Detection (LSD) algorithm. The transmission tower reconstructions contrast their
point cloud counterparts, in that no specialized tools or software is required. Instead, this work exploits the wiry
nature of the tower and uses camera geometry to evaluate algorithms that are suitable for offline tower
reconstruction.
Index Terms:
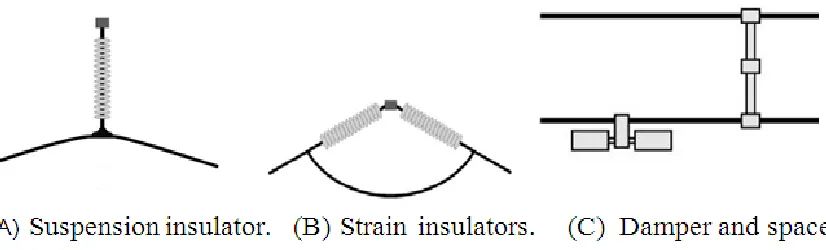
Line segment detector, Damper and insulator detections, Conductor and
spacer detection
I. INTRODUCTION
Image processing can be integrated into a multitude of scenarios, one of which is in the growing power sector in
South Africa. To elaborate, there is an increase in energy demand, and this leads to the dedication of more
resources towards power line and equipment inspection/maintenance. However, South Africa has close to 30
000 km of transmission lines and the large, financial expense of inspecting the integrity of transmission line
components is coupled with the danger that this task poses to skilled personnel. Current inspections are
performed manually by flying helicopters and fixed-wing aircraft over the lines, or by patrolling with ground
personnel. These tasks are necessary, especially since some of the components have been in commission for
power line equipment only. Less time should be dedicated towards the tedious search for hazardous
components from thousands of inspection images. This is why power line inspection via UAVs and robots is
studied. Their potential to improve inspection reliability, and reduce both cost and danger, is attractive.
However the scope of a power line inspection robot should include navigation along a live transmission line.
Thereafter, inspection of different hardware can follow. Two such robots that are striving to achieve these
tasks are UKZN‟s Power Line Inspection Robot and Hydro- Quebec‟s LineScout Recognising specific
hardware components can initiate appropriate movement sequences and can make inspection routines more
autonomous. Currently, these platforms are prototypes that require human intervention to ensure that the
robot does not fall from the line. The interesting challenge lies in developing computer vision strategies to
increase autonomy. Visual sensing may provide a way for the robot to track targets and inspect components.
When reconstructing 3D models, image processing methods should be chosen on the basis of their ability
to exploit the physical construct of target components.
II. PROBLEM IDENTIFICATION
Most robotic platforms jump straight to employing specialised algorithms (based on
images) to detect the presence, and possible damage, of specific components. Although these
activities are vital, they have overlooked the development of robot autonomy as far as
incorporating 3D models is concerned. These 3D models can be used to localize a robot before
realizing specific line components as identified in Figure 1.1. In addition, GPS can be wrong
up to a few metres while onboard sensors are sensitive to drift. The idea of having a n inspection
robot use 3D models should not be overlooked given that their working environment is a
structured, man-made context A feasible example of a 3D target is a model of a transmission pylon
because of its size, repeatability (intermittent locations) and rigid construct. A transmission line
tower is a „wiry‟ structure and thus rich in geometric content, making it a suitable candidate
for generating a 3D model. It is considered wiry because of its beams configured in an organised
construct. The tower is significantly tall (for example, a 220kV tower can be 30 m tall) and if it can
be tracked relative to the robot‟s position, the robot can subsequently zoom in on specific line
equipment to perform inspections. By using camera models and projective geometry, the robot
would only consider the pixels it needs in order to locate power components such as those in
Most 3D representations for this possible target object are in the form of CAD dr awings and
point clouds, both of which require specialised software and tools to generate. These consume a
significant portion of disk space. This leads to the question of what makes a good tower model.
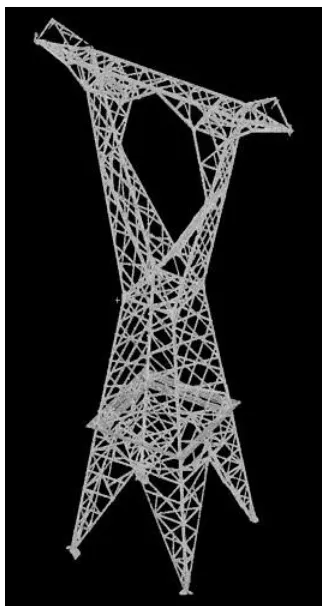
Point cloud data from laser scanners require the use of expensive equipment. The resulting
model still needs to be processed in specialised software and it can take hours to render a
model like the one depicted in Figure 1.2 . The sizes of point cloud files are also in the hundreds
of megabytes.
A CAD model may also seem to be a likely candidate. However, the robot will be working
outdoors with varying lighting conditions, occlusion and other unwanted objects in the scene.
The effect of synthetic textures in a CAD tower model may not be ideal for when the robot
needs to track a real tower (i.e. comparing the surface finish of tower beams between CAD
models and acquired images).
Figure 1.2: Example of a point cloud after rendering
It is also possible that current models are just records on paper, capturing only a general sense of tower
geometry. Some towers have asymmetrical cross-arms due to lines changing directions or asymmetrical legs
due to an uneven terrain. Towers have to conform to their local landscape and will also vary in height
depending on application. Tower heights, for 400kV transmission lines, can range between 28 m and 60 m.
There is no clear indication of how a 3D transmission tower can best be reconstructed from images.
Available algorithms tackle subsets of these problems in the form of edge detection and line detection, for
instance. Feature tracking is limited to popular algorithms that find interest points that are not related to the
contrive algorithms to build an application, as opposed to consulting existing multiple view geometry
techniques and question,“What combination of image processing tools and state-of-art algorithms
exist to facilitate a tower reconstruction pipeline?”
III RESEARCH OBJECTIVE
This work is more concerned with image processing rather than specific robotic platforms that
work on power lines. Therefore, any algorithm studied and implemented must have an outcome
that can benefit a UAV, robot, helicopter or ground crew. This research aims to reconstruct a 3D
tower model from multiple 2D images and this requires understanding projective geometry as
well as building and using camera models. Feature points should rely on the geometry of the
desired object and the process can be an offline procedure. Comparisons between the
reconstruction and its 3D counterpart will be made so as to determine the strengths and
weaknesses of the algorithms chosen.
This research will:
• Describe how state-of-art applications use image processing tools for power line inspection.
• Based on state-of-art review, show how a reconstructed tower may be obtained from understanding and exploiting camera geometry offline.
• Finally, compare a tower reconstruction to its physical counterpart, thereby exposing any challenges that are faced in the reconstruction process.
IV. CONCLUSIONS
The focus of this work was to propose a 3D model of a transmission tower using camera geometry and image
data. Furthermore, it was shown how features that are directly related to a wiry target object (lines in this
case) can be exploited in a reconstruction problem. This was done by considering the tower as a „wiry‟
object. Popular algorithms like SIFT are limited in their ability to represent corner points on objects that lack
texture (a tower).
State-of-art work is heading in the right direction by detecting primitive shapes that are appli- cable for the
power industry. However, for 3D vision, specialised equipment like laser scanners are being used, thus
bypassing knowledge about feature detection and camera geometry. The algorithm coded in this work can
achieve a scaled reconstruction of a tower while the geometry of the target is preserved. Using images and
exploiting multi-view geometry to generate such models makes the wiry model reconstruction worthy of
research. The model is compact and does not require specialised hardware other than a camera. However, for
robot navigation and power line inspection, a more refined tower needs to be reconstructed. This translates to
addressing problems faced with the reconstruction pipeline itself. The justification for the algorithms chosen to
form this tower reconstruction pipeline is suitable, but there are considerations to be made. These are issues
REFERENCES
[1] Dana H Ballard. Generalizing the Hough transform to detect arbitrary shapes. Pattern recognition,
13(2):111–122, 1981.
[2] Daniel F. Dementhon and Larry S Davis. Model-based object pose in 25 lines of code.
[3] International journal of computer vision, 15(1-2):123–141, 1995.
[4] Agn`es Desolneux, Lionel Moisan, and Jean-Michel. Morel. Edge detection by Helmholtz
principle. Journal of Mathematical Imaging and Vision, 14(3):271–284, 2001.
[5] Agnes Desolneux, Lionel Moisan, and J-M Morel. From gestalt theory to image analysis: a probabilistic
approach, volume 34. Springer Science & Business Media, 2007.
[6] Eskom. Electricity: Costs and Benefits, 2014. URL http://www.eskom.co.za/
AboutElectricity /Facts Figures/Pages/Facts_Figures.aspx.
[7] Martin A. Fischler and Robert C. Bolles. Random sample consensus: a paradigm for model
fitting with applications to image analysis and automated cartography. Communications of
the ACM, 24(6):381–395, 1981.
[8] David A. Forsyth and Jean Ponce. A modern approach. Computer Vision: A Modern Approach,
pages 88–101, 2003.
[9] Siyao Fu, Weiming Li, Yunchu Zhang, Zize Liang, Zengguang Hou, Min Tan, Wenbo Ye,
Bo Lian, and Qi Zuo. Structure-constrained obstacles recognition for power transmission
line inspection robot. In Intelligent Robots and Systems, 2006 IEEE/RSJ International Conference on,
pages 3363–3368. IEEE, 2006.
[10] Siyao Fu, Zize Liang, Zengguang Hou, and Min Tan. Vision based navigation for power
transmission line inspection robot. In 2008 7th IEEE International Conference on Cognitive Informatics,
pages 411–417. IEEE, August 2008. ISBN 978-1-4244-2538-9. doi: 10.1109/
COGINF.2008.4639195. URL http://ieeexplore.ieee.org/lpdocs/epic03/wrapper.
htm?arnumber=4639195.
[11] Rafael Grompone von Gioi, Jean-michel Morel, and Gregory Randall. LSD : a Line Segment