IJSRR, 7(3) July – Sep., 2018 Page 1070
Research article
Available online www.ijsrr.org
ISSN: 2279–0543
International Journal of Scientific Research and Reviews
Efficient Product-type Exponential Estimator for Population Variance
Panda K. B.*
and Sen M.
P.G. Department of Statistics, Utkal University, Bhubaneswar, Odisha-751004, India E-mail:[email protected]* & [email protected].
ABSTRACT
We in this paper propose a new exponential product type estimator for estimating the
population variance using auxiliary information. To the first order of approximation, i.e., to o(n-1),
the expressions for the bias and the mean square error of the proposed exponential product-type
estimator have been derived. The optimum value of the characterizing scalar, which minimizes the
MSE of proposed estimator, has been obtained. With this optimum value, the expression for
minimum MSE of the proposed estimator has been arrived at. The proposed estimator has been
compared theoretically with simple variance, traditional product estimator and exponential product-
type estimator and it is found that, under practical conditions, the proposed estimator fares better
than its competing estimators. A numerical study is done to demonstrate the practical use of different
estimation formulae and empirically demonstrate the performance of the constructed estimators.
KEYWORDS
: Auxiliary variable, single-phase sampling, bias, mean square error.*
Corresponding author
K.B. Panda
Professor, P.G. Department of Statistics, Utkal University, Bhubaneswar,
Odisha-751004, India
IJSRR, 7(3) July – Sep., 2018 Page 1071
INTRODUCTION
In survey sampling, the utilization of auxiliary information is frequently acknowledged to
enhance the accuracy of the estimation of population characteristics. Estimation of the finite
population variance has great significance in various fields such as in matters of health, variation in
body temperature, pulse beat and blood pressure etc. Using auxiliary information, we, in this paper,
introduce a new estimator, which fares better than its competing estimators.
Consider a finite population of size N, arbitrarily labelled 1, 2....N. Let and be,
respectively, the values of the study variable y and the auxiliary variable x, in respect of the ith unit
(i=1, 2,… N) of the population. When the auxiliary variable x is negatively correlated with the study
variable y and , the population variance of x is known, product method of estimation is usually
invoked to estimate the population variance of the study variable. The product method of
estimation investigated by Robson1 and Murthy 2 , is quite effective.
NOTATIONS AND SOME EXISTING ESTIMATORS
In simple random sampling without replacement, we know that the sample variance
provides an unbiased estimator of the population variance ,
where = ∑ ( − )2
= ∑ ( − ) .
Accordingly, we define
= 1
−1 ( − )
= ∑ ( − ) ,
as the population and sample variances, respectively, for the auxiliary variable x.
Let = , . . , = (1 + ),
= − , . . , = (1 + ),
IJSRR, 7(3) July – Sep., 2018 Page 1072
E( ) = ( −1) and E( ) = ( −1),
where = / /
and = ∑ ( − )p( − )q ; (p, q) being non-negative integers, , are the second
order moments of x and y, respectively, and = is the coefficient of variation for auxiliary
variable . With the above notations, the variance of the estimator is expressed as
V( ) = ( −1). (1)
Customary product type estimator for estimating the population variance of the study variable is
= , (2)
whose bias and mean square error, up to the first order of approximation ,i.e., to o ( ) are
respectively,
B( ) = ( −1) (3)
and
MSE( ) = [ + + 2 −4]. (4)
Singh et. al.3 suggested product-type exponential estimator for population variance in single-phase
sampling as
= exp [ ], (5)
whose bias and mean square error up to first order of approximation, i.e., to o ( ) are,
respectively,
B( ) = [− + − ] (6)
IJSRR, 7(3) July – Sep., 2018 Page 1073
PROPOSED PRODUCT-TYPE EXPONENTIAL ESTIMATOR
We propose a new product-type exponential estimator for estimating the population
variance , as
Ꞌ = exp[ ( )], (8)
where, is a suitably chosen pre-assigned constant. It may be noted here that if = 1,the new
estimator reduces to usual product-type estimator due to Singh et.al.2011
Substituting the value of , in the expression (8), we get
Ꞌ = exp [ ( )]
= exp [ ( ) ( )]
= (1 + )exp [ ( )(2 + ) ].
= (1 + )exp [ (1 + ) ].
= (1 + )exp [1 + ( )(1− + − )+ (1− + − ) ]
Retaining terms only up to 2nd degree, we arrive at
Ꞌ = (1 + )exp [1 + ( )− + ]
= [1 + − + + + ]
= [1 + − + + + ] (9)
The bias of the proposed exponential product estimator, to the first degree of approximation,
i.e., to o ( ), is
B( Ꞌ ) =E( Ꞌ )−
= [1 + − + + + ]−
= [ (1) + ( )− ( ) + ( ) + ( ) + ( )]
IJSRR, 7(3) July – Sep., 2018 Page 1074
The mean square error of the proposed exponential product estimator, to the first degree of
approximation, i.e., to o ( ), has been derived as follows:
( Ꞌ ) = [ Ꞌ − ]
= [ 1 + − + + + ( ) − ]
= [
2 − 4 + 8 + + 2( ) ]
= [ + + ]
= [ ( ) + ( ) + ( ) ]
= [ ( −1) + ( −1) + ( −1)]
= ( −1) + ( −1) + ( −1) . (11)
With a view to determining the most suitable value of , to be called , we minimize the
mean square error subject to variation in , implying thereby that
(
Ꞌ )
= 0
⇒ [ ( −1) + ( −1) + ( −1)]=0
⇒ [ ( −1) + ( −1)] = 0
⇒ [ ( −1) + ( −1)]= 0
⇒ ( −1) + −1= 0
⇒ ( −1) = 1−
⇒ ( −1) = 2(1− )
⇒ = ( )
IJSRR, 7(3) July – Sep., 2018 Page 1075
Thus, = ( )
( ). (12)
Substituting this value of in the expression for MSE ( Ꞌ ), i.e., in (11), we arrive at the
minimum value of MSE ( Ꞌ ), which is expressed as
( Ꞌ ) = [ )+ −1]. (13)
On comparison of (13) with (1), the following results can be arrived at
( Ꞌ )−V ( ) < 0
⇒ [ )+ −1]− [ ( −1)]< 0
⇒ > 1. (14)
On comparison of (13) with (4), the following results can be arrived at
( Ꞌ )− MSE ( ) < 0
⇒ [ )+ −1]− [ + +2 −4]< 0
⇒( )
( ) + + 2 > 3. (15)
Comparing (13) with (7), we get
( Ꞌ )− ( ) < 0
⇒ [ )+ −1]− [ + + − ] < 0
⇒ + + > . (16)
(1) The newly proposed estimator Ꞌ performs better than the simple variance estimator of
population variance if
> 1.
(2) The newly proposed estimator Ꞌ performs better than the traditional product-type estimator for
IJSRR, 7(3) July – Sep., 2018 Page 1076
( )
( ) + + 2 > 3.
(3) The newly proposed estimator Ꞌ performs better than the product-type exponential estimator
due to Singh et. al.3 for variance, i.e., if
+ + > .
EMPIRICAL STUDY
With a view to study the theoretical findings, we have chosen the following examples based
on real data:
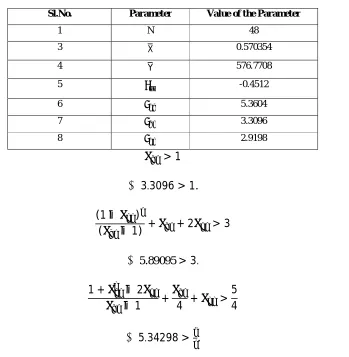
Example 1: We refer to Weisberg4 PP- 31-35, wherein the following information is found:
Y: Fuel consumption, gallons per person.
X: TAX, cents per gallon
Table 1: Parameters and their values
Sl.No. Parameter Value of the Parameter
1 N 48
3 X 0.570354
4 Y 576.7708
5 ρ -0.4512
6 λ 5.3604
7 λ 3.3096
8 λ 2.9198
> 1
⇒3.3096 > 1.
(1− )
( −1) + + 2 > 3
⇒ 5.89095 > 3.
1 + −2
−1 + 4 + >
5 4
IJSRR, 7(3) July – Sep., 2018 Page 1077
Thus, we find that the condition (14), (15) and (16) are satisfied.
The MSEs of the competing estimators have been computed and presented in Table 2
Table 2:MSE of the competing estimator
. .
/
1 s 4.3604
2 s 10.5096
3 s 6.8576
4 sꞋ 2.7646
The percentage gain in efficiency of the proposed estimator, Ꞌ over the competing
estimators , and has been given in the table 3
Table 3
Sr. No. Percentage Gain in Efficiency(PGE)
1 s 57.7226
2 s 280.1490
3 s 148.0503
It is clear from the above table that the newly proposed estimator performs better than the
competing estimators.
Example 2: We refer to Swain5, PP-285-287, wherein the following information is found:
Y: Mean yield of rice per plant
X: percentage of sterility
Table 4: Parameters and their values
Sl. No. Parameter Value of the Parameter
1 N 50
3 18.762
4 12.839
5 -0.25103
6 3.828497
7 2.474604
IJSRR, 7(3) July – Sep., 2018 Page 1078 > 1
⇒2.474604 > 1.
(1− )
( −1) + + 2 > 3
⇒ 5.92856 > 3.
1 + −2
−1 + 4 + >
5 4
⇒2.46912 >5 4.
Thus, we find that the condition (14), (15) and (16) are satisfied.
The MSEs of the competing estimators have been computed and presented in Table 5
Table 5:MSE of the competing estimator
Sl. No.
/
1 2.828497
2 5.51008
3 3.800637
4 Ꞌ 2.5815
The percentage gain in efficiency of the proposed estimator, Ꞌ over the competing
estimators , and has been given in the table 6
Table 6:
Sl. No. Percentage Gain in Efficiency(PGE)
1 9.5676
2 113.4448
3 47.2259
It is clear from the above table that the newly proposed estimator performs better than the
IJSRR, 7(3) July – Sep., 2018 Page 1079
V. CONCLUSION
From Tables 3 & 6, it is clear that the proposed product-type exponential estimator for
estimating the population variance perform better than its competing estimators under conditions that
hold good in practice.
ACKNOWLEDGEMENT
The authors are very much thankful to the editor-in-chief and the unknown learned referees
for critically examining the manuscript and giving valuable suggestions to improve the manuscript.
REFERENCES
1. Robson, D.S. Application of multivariate Polykays to the theory of unbiased ratio-type
estimation, Journal of the American Statistical Association, 1957; 59: 1225-1226.
2. Murthy, M.N. Product method of estimation, Sankhya, 1964; 69-74.
3. Singh, R., Chauhan, P., Sawan, N. & Smarandache, F.,’Improved exponential estimator for
population variance using two auxiliary variables’, Italian Journal of pure ans Applied
Mathematics,2011; 28:101-108.
4. Weisberg, Sanford, Applied Linear Regression, John Wiley & Sons, 1980