238 Abstract—This paper is an attempt made to estimate the quantity solid waste that can be generated in the ELURU city, A.P, INDIA per day and to estimate the generation potentiality of energy through combustion of solid waste. The waste-to-energy industry has proven itself to be an environmentally friendly solution to the disposal of municipal solid waste and the production of energy. Waste-to-energy is now a clean, renewable, sustainable source of energy. The estimation of energy content of municipal solid waste in Eluru Municipal Corporation is discussed in this paper. The data related to number of house holds in division wise is collected from Municipal Corporation of Eluru as 39,996.Out of the 50 divisions in Eluru Municipal Corporation based on income six divisions are selected for random survey covering low, medium and high income groups. Division maps are collected from the corporation for the sample survey divisions. The divisions selected for sampling survey are re- mapped representing minimum of 10% houses selected in each division covering the total geographical location. House hold collection of solid waste is done physically in all the six divisions selected for estimating the per capita waste generation in the city. By physical weighment of all the waste collecting vehicles the total waste collected in the city is estimated and the same is compared by using the calculated per capita waste generation taking the total population of the city in to consideration to find out the quantity of waste generated in the corporation. Then a representative sample of the corporation using quartering method is collected from the dump yard. The representative sample of the city is sent for lab analysis at a MoEF recognized lab to estimate the calorific value and the same is compared by conducting several trials at the experimental setup designed with conventional approach on a Bomb calorimeter. It is estimated that by combusting the solid waste in ELURU Municipal Corporation it is possible to generate nearly 3MW of power.
Index Terms—Municipal Solid Waste (MSW), Municipal Corporation of Eluru (MCE), Energy, Calorific value ,Garbage, Sampling, Waste to Energy (WTE), Ministry of Energy and Forest (MoEF).
I. INTRODUCTION
With the fast depletion of the conventional resources and the growing awareness and concern regarding the environmental effects of their utilization, there has been a major thrust in the recent past to identify and develop
Associate Professor,Mechanical Eng. Dept., Sir C.R. Reddy College of Eng, Eluru-534007,West Godavari District A.P.,India; E-Mail: [email protected], Tel: 9441059295; Fax: 0091-8812-224193.
Professor,Mechanical Eng. Dept., College of Eng.,AndhraUniversity,Visakhapatnam;E-mail:[email protected],Tel:9 848063452
Professor,Environment Science Dept., Andhra University,Visakhapatnam:Email:[email protected],Tel:94938016 58
alternate energy sources. India generates about vast amounts of MSW in hundreds of tons which when converted to fuel fluff/pellets have appreciable calorific value and hence, are over the country and totally renewable. The cost of the fuel is also much lesser than that of conventional fuels. Besides that advantages MSW based project is also eco-friendly as it does not add to the environmental pollution and rather it would help cleaner environment.
Keeping the above factor in focus, the Ministry of New and Renewable Energy (MNRE), Govt. of India has been aggressively promoting the concept of biomass/MSW-based power plants in the 5-15 MW range. The national program on biomass /MSW based power generation had extended capital subsidies for first few demonstration projects. Municipal Solid Waste (MSW) is a waste type that includes predominantly household waste (domestic waste) with sometimes the addition of commercial garbage or refuse that is generated by households, commercial establishments, industries or lunchrooms and sludge not regulated as a residual or hazardous waste. Garbage generated from residential, commercial, institutional and industrial sources that falls into six basic categories: Durable goods, non-durable goods, containers and packaging, food wastes, yard trimmings and miscellaneous organic and inorganic wastes. MSW is referred to in common parlance as garbage is commonly known as common trash or garbage and includes such everyday items such as paper, product packaging, lawn clippings, bottles, and appliances.
A. Description of Town
Eluru, previously known as Helapuri and has a rich cultural and political history. It was a part of Buddhist Kingdom called Vengi. During the Chalukyas (700 AD – 1200 AD),Eluru was a province. Later on Eluru remained a part of Kalinga Empire. During division of Northern cirkaras Circars into district, Eluru made a part of Machilipatnam district. Later it was included in the Godavari district in 1859. Subsequently, Eluru made part of Krishna district. Finally in the year 1925, West Godavari District was formed with Eluru as its headquarters. Eluru town is situated at 16.70 N latitude and 81.10E longitude on the Kolkata – Chennai National Highway (NH5). Eluru was a selection grade municipality of Andhra Pradesh. It has been upgraded to Municipal Corporation on 09.04.2005. The area of Eluru Municipal Corporation is 14.55 Sq.km with a population of 1,90,062 as per 2001 Census. It would be seen that during the last decade Eluru experienced a negative population growth.
B. MSW Availability
It is understood by physical weighment that 59 to 65 tones
Waste to Energy: A Case Study of Eluru, A.P,
India
239 of MSW in ELURU is being generated every day.
TABLE1.PATTERNS OF COMPOSITION,CHARACTERISTICS AND QUANTITIES OF MSW Composition (% by
weight)
Low Income Countries (1)
Middle Income Countries (2)
High Income Countries (3)
Metal 0.2 – 2.5 1 – 5 3 – 13
Glass, Ceramics 0.5 – 3.5 1 – 10 4 – 10 Food and Garden waste 40 – 65 20 – 60 20 – 50
Paper 1 – 10 15 – 40 15 – 40
Textiles 1 – 5 2 – 10 2 – 10
Plastics/Rubber 1 – 5 2 – 6 2 – 10
Inert 20 – 50 1 – 30 1 – 20
Density (kg/m3) 250 – 500 170 – 330 100 – 170 Moisture Content 40 – 80 40 – 60 20 – 30 Waste Generation
(kg/cap/day)
0.4 – 0.6 0.5 – 0.9 0.7 – 1.8
Source: Holmes, J: Managing Solid Waste in Developing Countries (www.urbandevolopment.nic.in)
TABLE2.QUANTITY OF MUNICIPAL SOLID WASTE IN INDIAN URBAN CENTERS: Population
Range (in million)
Number of Urban Centers (Sampled)
Total population (in million)
Average per capita value (kg/capita/day)
Quantity (tones/day)
<0.1 328 68.300 0.21 14343.00
0.1-0.5 255 56.914 0.21 11952.00 0.5-1.0 31 21.729 0.25 5432.00 1.0-2.0 14 17.184 0.27 4640.00 2.0-5.0 6 20.597 0.35 4640.00
>5 3 26.306 0.50 13153.00
Source: Background material for Manual on SWM, NEERI, 1996. (www.urbandevolopment.nic.in)
C. Waste Management and Present System of Collection in Eluru
The conservancy staff of the corporation collects wet waste from house hold daily and dumps it in low lying areas / dumping grounds as shown in Figures 1 a) & b).
Figure 1. Images of present collection of MSW at MCE
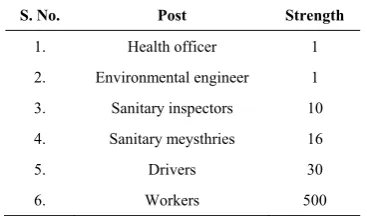
TABLE3.PRESENT ORGANIZATION SETUP ENGAGED IN THIS WORK. PHYSICAL COMPOSITION OF MSW OF MCE
S. No. Post Strength
1. Health officer 1
2. Environmental engineer 1
3. Sanitary inspectors 10
4. Sanitary meysthries 16
5. Drivers 30
6. Workers 500 Source: Municipal Corporation of ELURU.
TABLE4.THE CORPORATION OWNS AND MANAGES THE FLEET OF FOLLOWING VEHICLES (DATA COLLECTED FROM MCE)
Type of vehicles Number of Vehicles
Tractors 18 Trolleys 5 Rickshaw 92
Source: Municipal Corporation of ELURU.
• No. of vehicles in running at any time: 97%
• No. of trips by each vehicle in a day : 1-2 trips
• Waste carries in one trip : 2-3 tons
The dry waste is collected by ITC which had implemented “WOW” that is wealth out of waste and pay amount for the dry waste. The amount varies depending on the type of dry waste.
II. ESTIMATION OF THE MSWCONSTITUENTS IN ELURU CORPORATION
A sample of waste by quartering system is collected from dump yard and the estimation of MSW constituents in Eluru Corporation is as below.
TABLE5.DATA FROM THE SAMPLE COLLECTED (DATA COLLECTED FROM
MCE)
Constituents Actual Weight (KGS) % by Weight
Paper 25.79 27
plastic 22.9 24
Cloth 1.39 1
Food Waste 2.65 3
Wood 0.91 1
Leather 0.611 1
Coconut Threads 0.49 1
Leaves + Yard waste
15.98 17
240
Stones 1.59 2
Dirt + fine particles
22.16 23
Figure 2. Image of weighing for estimation of physical composition of MSW Of MCE
Several conclusions may be drawn from the comparative data of Tables [1],[2] &[5]:
• The proportion of paper waste increases with increasing national income;
• The proportion of pustrescible organic matter (food waste) is greater in countries of low income than those of high income;
• Variation in waste composition is more dependent on national income than geographical location, although the latter is also significant;
• Waste density is a function of national income, being two to three times higher in the low-income countries than in countries of high income;
• Moisture content is also higher in low-income countries; and
• The composition of waste in a given urban centre varies significantly with socio-economic status (household income)
III. HOUSE HOLD SURVEY
The house hold garbage quantity is assessed by survey with 10% of houses in the division selected for sampling so that the sample shall be representative of different income groups. In collecting sample there must include all the type of constructions like schools, colleges, factories, hostels, hospitals etc., The samples are collected separately i.e., wet (vegetable waste, kitchen waste etc.) & dry waste (papers, room waste, bags, boxes etc). This sampling process is
continued for seven days so that one can predict the average value of MSW generation/house hold. The results of the analyses show that MSW contains organic matter and miscellaneous materials (bricks, fine dust, rubber, wood, leather, wastewater, etc.). The percentage of recyclable materials (glass, paper, plastic, metals) has been found to be very low. This may be due to rag pickers, who collect and segregate recyclable materials from collection points and disposal sites. The results from the survey reveal that the per capita MSW generation rate is nearly 0.12 kg/capita/day. The per capita generation rate for various divisions in Eluru city is calculated. This rate varies from 0.14 kg/capita/day in Division-23 to 0.09 kg/capita/day in Division-50 where as 0.6 kg /capita/day generation of MSW observed in metro cities of India. The house holds are selected randomly from the divisions so that the entire area of the division is covered. The sampling and analysis studies were carried out as per standard procedure described in Peavy et al. (1985).The opinion of the public regarding the services of MCE collected through questionnaires according to Raje.et.al (2001) and Buenrostro et al, (2001) using Door-to-Door surveying in order to obtain data about MSW.
A. Quartering Method
Quartering, random sampling, stratified sampling and cluster sampling methods are evaluated for precision and efficiency in the analysis of municipal solid wastes (MSW). The optimum method for sampling MSW is proposed and related to the object of the sampling as per MSW Management and Handling Rules, 2001, MoEF.
The main results are as follows:
1. Based on observations made on the movement of tracers, the mixing stage in the quartering method can be done accurately if the weight of MSW is less than about 50kg.
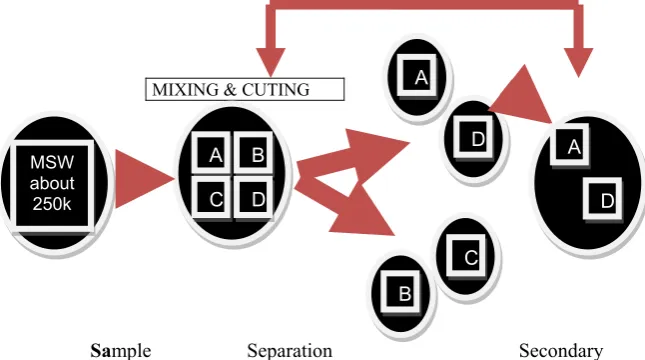
2. The more separation that is carried out in the quartering, the larger the relative error of the composition. However, the error is smaller if MSW is cut into smaller pieces before quartering. MSW is divided into four sections after cutting large pieces and mixing, and two diagonal sections are again mixed. These operations are shown in figure 3 &4 are done several times by four or five men.Repeat several times until MSW weight is 20-30 kg.
Sample Separation Secondary
Figure 3. General flow chart of quarteringmethod (en.wikipedia.org/wiki/incineration)
MIXING & CUTING
MSW about
250k
A B
C D
A
D
B
C
A
241
Figure 4 Image Of Quartering Method done at Ponangi Dump yard, Eluru for the representative sample of Lab analasys
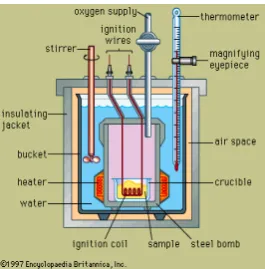
B. Calorific Value
Calorific value is the amount of heat generated from combustion of a unit weight of a substance, expressed as kcal/kg. The calorific value is determined experimentally using Bomb calorimeter in which the heat generated at a constant temperature of 250c from the combustion of a dry sample is measured. Since the test temperature is below the boiling point of water, the combustion water remains in the liquid state. However, during combustion the temperature of the combustion gases remains above 100 degrees centigrade so that the water resulting from combustion is in the vapour state shows typical values of the residue and calorific value for the components of municipal solid waste as shown in table 5. While evaluating incineration as a means of disposal or energy recovery, the following points should be kept in view:
Organic material yields energy only when dry;
The moisture contained as free water in the waste reduces the dry organic material per kilogram of waste and requires a significant amount of energy for evaporation and the ash content of the waste reduces the proportion of dry organic material per kilogram of waste. It also retains some heat when removed from the furnace.
Figure 5. Image of Bomb Calorimeter Experiment Set Up(en.wikipedia.org/wiki/calorimeter)
TABLE6. PROXIMATE AND ULTIMATE ANALYSIS OF THE REPRESENTATIVE
SAMPLE BY QUARTERING METHOD OF MSW OF ELURU MUNICIPAL
CORPORATION (M/S GADARK LAB LTD, MUMBAI, LAB ANALYSIS
REPORT OF REPRESENTATIVE SAMPLE OF MSW, RECOGNIZED BY MOEF)
Parameter Units Test Result
Proximate Analysis
Moisture % 30.85
Volatile Matter % 51.72
Ash % 48.28
Fixed Carbon % 9.8
Ultimate Analysis
Carbon % 31.39
Hydrogen % 2.65
Oxygen % 13.50
Sulphur % 0.72
Nitrogen % 0.92
Chlorine % 0.09
Mineral Matter % 50.73
Gross Calorific Value K.Cal / Kg 1080.0 Note: All the values are on dry weight basis except moisture.
IV. RESULTS
A. Net Power Calculation
Case I: Theoretical net power generation potential (Based on
Moef lab analysis)
Net calorific value = Gross calorific value – latent heat of water vapour formed.
=GCV-Mass of hydrogen per unit weight of fuel burnt x 9 x latent Heat of steam
= GCV – 0.09 x H x 587 = 1080-0.09x2.65x587 = 940 kcal/kg
H=% of hydrogen. Given
NCV = 940 kcal/kg % of Hydrogen = 2.65
Let total waste quantity (w) = 60 metric tones Gross calorific value = 1080 kcal/kg
For 60 tons,
Energy recovery potential = NCV x w x 1000/860 = 940 x 60 x1000/860 = 65581.395 kWh
Power generation potential = 1.16 x NCV x w/24 = 1.16 x 940 x 60/24
= 2726 kW
Case II: Net power generation potential (Based on
experimentation): Given,
GCV = 1687.73 kcal/kg
Total % of Hydrogen = 9.8 +2.65 =12.45%
NCV = GCV-0.09 x H x 587 Kcal/Kg. = 1687.73-0.09 x 12.45 x 587
= 1030 kcal/kg
For 60 tons,
Energy recovery potential = NCV x W x 1000/860 = 1030 x 60 x 1000/860 = 71860.47 kWh
Power generation potential = 1.16 x NCV x W /24 = 1.16 x 1030 x 60/24
= 2987 kW
By the above value we can predict that by using solid waste in ELURU, nearly 3MW of power can be generated. For higher capacity plant MSW collection can be planned from near by villages of corporation.
242 Average higher calorific value of Municipal Solid Waste =1687.74 kcal/kg
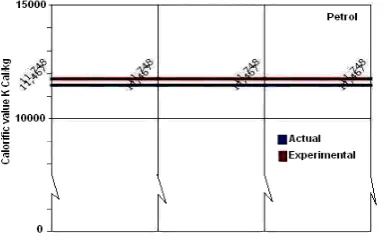
Graphs comparing actual and experimental calorific values for some fuels:
Figure 6. Actual and experimental variations between calorific values of Benzoic Acid
Figure 7. Actual and experimental variations between calorific values of paper.
Figure 8. Actual and experimental variations between calorific values of Petrol
Figure 9: Actual and experimental variations between calorific values of Rice Husk.
V. CONCLUSION
The Municipal Corporation being the responsible authority for MSW in addition to wide range of responsibilities related to health and sanitation has not been very effective as far as MSW services are concerned. Collection, transportation and disposal of all the three components of waste lack in terms of infrastructure, maintenance and up gradation. However, the weakest link in the chain of waste management in Indian situations is the collection of waste. This analysis unambiguously shows that recycling impact is of importance in the prediction of solid waste generation. Waste to Energy (WTE) is a proven, environmentally sound process that provides reliable electricity generation and is extensively used in Europe and other developed nations in Asia. MSW depending upon the moisture and energy content of waste material is a good fuel source. The thermal treatment of MSW results in the generation of 500-600 Kwh of electricity per ton of MSW combusted.
This study provides a scope for the planning of Energy projects in India by mixing urban waste with other wastes of renewable nature like rice husk or biogases as back-up fuel which is eligible as per the national programme on energy recovery from urban waste of the Ministry of New and Renewable Energy, Govt. of India. The degree of accuracy of this analysis is determined by the reliability of the published information, which has been provided by Municipal Corporation of Eluru.
REFERENCES [1] Abu Qdais HA, Hamoda MF, Newham J, (1997) [2] Waste Management & Research, - wmr.sagepub.com
[3] Anonymous (2009) Maps collected from MCE, Office of the Commissioner, Eluru, India
[4] Anonymous (2009) Maps redrawn representing the location of samples in each division by the author.
[5] Anonymous (2000) Ministry of Environment and Forests, Govt. of India, MSW (Management and Handling Rules 2000) available on line [6] Anonymous (2010) Data from Commissioner, Municipal Corporation
of Eluru, India ,Feb’2010 .
[7] Anonymous (2010)Commissioner,Feb’2010. Data collected from MCE
[8] Buenrostro O, Bocco G, Vence J, (2001) Forecasting generation of Urban solid waste in developing countries- a case study in Mexico, Journal of Air and Waste Management Association, 51, 86-93. [9] Peavy HS, Rawe DR, Tehobanoglous G, (1985) Environment
Engg. ,MC Graw-Hill book company, Singapore.
[10] Raje DV, Wakhare PD, Dishpande AW, Bhide AD, (2001) An approach to access level of satisfaction of the residents in relation to SWM system; Journal of waste Management and Research 19, 12-19. [11] UPS-1-en.wikipedia.org/wiki/Municipal_solid_waste
[12] UPS-2-www.terienvis.nic.in/times6-1.pdf [13] UPS-3-www.westgodavari.comUPS-4-
en.wikipedia.org/wiki/Incineration
[14] UPS-5- Accessed in April 2010 ,Waste To Energy ,Summary report online www.asme.org.
243
TABLE7.CALORIFIC VALUES OF SOLID WASTE BY EXPERIMENTATION
S.
No sample
Initial temp ‘t1’
Final temp ‘t2’
Higher calorific
value kcal/kg
Lower calorific value kcal/kg
Actual calorific
value kcal/kg
1 Benzoic acid 26.5 30.2 7026.3 6507.19 6325
2 Paper 26.5 29.12 4975.38 4456.27 4222 3 Rice husk 26.00 28.38 4519.62 3725.79 3500 4 Diesel 26.00 32.12 11621.88 11102.77 10702.85 5 Petrol 26.00 32.46 12267.54 11748.43 11467.98
TABLE8 CALORIFIC VALUES OF STANDARD FUELS BY EXPERIMENTATION
S.
No Sample Mass
of
Mass of
Water equivalent ’w’
Initial temp
Final temp
Higher calorific
Lower calorific
1 waste Solid 1 1771 0.128 26.5 27.40 1709.10 1051.36
2 waste Solid 1 1771 0.128 26.5 27.43 1766.07 1108.33
3 waste Solid 1 1771 0.128 26.5 27.36 1633.14 957.41
4 waste Solid 1 1771 0.128 26.5 27.39 1690.11 1032.38
5 Solid
waste 1 1771 0.128 26.5 27.41 1728.09 1070.36
6 waste Solid 1 1771 0.128 26.5 27.42 1747.08 1089.35
7 waste Solid 1 1771 0.128 26.5 27.38 1671.12 1013.39
8 waste Solid 1 1771 0.128 26 27.32 1557.18 899.45
TABLE9.BLENDING OF SOLID WASTE WITH RICE HUSK BY EXPERIMENTATION
S.
No Sample
Initial temp t1
Final temp t2
Higher calorific
value kcal/kg
Lower calorific
value kcal/kg
1 Rice husk 50% + solid waste 50% 26 27.56 2962.44 1946.73
2 Rice husk 40% + Solid waste 60% 26 27.45 2753.55 1737.84
3 Rice husk 30% + solid waste 70% 26 27.34 2544.66 1528.95