The Sub Surface Modeling of Opak Fault Yogyakarta
Region With Inversion Method of Gravity Data
M. Irham Nurwidyanto)
1, Kirbani SB)
2, Sismanto)
2, Waluyo)
2)1, S-3 (PhD) Student Physics Department of FMIPA UGM and Lecturer in the Physics department in the Faculty of Sciences and Mathematics UNDIP ([email protected])
) 2, Lecturer at the Physics Department in the Faculty of Mathematics And Natural Sciences UGM
Abstract-- Survey measurement of the relative gravitational field in the central part of the southern area of Yogyakarta has been performed. In this survey successfully measured relative gravity field 470 measurement points were distributed almost evenly
spanning an area of 30 km x 30 km. Distribution of measurement
points through the area suspected Opak Fault shown on the geological maps published by the Geological Research and Development Center Bandung. This study aims to model the subsurface conditions of the Opak Fault Yogyakarta based on the rock density contrast value with the inverse method of gravity data.
In order to measure the relative gravity fields is used a La-coste & Romberg gravity meter type G-1118 MVR, whereas the location of measurement and the height of the measuring point uses Trimble GPS Navigations 4600 LS type. The distribution of point measurements were performed by using semi-grid pattern with a trajectory passing through the measurement of existing roads or footpaths to the distance between the trajectory of about 1-2 km and the distance between the point of measurement varied from about 0.5 km - 2 km. The relative gravity data measured then doing the process , among others, the calibration readings into units of mgal, drift correction, high correction tools, tidal correction, correction of normal gravity, free air correction, Bouguer correction and terrain correction. The gravitational field data has been done and corrected, called the Complete Bouguer Anomaly (CBA) in the topography (at the point of measurement). The CBA data obtained is then projected on a horizontal plane at a height of 500 m above sea level with approach a point source equivalent mass at a depth of 5000 m below the reference spheroid used Damney method. The CBA data that has been projected on a plane then separated for the local components and regional components do further modeling and interpretation.
To determine the Opak Fault zone, the data of CBA local components obtained are then calculated the value of the horizontal gradient. The position of the fault zone is indicated by the maximum horizontal gradient value. To model the subsurface rock conditions based on the rocks density contrast value using inversion modeling is done with software Grav3D from UBC (University of British Columbia). The area with small density contrast values to negative is the area of suspected as fault zone. It is a weak zone. From the results of the 3D inverse modeling in the study area was found in three areas was interpreted as a fault, which is in the western part and the eastern parts of hills that stretches from Parang Tritis to Prambanan trending southwest to northeast and in the south of the study area trending northwest-southeast. The weak zone located in the western part of hills is interpreted as a Opak Fault. The weak zone in the eastern part of hills is interpreted as another fault
which proposed with the name of Oya Fault. The Weak zone located in the southern part of the study area is interpreted as another fault which proposed with the name of Siluk Fault. The Oya Fault and the Siluk Fault was estimated as fault caused the earthquake in Yogyakarta and Central Java on May 27, 2006. The estimation for location the Oya Fault and the Siluk Fault are correlation with the location of aftershocks (Walter, et al. 2008) and adjacent to the position of the epicenter of the main quake, according to the USGS (Elnashai, et al 2007).
Index Term-- Opak Fault, Gravity Method, 3D Inversion.
I. INTRODUCTION
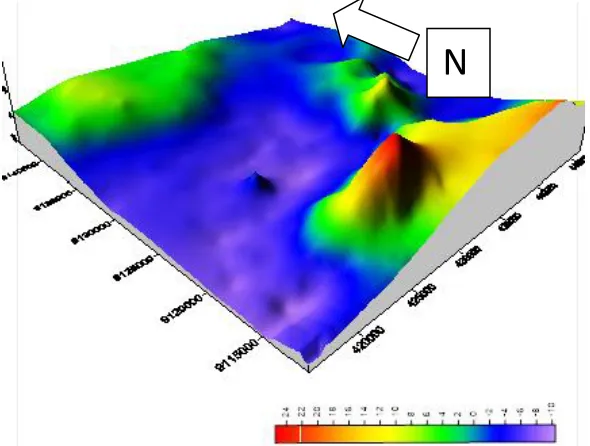
The Research area is located in the central part of southern region of Yogyakarta, Indonesia. It lies between Oya River as the east border and Progo river as the west border, between an active Merapi volcano in the north, and the Indian Ocean in the south. The detailed topography in the research area in 2D view and 3D view in UTM coordinate is shown in Figure-1.
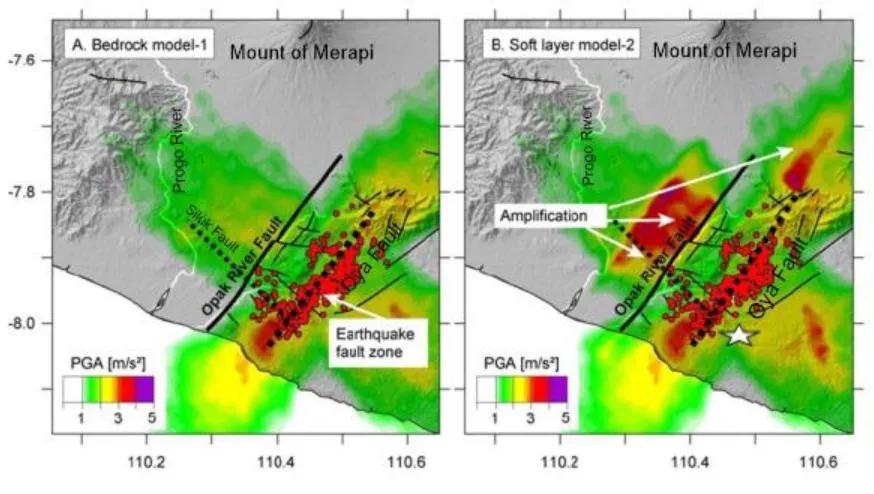
The existence of the Opak Fault has been estimated by geologists and described on Geological map Yogyakarta sheet published by Geological Research and Development Centre of Indonesia (Rahardjo et al., 1995). The Opak Fault became more popular after the events of May 27, 2006 earthquake. Most experts in earth sciences (Sulaiman, et al., 2008, Natawidjaya , et al., 2007, Soebawa, et al., 2008, Mulyaningsih, et al, 2009) assume that the earthquake is caused by the activation of the Opak Fault. The opinion is justified by the huge number of causalities and damage that happen in the Opak Fault area. The distribution map of damage and casualties caused by the earthquake is shown in Figure-2 (Walter, et al., 2008).
east of the Opak Fault (Walter. et al 2008). Based on the study and analysis of Landsat TM, Gravity and Paleontology (Barianto, et al., 2009) and the compilation of previous researchers interpret that Yogyakarta has many faults, the results can be summarized as shown in Figure-3.
From the foregoing problems encountered the Opak Fault, this study focused to discuss where is the exact location of the Opak Fault, and whether there are other faults in the area that caused of the May 27, 2006 earthquake. In order to model the subsurface condition in the research area, we used the gravity method. The fault zone experienced a shift or dislocation so that the zone will experience cracking, and destruction that will have a lower rock density values when compared with the surrounding zone. The Gravity methods are chosen because this method can image the subsurface rock conditions. It is sensitive to change in the rock density contrast value. Penetration of this method is also quite in addition to this method is more environmentally and friendly because it belongs to the category of passive methods (without giving any signal to the earth) and operational costs are cheaper than other geophysical methods such as seismic methods, or electromagnetic methods.
REGIONAL GEOLOGY
The Opak fault existence has been known through the investigation of gravity methods by Oentung, et. al. (1973). The Opak Fault existence poured on the geological map sheet of Yogyakarta is published by Geological Research and Development Center of Indonesia, Bandung (Rahardjo, et. al. 1977 updated 1995). These fault location is surrounded along the flow of the Opak River that stretches from Prambanan to its estuary in Depok beach (west coast of Parangtritis). The Opak Fault explored further, fault type and its development use geological method by Sudarno (1997).
Based on the distribution of physiographic zones in Central Java compiled by Van Bemmelen (1949) study area is part of the Southern Mountains Zone. The morphology of the study area can be grouped into three units. The first unit of plains locates on the west side of the Prambanan up Opak River estuary. This unit is part of Yogyakarta lowland sediments composed of alluvial volcanic product of Merapi Mount. The second unit is a powerful relief hills which runs along the east side of the Opak River, this unit is composed by sedimentary rocks. The third unit is a plateau that is part of the Highlands Wonosari composed of limestone reefs and this associated.
Stratigraphy of the study area is generally composed by gravity sedimentation results in the Miocene epoch (Toha, et.al, 1994, Mulyaningsih, et.al., 2008). Based on the Geological Map Sheet of Yogyakarta compiled by Rahardjo et al. (1977, 1995) the sediment gravity is divided in several formations. Successive rock formations from old to young are: The first and the oldest rocks which exposed in the study area is the Semilir Formation. It is composed by successively of tuff, pumice breccia, dacite tuff and andecite tuff, tuffaceous mudstone and shale. This formation deposits at the end of the Lower Miocene. The second is called the Nglanggran Formation. This formations composed of volcanic breccia
with fragments of andecite, flow breccias, agglomerates, lava, and tuff. This formation deposits in Middle of Miocene in the bottom and inter-fingering with the Semilir Formation. The thirth is the Sambipitu Formation. It is composed by successively of sandstones and shale, siltstone, tuff and conglomerate. This formation deposits in the Middle of Miocene and deposits conformity over the Nglanggran Formation. The fourth is the Wonosari Formation. It is composed of limestone, reefs, calcarenite and calcarenite tuffaceous. This formation deposits in Middle of Miocene to Upper Miocene and is aligned above the Sambipitu Formation. The fifth is the Kepek Formation. It is composed by successively of layered limestone and marl. This formation deposits in Upper Miocene and as stratigraphically related with inter-fingering to the Wonosari Formation. The top layer is the Quarter deposits. It is composed of alluvial of the Mounth Merapi Product.
In general, the rocks constituent of the formations mentioned above have accrued sloping towards the south. The Opak Fault is a major geologic structure which is down (norml fault) which is a fault reactivation of pre-existing Horizontal fault (Sudarno, 1997). Several other faults mapped in the Geological Map Sheet of Yogyakarta include Horizontal Fault that passes through most of Oyo River east-west trending relative. Minor faults found in many areas of research in almost all the existing formations and generally relative trending northwest to southeast.
II. METHODS
The study was conducted by measuring the relative gravitational field in the region through the area that was interpreted as a Opak Fault depicted on the geologic map sheet of Yogyakarta published by Geological Research and Development Centre, Bandung (Rahardjo, 1977, 1995). Measurements were taken at each measuring point and at any predetermined trajectory. Determining the location of measuring point distribution grid and random located on the surrounding of the existing roads in the area of research by considering accessibility of these points. In making measurements using looping and fastening systems, to drift corrections.
The main equipment for the measurement of the gravitational field are used a unit of La-Coste & Romberg gravity meter G-1118 MVR type which has accuracy of order in μgal (1 gal = 1 g/cm2). The next equipment are two units
(one set) GPS Trimble Navigations 4600 LS type to measure the coordinates (longitude, latitude and altitude) measurement point and a Garmin GPS III Plus for field orientation and some supporting tools such as compass geology, topography map, geological map and Note Book .
The output data in field measurement such as time, coordinates and altitude of the measuring point and the data readout of gravity meter. Data readings obtained gravity meter then calibrated into units of mgal (miligal), then tidal correction and drift correction in order to obtain the gravity observations (gobs) value. The gobs value then corrected with
and terrain correction, it is call the CBA (Complete Buguer Anomaly) (Telford, et al, 1990, Reynold, 1997). The Rock density values used in the Bouguer correction was 2.2 g/cc were selected used analytical Netleton methods (Netleton et al, 1976). Methods equivalent point masses from Damney (Blakely, 1995) is used to projected on a flat surface on the value of the CBA in the topography. The results CBA obtained then projected on a horizontal plane at a height of 500 m above sea level with a depth of a point source equivalent mass of 5000 m below the reference spheroid. The CBA values projected onto a flat surface still contains of local components and regional components. Local components associated with local and shallow reasons as example due to faults, igneous intrusions, salt domes and other causes. Components of regional anomalies associated with the cause and the relatively more continuous conditions such as sedimentation basins. In order to separate the local component and the regional component upward continuation methods is used (Grant, et. al 1965, Blakely, 1995).
To estimate the fault zone in the study area we use the local component of the CBA. We then calculate the value of horizontal gradient of CBA local component due to further analysis. Based on forward modeling study, (Taushmalani, 2010, Irham, et. al., 2011) the fault positions are at its maximum value of horizontal gradient for the vertical normal faults, or are around the maximum gradient value for the dipping normal fault.
In Order to model the subsurface conditions of the fault and performed a 3D inverse modeling of the CBA local components data are used Grav3D software from UBC (University of British Columbia). Software is made by UBC Geophysical Inversion Facility, Department of Earth and Ocean Sciences. Gravity inversion method is to determine the density distribution of rocks in the earth's gravitational field using measurement data carried on the surface of the earth.
III. RESULTS AND DISCUSSION
The data obtained from the measurement results after data processing can be described map of the local component of Complete Bouguer Anomaly (CBA) which are shown in Figure-3. From this figure we can divide in four category. The first is the lowest (violet color) and the seconds is the low (blue color) anomaly which is in the middle of study area with trending southwest to northeast. It is correlated with low density of rock material in the sub surface. The third is the high (green to yellow color) anomaly in the southern area, it is correlated with high topography of mountain Prambanan to Parangtritis. It is correlated with high density of rock material in the sub surface. The fourth is the higher (yellow to red color) in the southern and the northern area are indicated the intrusion of igneous rock zone.
In order to estimate the position of the fault zone the local component of CBA anomalies in the data count value of the horizontal gradient results are shown in Figure-5. The fault zones or lithological boundaries are indicated by the maximum of horizontal gradient value (Taushmalani, 2010, Irham, et.al. 2011).
Based on the analysis of the horizontal gradient value, as shown in Figure-5 there are three fault zones in the study area. The first are indicated by a dashed line which interpreted as the Opak Fault. The second and the third fault are indicated by dots line in red which indicated the eastern and the southern fault.
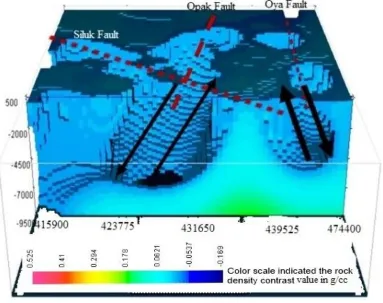
From the local anomaly data, the sub surface modeled based on the rocks density contrast value used inversion method using a Grav3D software. The results of 3D modeling in the south of the study area (near Parang Tritis) are shown in Figure -6, whereas in the central part of the study area is shown in Figure-7. The rocks density contrast value from the upper view in 2000 m depth are shown in Figure-8. The areas with density contrast of small value (close to zero) until the negative-value is interpreted as fault zone as a weak zone.
Fault zone in the study area are grouped in three parts: The first is in the western parts and the seconds is in the eastern, it is limited by the high topography (hills) which extends from Parangtritis to Prambanan with southwest-northeast trending. The third is in the southern with southeast to northwest trending.
In Figure 6, and Figure 7, the fault is located on the western is presented by the dashed line in red is interpreted as a Opak Fault. While the fault is located in the eastern fault is presented by the dot line in red interpreted as Oya Fault due to its location corresponds to Oya River. The fault in the southern part of the direction from southeast to northwest is interpreted as Siluk Fault because of this fault past lowly of Siluk. It is presented by the dot line in red. In Figure-8, the Opak Fault is presented by Black line, the Oya Fault is presented by blue line and the Siluk Fault is presented by yellow line. The Oya Fault and the Siluk Fault are interpreted as the fault which caused of Yogyakarta Earthquake on May 27, 2006. Estimation is based on the fact that the location of the fault in the eastern and southern parts corresponding to the location of the epicenter of the aftershock published by Walter, et. al., 2008, as shown in Figure-9. In addition to the south edge of the Oya Fault location and the east edge of the Siluk Faults location is also adjacent to the location of the epicenter of the earthquake May 26, 2006 which determine by USGS in UTM coordinates with easting 440 486 and northing 9120085 or geographical coordinate in -7.96o S and 110.46o E (Elnashai, 2008).
V. CONCLUSION
the earthquake on 27 May 2006. The reason because the location of the Oya Fault and the Siluk Fault are correlated with the location of aftershocks. The South end of Oya Fault and the east end of Siluk Fault is also adjacent to the position of the epicenter of the main earthquake on May 27, 2006.
SUGGESTIONS
To reveal the subsurface conditions in the study area is necessary to do a comparative study with other methods eg seismic method or CSAMT methods. It has not been conducted yet because of the limited funds and time.
ACKNOWLEDGMENTS
We deepest gratitude goes to Prof. Dr Djoko Santoso, M.Sc. through Dr. M Sarkowi M.Si. We thank them for their kindness and willingness, so that we are able to use the Grav3D software as a licensee. We appreciation goes to many others, whose name are not mention here, for helping in writing and completing this article.
REFERENCE
[1] Abidin ZH, Andreas H, Meliano, I, Gamal M, Kusuma MA, Kimata M, and Ando, M, 2007, Seismic Deformation Yogyakarta Earthquake From GPS Survey, Journal of Geophysical Indonesia, Issue 2007, No. 1.
[2] Barianto, DH, Aboud, E, and Setiadji, LD, 2009, Memoirs of the Faculty of Engineering, Kyushu University, Vol. 69, N0.2, June 2009.
[3] Blakely, RJ, 1995, Potential Theory in Gravity and Magnetic Applications, Cambridge University Press, New York
[4] Elnashai US, Kim, SJ, Yun, GJ and Sidarta, D, 2008, The Yogyakarta eathquake of May 27, 2006, Maec report no. 07-02. [5] Grant, F.S. and West, G.F. 1965, Interpretation Theory in Applied
Geophysics, New York, McGraw-Hill.
[6] GRAV3D Version 2.0, 2001, A Program Library for Forward Modelling and Inversion of Gravity Data over 3D Structures. UBC-Geophysical Inversion Facility Department of Earth and Ocean Sciences University of British Columbia Vancouver, British Columbia
[7] Irham, MN, and Setiawan, A, 2011, Modeling gravity anomalies of fault by the model sheet approach, Periodic Physics, Vol. 14 no. 3, Diponegoro University, Semarang
[8] Mulyaningsih S, Husadani, YT, Devi, LR, and Irawan, SN, 2009, Distribution Analysis of Earthquake May 27, 2006 damage through the gifts of the Holy Mountain Approach in Wonolelo Area, Bantul Regency of Yogyakarta Special Region, Technoscientia Technology Journal Vol 1 No 2 February 2009, ISSN: 1979-8415.
[9] Natawidjaya, DH and Triyoso, W, 2007, The Sumatra Fault Zone: from the source to the hazard, Proceedings of the International Workshop on Earthquake and Tsunami From Source to Hazards, National University of Singapure, Singapore, March 6-9. [10] Nettleton, LL, 1976, Gravity and Magnetics in Oil Prospecting,
McGraw-Hill, New York.
[11] Rahardjo, W, Rumidi, S, and Rosidi, H, 1995, Geological map sheet of Yogyakarta, Geological Research and Development Centre of Indonesia, Bandung.
[12] Reynold, J.M, 1997, An Introduction To Applied And Environmental Geophysics, John-Wiley&Sons Ltd, West Sussex, England.
[13] Subawa, E, Tohari A, and Sarah, D., 2007, Study of liquefaction potential of Regional Fault Zone Opaque Patalan-Bantul, Yogyakarta, Proceedings of the Seminar Geotechnology Contributions Sustainable Development of Earth Sciences, Bandung. ISBN: 978-979-799-5.
[14] Sudarno, I, 1997, Fault Reactivation Instructions Existence Around The Watershed Opak, North Side Jiwo Hills And South Mountains Feet, Media Engineering No. 1 Year XIX edition of February 1997..
[15] Sulaiman, C, Dewi, LC, and Triyoso, W, 2008, Characterization of the 2006 Yogyakarta earthquake source based on GPS data, Journal of Indonesian Geology, Vol. 3, No. 1, March 2008. [16] Telford, W.M., Geldart, R.E., Sheriff, D.A., and Keys, 1990,
Applied Geophysics, Cambridge University Press.
[17] Toha B, Purtyasti, RD, Sriyono, Soetoto, Rahardjo, W. and Subagyo, P, 1996, South Mountain Regional Geology An Contributions, Proceedings of the Geological and Geotechnical Java, ISBN: 792-8611-00-4.
[18] Tousmalani, R., 2010, Application of gravity method in Path Fault Detection, Australian Journal of Basic And Applied Sciences (AJBAS), 4 (12): 6450-6460, 2010 ISSN 1991-8178 © 2010, INSInet Publication.
[19] Oentoeng, M., 2008, set of papers Muhammad Oentoeng period 1959 -2004, Geological Agency, Center for Energy and Mineral Resources Geology Survey.
[20] Walter, TR, Wang R, Leuher, BG, Wassermann J, Behr, Y, Parolai S, Anggraini A, Gunther E, Sobieseak, M, Grosser H, Wetzel HU, Milkereit, C PJ, Sri Broto Puspito, K, P Harjadi , Zcshau, J., 2008, The 26 May Yogyakarta Earthquake of magnitude 6.4 south of Merapi Vulvano: did lahar deposits amplify ground shaking and Tus lead to the disaster ?, G3, Volume 9, Number 5, May 15, 2008 ISSN: 1525-2027. Publeshed by AGU and the geochemical Society.
Fig. 1. The detail topography of research area, in 2D view and 3D view
Fig. 2. The distribution number houses destroyed or heavily damaged was struck by Yogyakarta Earthquake on May 27, 2006, (Walter, et.al, 2008)
Fig. 4. Local component of CBA map in UTM coordinate, color scale indicated the value of CBA in mgal.
Fig. 5. Horizontal gradient of the local component of CBA, color indicated the value of gradient scale in mgal/m, dash line in red indicated the Opak Fault, dot line in red indicated the eastern fault which name by the Oya Fault, dot line in red in the southern indicated the southern fault which name by the Siluk Fault. The white star indicated the epicenter of main shock of earthquake on May 27 2006 by USGS.
N
N
Sudimoro
mountain
Intrusions
of igneous
rock
mountain
Fault in
eastern part
mountain
Opak Fault
Southern
fault
mountain
Fig. 6. The result of 3D modeling sub surface in the research area by using Grav3D software at 9112300 northing (southern of study area near the Parang Tritis beach) cross section by cutoff negative density contras value. Parallel arrow indicated the fault location in the sub surface, red dash line indicated Opak Fault, red dot line indicated the eastern fault and southern fault in the surface . Color scale indicated the density contras of rock in g/cc with respect to 2.2 g/cc.
Fig. 7. The result of 3D modeling sub surface research area by using Grav3D software at 9121800 northing (center of study area) cross section by cutoff negative density contras value. Parallel arrow indicated the fault location in the subsurface and red dash line indicated the Opak Fault, red dot line indicated the
Fig. 8. The result of 3D modeling sub surface in the research area by using Grav3D software. The cross section density contrast value from the upper view in 2000 m depth below sea level. The Black line color interpreted as the Opak Fault, the blue line color interpreted as the Oya Fault, and the
yellow line interpreted as the Siluk Fault. Color scale indicated the rock density contras value in g/cc with respect to 2.2 g/cc