Abstract—In this paper, we use input-output analysis and commodity exporting data of China during 1999-2012 to conduct an empirical study and calculate carbon embodiments in China’s exporting goods. The results show that China has been exporting a large amount of carbon embodiments, and its increase of CO2 emissions has a close relationship with its export and import, among the annual CO2 emissions of China, about 12%-24% were caused by the demands of other countries.
Index Terms—Carbon emissions embodied, import, export, China.
I.
INTRODUCTION
Climate change is one of the most enormous challenges to
international community. The extreme weather is rising and
has attracted many organizations and researchers [1].
Countries have made efforts to reduce CO
2emissions which
are linked to climate change. The Kyoto Protocol set
emission reduction goals for “Annex I” parties and most of
them are developed countries. But these countries could
reduce their national emissions in many ways, such as the
relocation of production abroad, import substitution.
As the “world factory”, China’s current trade structure is
relatively extensive and sustainability is also relatively weak.
In the meantime, the product structures of exports and
imports have great differences [2]. Imported products are
mostly high value-added, high-tech, low energy density,
low-emission, but export products are mostly high resource
and energy inputs, high emission and low value-added. As a
result, China has to sustain the growing trade surplus at the
expense of domestic energy resources consumption and
environmental pollution [3]. For developed countries, they
prefer to transfer these production processes with high
energy consumption, high pollution and CO
2emissions to
China in order to achieve their emission reduction targets [4].
In this paper, we conduct an empirical study and calculates
carbon embodiments in China’s exporting and imported
goods by using input-output method. The results can reflect
the impact of China’s import and export on the growth of
carbon emissions [5]. Based on the analysis, this paper points
out the international society should consider both principle of
producer responsibility and consumer responsibility in
identifying emission responsibilities and emission reduction
targets of each country, and Chinese government should
make great efforts in improving production technology,
Manuscript received December 24, 2016, revised February 30, 2016. The authors are with University of Science and Technology Beijing, China (e-mail: [email protected]).
reducing the energy consumption intensity embodied in its
production, and restricting the exporting of energy-intensive
products.
II.
LITERATURE REVIEW
Currently the national carbon emissions data released by
IPCC is based on the Polluters Pays Principle (PPP), which is
the principle on how to recognize the specific carbon
emissions responsibility of one country. The PPP was firstly
proposed by the Environment Committee of Organization for
Economic Co-operation and Development (OECD) in 1972,
and its core was to require all polluters to pay for their
pollution. All along, the international community, especially
the OECE countries, adopt the PPP as a fundamental basis for
environmental policy [6]. In terms of carbon emissions, it
requires producers to pay for all the carbon emission during
product process. However, this method only considers the
CO
2emissions directly related to each sector within the
national boundaries, that is to say, it only reflects its
greenhouse gas emissions within the national boundaries,
and does not take the embodied carbon transfer aroused by
foreign trade into account [7].
As an environmental indicator, embodied carbon is used to
describe all the direct and indirect pollution, from upstream
to downstream production process. In recent years, many
countries have paid more and more attention to embodied
carbon. Many studies show that major developed countries in
the world are essentially the net importing countries of
carbon emissions [8]. In contrast, the net exporter of carbon
are mostly developing countries and a few small developed
nations which are mainly composed of resource products.
Some research show that the total carbon emissions in recent
years the total carbon emissions of China are increasing
rapidly, part of which is the embodied carbon in international
trade.
At present, there are few empirical studies on China’s
embodied carbon and they are mostly concentrated on the
theoretical analysis so the research methods needs further
improving [9]. In this study, we focus on empirical models
and data, to work out carbon embodiments in China’s
exporting and imported goods.
III.
METHODOLOGY
A.
Input-Output Model
Input-output analysis is an effective tool to evaluate the
resources and pollution embedded into the goods and
services from the point of macro scale, and it has been widely
Study on Estimates of Embodied Carbon of China: Based
on Input-Output Analysis
output can be showed as follows:
(
)
1X
=
I A
−
−y
(1)
X
is a social gross output column vector.
Y
is the final
product for society column vector.
A
is the coefficient matrix
for production technology, and
I
is a unit matrix.
(
)
1I A
−
−is
the Leontief inverse matrix, which reflects the direct and
indirect input of the final demand in a unit. In an open
economy system,
A
is divided into two parts,
A
dand
A
m.
One is for domestic inputs during usage, the other is for direct
consumption coefficient matrix of imported inputs and
d m
A A
=
+
A
. They are both important when calculating
the embodied carbon emissions in the international trade. The
final social demand can also be decomposed into two parts,
the domestic consumption demand
y
d(including the final
consumption and capital formation) and export demand (
Z
).
Thus, in an open economic system, when considering the
final purpose of demand, the total output of a country should
be expressed as:
(
) (
1)
d d d
X
=
I A
−
−y
+
Z
(2)
We set
E
=
{
F
jdX
dj}
as the direct carbon intensity
matrix of domestic unit output, and
F
jdis the total amount
of carbon emissions directly generated in the domestic sector
j
so the domestic embodied carbon emissions
( )
C
dwhich
could meet the final demands can be showed as:
c
d=
EX
d=
E I
(
−
A
d)
−1(
y
+
Z
)
=
E I
(
−
A
d)
−1y
d+
E I
(
−
A
d)
−1Z
=
R
dy
d+
R
dZ
(3)
(
)
1d d
R
=
E I A
−
−is expressed as the direct and
indirect carbon emissions that meet final demands for units;
d d
R y
represents domestic emissions
( )
C
ddto meet
domestic consumption, and
R Z
dis domestic exports
emissions
( )
C
dz.
However, in order to achieve products and service of final
demands, China still needs to import intermediate inputs
(
A X
m d)
. Besides, the final consumer products may be
imported from abroad
( )
y
m. The China’s total imports of
goods and services from abroad
( )
M
is
M
=
A
mX
d+
y
m=
A
m(
I
−
A
d)
−1(
y
d+
Z
)
(4)
And the total carbon emissions from China’s imported
products or services in foreign countries is as follows:
C
tm=
R
mM
=
R
mA
m(
I
−
A
d)
−1(
y
d+
Z
)
+
R
my
m=
R
mA
m(
I
−
A
d)
−1y
d+
R
mA
m(
I
−
A
d)
−1Z
+
R
my
m(5)
m
R
shows the embodied carbon including direct and
indirect carbon emissions from aboard, while
(
)
1m m d d
R A I A
−
−y
is imported carbon emissions to
obtain domestic consumption.
R A I A
m m(
−
d)
−1Z
is
imported carbon emissions for export demands, that is,
import and re-export emissions
( )
C
mz. The emissions of
imported consumer goods for final consumption is
R y
m m.
In order to meet the final demands of China, the total
carbon emissions
( )
C
t, including domestic emissions
( )
C
dand the total import emissions
( )
C
tm, can be showed
as:
C
d=
C
d+
C
tm=
R
dy
d+
R
dZ
+
R
mA
m(
I
−
A
d)
−1Z
+
R
my
m=
R
d+
R
mA
m(
I
−
A
d)
−1⎡
⎣
⎤
⎦
(
y
d+
Z
)
+
R
my
m(6)
Considering the import and re-export emissions, the total
embodied carbon of China’s total export is:
(
)
1tz d m m d
C
=
R Z R A I A
+
−
−Z
(7)
Moreover, taking off the import and re-export emission,
the actual import embodied carbon in order to meet domestic
consumers’ demands is:
(
)
1md m m d d m m
C
=
R A I A
−
−y
+
R y
(8)
As a result, the net balance of embodied carbon emissions
in Chinese import and export is as follows:
C
b=
C
tz−
C
tm=
C
dz−
C
md=
R
dZ
−
R
mA
m(
I
−
A
d)
−1y
d(9)
B.
Data
TABLEI:2012CHINESE AUTHORITIES EMBODIED CARBON EMISSIONS (MTC) Departments Aggregate
demand emissions
Direct emissions
Domestic emissions
Import emissions
Actual export emissions
Aggregate export emissions
Domestic export
Net export
Agriculture 56.54 38.13 53.65 2.89 2.52 3.53 3.16 1.64
Coal mining and dressing 4.38 89.78 3.58 0.80 0.53 4.16 3.89 3.36
Petroleum & gas 12.64 19.25 0.90 11.74 7.56 5.60 11.41 -6.15
Metal mining 13.15 2.52 2.19 10.96 6.38 5.46 0.88 -5.50
Nonmetal minerals mining 1.78 3.78 1.13 0.65 0.50 1.46 1.31 0.81
Food and tobacco processing 85.14 17.41 83.53 1.60 1.40 7.96 7.75 6.35
Textile industry 51.31 13.77 50.03 1.28 0.57 52.12 51.41 50.84
Clothing, feather and leather 58.45 2.30 57.71 0.74 0.59 27.67 27.52 26.93 Timber processing and
furniture
23.37 2.37 22.96 0.41 0.31 14.64 14.54 14.23
Paper printing 20.19 19.32 18.64 1.55 1.08 17.43 16.95 15.87
Petroleum, coking and nuclear fuel processing
25.80 395.42 16.48 9.31 6.34 22.70 19.72 13.38
Chemical industry 130.90 131.93 104.78 26.11 16.54 92.60 83.03 66.49
Non-mental mineral products 18.97 102.52 17.64 1.34 1.16 21.18 21.00 19.84 Metal smelting and rolling
processing
77.98 329.78 60.66 17.32 11.11 88.86 82.65 71.54
Metal products 48.10 2.96 46.55 1.55 1.07 38.33 37.74 36.67
General and special equipment manufacturing
163.53 10.79 149.41 14.12 11.34 48.79 46.01 34.66
Transportation equipment manufacturing
112.42 6.31 107.43 4.99 4.24 22.58 21.82 17.58
Electrical machinery and communication electronics
manufacturing
263.55 3.57 232.72 30.83 19.06 188.00 176.23 157.17
Instrumentation and cultural office machinery
manufacturing
23.46 0.26 18.41 5.04 3.72 17.95 16.62 12.90
Other manufacturing 18.83 2.68 16.98 1.85 1.29 6.66 6.10 4.81
Electric and heat power supply
49.06 716.25 48.88 0.19 0.13 2.74 2.68 2.56
Gas production and supply 5.40 8.78 5.40 0.00 0.00 0.00 0.00 0.00
Water production and supply 3.10 0.22 3.10 0.00 0.00 0.00 0.00 0.00
Construction 548.07 8.79 547.47 0.50 0.50 3.69 3.69 3.19
Transportation 88.01 108.62 85.16 2.85 2.21 42.25 41.61 39.40
Retail and catering 72.20 14.55 71.75 0.45 0.37 16.49 16.41 16.03
Other services 243.60 21.22 240.05 3.54 3.14 15.55 15.15 12.01
Total 2217.92 2066.30 2053.60 151.61 102.65 767.26 718.31 615.65
1)
Results and analysis
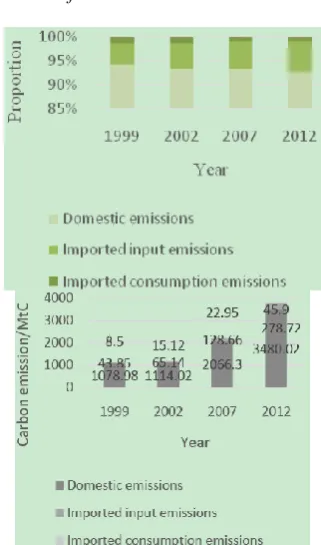
a)
Structure of the total embodied carbon emissions
Fig. 1. Structure of the total embodied carbon emissions.
Fig. 1 shows the structure of the total embodied carbon. On
the total, China’s emissions (including domestic and foreign
emissions) in 1999, 2002, 2007 and 2012 showed sustained
growth, and its growth in 2001 has a significant change after
China joined the WTO.
b)
Import and export embodied carbon emissions in
each sector
In 2012, the construction industry, other services, the
electrical
machinery
and
communication
electronic
equipment manufacturing industry, and the chemical industry
are the most emissions in the total demand, totally accounting
for 53.47% of the national total emissions. In contrast,
non-metallic mining industry (0.08%), water production and
supply industry (0.14%), coal mining and washing industry
(0.20%), gas production and supply industry (0.24%) these
four sectors are the smallest emissions. We can refer to more
specific numerical results from the Table I.
c)
The composition and change of the total imports of
departments
TABLEII:THE COMPOSITION OF THE DEPARTMENTS’TOTAL IMPORTS (%)
Departments Imported inputs emissions and total import emissions Import re-export emissions and total import emissions
1999 2002 2007 2012 1999 2002 2007 2012
Agriculture 54.47 56.76 71.72 75.63 9.18 10.26 19.5 22.87
Coal mining and dressing 98.75 83.25 98.16 97.32 20.73 18.96 33.32 40.13
Petroleum & gas 105.34 95.15 99.49 98.43 25.3 25.02 35.63 37.81
Metal mining 98.36 99.02 98.67 98.31 28.18 26.82 41.73 47.82
Nonmetal minerals mining 97.47 95.52 99.88 103.41 14.52 14.15 23.9 24.5
Food and tobacco processing 37.98 43.35 55.58 58.67 5.85 8.12 12.8 13.7
Textile industry 86.50 86.44 96.84 94.17 34.64 40.34 55.72 68.92
Clothing, feather and leather 32.95 38.18 52.93 61.67 10.41 14.69 19.82 20.53
Timber processing and furniture 72.87 87.68 80.78 80.69 12.16 15.74 24.67 31.28
Paper printing 90.00 89.45 96.30 92.45 19.75 22.35 30.41 38.07
Petroleum, coking and nuclear fuel processing
100.70 98.05 96.95 94.36 18.42 22.24 31.93 37.84
Chemical industry 91.97 91.82 95.59 97.88 23.69 27.04 36.66 42.43
Non-mental mineral products 89.85 93.96 98.50 99.08 7.35 12.03 13.06 15.47
Metal smelting and rolling processing
105.90 97.72 98.87 103.25 24.73 23.30 35.84 39.08
Metal products 84.99 91.15 90.21 90.47 15.23 20.02 31.21 35.66
General and special equipment manufacturing
60.50 57.49 60.72 63.67 11.17 12.18 19.69 22.35
Transportation equipment manufacturing
56.78 60.93 59.42 57.88 9.97 12.35 15.05 17.84
Electrical machinery and communication electronics
manufacturing
72.19 71.23 77.89 80.61 19.05 26.54 38.18 44.79
Instrumentation and cultural office machinery manufacturing
86.53 80.64 76.52 77.49 17.79 17.64 26.30 27.38
Other manufacturing 75.74 70.14 78.13 84.36 19.91 17.63 30.21 39.02
Electric and heat power supply 93.81 85.47 92.80 97.69 20.66 20.94 31.60 35.86
Gas production and supply 0.00 66.59 0.00 0.00 0.00 14.77 0.00 0.00
Water production and supply 6.11 6.55 3.24 2.81 0.83 1.02 0.46 0.38
Construction 84.89 81.21 85.32 86.10 15.20 15.36 17.16 18.95
Transportation 70.44 66.01 60.00 52.33 15.02 15.36 17.16 16.87
Retail and catering 37.09 38.40 40.76 41.55 6.46 7.81 11.26 13.45
Average 85.68 81.30 84.86 83.29 19.45 22.10 32.29 39.07
IV.
C
ONCLUSIONWith the increasingly active foreign trade (especially after
China joined the WTO), China’s carbon emissions have
increased year by year. Since China’s imports come from
different countries and regions, we analyze the imported
embodied carbon of China and find that the average of total
imports emissions which accounts for about 30% is for
re-export demand, while the actual emissions for the import of
domestic consumer demands account for about 75% of the
total each year. Whether total import or actual import
(excluding import and export emissions), electrical machinery
and electronic communication equipment manufacturing
industry, chemical industry, metal smelting and rolling
processing industry, general special equipment manufacturing
industry these four departments are most import emissions.
From the point of the net balance of embodied carbon, China
has always been a net country of embodied carbon emissions
in international trade. Due to the efficiency of China’s energy
use and technological backwardness, the exports of carbon
emissions of China is much higher than other countries,
especially the year from 2005-2007. In all departments, metal
smelting and rolling processing industry, fabricated metal
products and transportation industry these three sectors are
the fastest growing emissions of all.
R
EFERENCES[2] H. Min and W. Shilin, “The origin and progress of embodied carbon in foreign trade,” Journal of Shanghai Business School, vol. 2, pp. 11-17, May 2010.
[3] R. Batra, H Beladi, and R. Frasca, “Environmental pollution and world trade,” Ecological Economics. vol. 45, pp. 171-182, July 1998. [4] G. Machado, R. Schaeffer, and E. Worrell, “Energy and carbon
embodied in the international trade of Brazil: An input-output approach,” Ecological Economics. vol. 39, pp. 409-415, May 2010. [5] I. Mongelli, G. Tassielli, and B. Notarnicola, “Global warming
agreements, international trade and energy/carbon embodiments: An input-output approach to the Italian case,” Energy Policy, vol. 34, pp. 88-96, May 2006.
[6] J. Munksgard and K. Pedersen, “CO2 accounts for open economics:
Produceror consumer responsibility?” Energy Policy, vol. 29, pp. 327-340, April 2001.
[7] G. P. Peters and E. G. Hertwich, “CO2 embodied in international trade
with implication for global climate policy,” Environment Science & Technology, vol. 42, pp. 1401-1411, August 2008.
[8] J. H. Pan, J. Phillips, and Y. Chen, “China’s balance of emissions embodied in trade: Approaches to measurement and allocation international responsibility,” Oxford Review of Economic Policy, vol. 24, pp. 354-367, July 2008.
[9] L. N Moses, “The stability of interregional trading patterns and input-output analysis,” American Economic Review. vol. 45, pp. 803-814, May 1955.
Zhonglin Sheng was born in June 1989 in China. She is a Ph.D student in management in 2016. In University of Science and Technology Beijing, Beijing, China. Her major is in environmental economics and risk management.
Yufei Xin was born in July 1987 in China. She is a Ph.D student in management in University of Science and Technology Beijing, Beijing, China.