www.nat-hazards-earth-syst-sci.net/16/2107/2016/ doi:10.5194/nhess-16-2107-2016
© Author(s) 2016. CC Attribution 3.0 License.
Surface movement above an underground coal
longwall mine after closure
André Vervoort
Department of Civil Engineering, KU Leuven, 3001 Leuven, Belgium
Correspondence to:André Vervoort ([email protected])
Received: 18 April 2016 – Published in Nat. Hazards Earth Syst. Sci. Discuss.: 4 May 2016 Revised: 11 July 2016 – Accepted: 18 August 2016 – Published: 14 September 2016
Abstract.The surface movement in an area of about 22 km2 above the underground coal mine of Houthalen was analyzed based on Interferometry with Synthetic Aperture Radar (In-SAR) measurements. After its closure in 1992, a residual subsidence was observed over a period of several years, fol-lowed by an uplift of the surface above and around the past longwall panels, whereby the rate of movement was, in ab-solute terms, of the same order for the two types of move-ments. The processes behind these movements are differ-ent. The process of subsidence is caused by the caving of the roof above the mined-out area and is mainly a mechani-cal stress-deformation process, including time-dependent as-pects. However, the process of uplift is most probably caused by the swelling of the clay minerals in the argillaceous rocks in the coal strata after the flooding of the underground work-ings. Hence, the areas in which there is the greatest risk of damage to the surface infrastructure are not the same for the hazards linked to subsidence and uplift. For example, the zone in which the maximum uplift occurs clearly is at a different location from that of the zone with the maximum residual subsidence. There is no clear sign that the amount of mining underneath affects the residual subsidence, and there is no indication that the process of uplift is linked directly to the mining characteristics. It is more likely that uplift as the result of flooding is initiated at, or close to, the vertical shafts.
1 Introduction
Most research of the movements of the Earth’s surface above underground mines has focused on the direct impact of min-ing, i.e., the impacts that occur during the lifetime of the
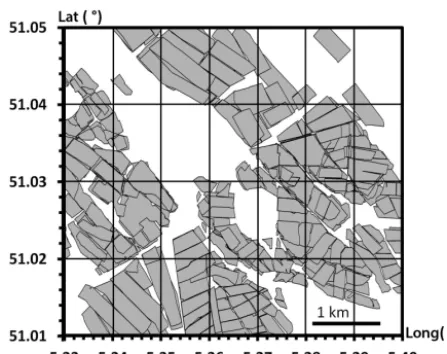
Figure 1.Map of longwall panels in area studied, i.e., between a lat-itude of 51.01–51.05◦N, and between a longitude of 5.33–5.40◦E.
and the ultimate uplift of the surface. To accomplish this, we studied the past mining directly underneath the observation points.
The underground coal mine of Houthalen, Belgium, was closed in 1992. For a period of nearly 2 decades (from 1992 through 2010), we analyzed the movements of the surface above the mine based on radar interferometry or Interferom-etry with Synthetic Aperture Radar (InSAR) measurements. The production of coal in this mine began in 1939, and, in 1964, the mine was merged (and connected underground) with the Zolder coal mine, which is situated to the west of the Houthalen mine. Production was stopped in both mines in 1992, and the access was sealed off. Hence, the under-ground pumps were also stopped, causing flooding of the un-derground work areas, the surrounding rock mass and caved zones.
Longwall mining with goaf was the method used in the mines, and different coal seams were mined. The area in which the detailed study of surface movement was conducted is situated from latitudes of 51.01–51.05◦N and from longi-tudes of 5.33–5.40◦E, an area of approximately 5.0 (EW) by 4.4 (NS) km2(Fig. 1). At a certainX–Y position within the mined area, one to eight different coals seams were mined. The combined mining height of the several seams varied from 2.0 to 12.3 m within this area. The height of the min-ing of individual panels varied from 0.9 to 2.7 m, and, nor-mally, about 10 to 40 cm of it were layers of waste rock. In some cases, either no waste rock was mined or only a few centimeters were mined, but, in other cases, almost 1 m of waste rock was recorded as having been mined. As the map indicates, certain zones were not mined. Apart from the zone around the vertical shafts (around the coordinates of latitude 51.025◦N and longitude 5.370◦E), these unmined zones were mainly areas around faults. The latter were composed of a predominant set of NNW–SSE-striking normal faults
with subordinate N–S- to NE–SW-striking thrust faults. In the later decades of production, a typical longwall panel had dimensions of 200 by 800 to 1000 m. The main and tail gates were immediately adjacent to the panel, and they were just single tunnels with a horseshoe cross section. Therefore, no barrier or remnant pillars existed between the longwall pan-els. In the area that we studied, the mining depth varied from 539 to 967 m, and the mining occurred between 1932 and 1992. However, most of the panels were mined in the 1960s and 1970s. In Sect. 4, more details of the mining characteris-tics are provided, and their possible influences on the surface movements are discussed.
The coal strata in the Campine basin in northeast Belgium belong to the Upper Carboniferous strata (Westphalian unit), the time of the formation of many coal fields in Europe (Lan-genaeker, 2000; Vandenberghe et al., 2014). The top of the Upper Carboniferous strata generally occurs at depths of ap-proximately 400–600 m. The waste rock within these coal strata is composed mainly of argillaceous rocks, like shale and siltstone, and of sandstone and thin (unmined) coal lay-ers. The sandstone is classed as medium-strong, with a typ-ical uniaxial compressive strength (UCS) of 90 MPa (Caers et al., 1997). However, values up to 160 MPa have also been measured. The other types of rocks are classified as weak rock; e.g., siltstone was tested with a UCS value from 17 to 68 MPa with an average of 46 MPa, and coal with a UCS value from 6 to 10 MPa with an average of 7 MPa. The aver-age values of Young’s modulus for these three types of rocks were determined as 28 GPa for sandstone, 9 GPa for siltstone and 1 GPa for coal (Caers et al., 1997). Overall, the succes-sive strata are relatively thin (on the order of decimeters to meters in scale). The overburden is composed of weak to very weak geological material (e.g., sand, clay and chalk). Several aquifers and aquitards are present over the entire sec-tion of the overburden.
2 Radar interferometry data
One of the disadvantages is that, when no reflective surfaces are identified in a specific zone, no information is available on the movement of the surface. For example, this was the case for the area studied in the zones composed of agricul-tural land, woodland and unused or semi-naagricul-tural land. Other problems were (1) that the recorded movement corresponds to the reflection of a surface area of 4×20 m and not of a dis-crete point and (2) that the recordings are not of the Earth’s surface but of reflective objects, which can be hardened sur-faces, such as the roofs of buildings (for the most part), as well as parking lots and roads. This means that for buildings, the type and depth of the foundation and the structure itself affect the movement of the reflector (Dang et al., 2014).
In this study, the European C-band ERS1/2 and ENVISAT-ASAR satellite images were used, which were available for research through a European Space Agency (ESA) research proposal (Devleeschouwer et al., 2008). The recorded peri-ods were for both sets from August 1992 through Decem-ber 2000 (87 cycles of 35 days) and from DecemDecem-ber 2003 through October 2010 (72 cycles of 35 days), respectively. Generally, it is accepted that the linear velocities can be es-timated with accuracies of about 1 mm yr−1(Marinkovic et al., 2009; Sousa et al., 2009). However, these values depend significantly on the number of images and the conditions in which they were obtained as regards to baselines, Doppler centroid distribution, selected pixel density, how they are connected and the presence of atmospheric effects. An ac-curacy of 1 mm yr−1was confirmed (Vervoort and Declercq, 2016) by comparing the InSAR data to the GPS reference points of the Belgian National Geographic Institute (NGI), linked to the reference stations of the Flemish Positioning Service (FLEPOS). For example the reference point HQ10 of NGI, situated 20 cm above the ground level within the same coal mine basin, was compared to the three closest reflectors surrounding this reference point and situated at a maximum horizontal distance of 35 m. For a 5-year period of uplift, 31.0 mm was measured at the NGI reference point, while the InSAR reflectors showed a movement of respectively 25.5, 29.1 and 29.9 mm. As the location of the reference point and the three reflectors are different (plus different size between reference point vs. reflectors), it is normal that the four val-ues are different, but the difference is small, showing that the InSAR data are precise for the purpose of this research.
3 Analysis of surface movement
Earlier research (Vervoort and Declercq, 2016) looked at an-nual increases in surface movement. It showed that, in this area at the end of the first period of observation (from August 1992 through December 2000), uplift had already been initi-ated in certain zones or for certain reflectors. In a similar way, it was observed that, at the start of the second period of ob-servation (from December 2003 through October 2010), cer-tain reflectors were still undergoing downward movement.
Therefore, in the first instance, we looked at 5-year time zones in each observation period, which can be considered to be characterized by a pure downward movement (for the first observation period from August 1992 through mid-August 1997) or a pure upwards movement (for the second observation period from September 2005 through mid-September 2010). The remaining part of each observation pe-riod was also studied and for comparison purposes, a length of 2.5 years was chosen, i.e., the last 2.5 years of the first pe-riod and the first 2.5 years of the second pepe-riod. These two 2.5-year time zones were from July 1998 through December 2000 and from December 2003 through June 2006, respec-tively. As the total first observation period was longer than 7.5 years and the second shorter, there was a gap between the time zones of 5 and 2.5 years in the first period and a small overlap in the second period, but the main advantage of doing so was that all time zones could be compared more easily. Hence, all scales for the graphs that correspond to the 2.5-year time zones are halved.
In this research, downward movement has a negative sign, and uplift has a positive sign; the same convention was used for the rate of movement (e.g., per year). However, when discussing the smallest (minimum) movement or the largest (maximum) movement, we considered the absolute value of the movement; in other words, when discussing the minimum rate, we did not apply the pure mathematical definition of minimum. For the area studied, no public data were available for the subsidence that occurred prior to the satellite obser-vations.
3.1 First observation period, characterized, on average, by subsidence
Table 1.Information on total surface movement during the two times zones of 5 and 2.5 years considered in the first observation period for the total area studied.
Period 1, 5-year time zone, Period 1, 2.5-year time zone, mid-August 1992 to mid-August 1997 July 1998 to December 2000
Number of reflectors 1073 1073
Minimum 5.8 mm 14.9 mm
Average −32.9 mm −9.0 mm
Maximum −79.5 mm −40.5 mm
Standard deviation 11.8 mm 7.2 mm
Skewness∗ 0.83 0.24
∗Positive skewness means a long tail for large values, i.e., large subsidence in the first observation period.
Figure 2.Distribution of total surface movement (in mm):(a) pe-riod 1, 5-year time zone, from August 1992 through mid-August 1997; (b) period 1, 2.5-year time zone, from July 1998 through December 2000. Largest subsidence (negative values) is plotted to the right.
(−6 mm yr−1) and about twice the maximum average rate over the 5 years (−16 mm yr−1).
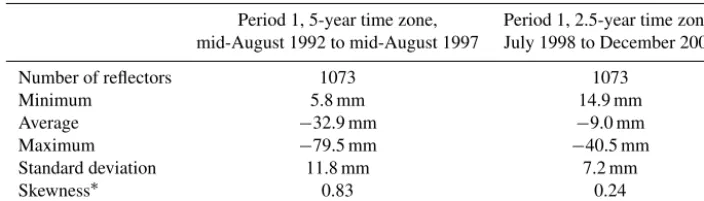
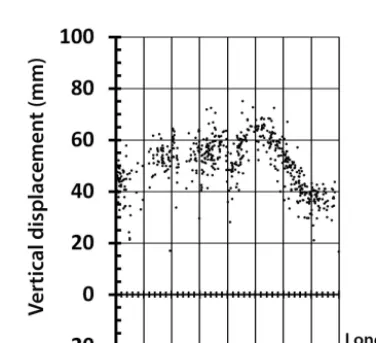
If one looks at the spatial variation of the total surface movement over the 5-year time zone, it is apparent that the largest residual subsidence occurred in the northern central part of the area studied (Fig. 3a). Unfortunately, the reflec-tors were not evenly spread over the entire area. There were several zones with dimensions of a kilometer wide in which there were no reflectors at all. These zones, in this particu-lar case, were farmland, woodland, unused land and a lake.
The combination of large zones without reflectors and the large fluctuation between neighboring points motivated us to present the individual reflectors instead of calculating a con-tour map. The latter would result in too much loss of detail and would result in large uncertainties for certain sub-zones. Figure 3a shows that, although large movements may oc-cur next to small movements, clustering is present. For exam-ple, in the western and southeastern parts of the area studied, the reflectors were mainly characterized by a residual subsi-dence of−20 to−30 mm over the 5 years. Most reflectors with a total residual subsidence over the 5 years of−60 mm or more correspond well with the mined-out area underneath (Fig. 1). In Sect. 4.2, a more detailed analysis is presented with the past exploitation. To better visualize the map of re-flectors, the movement along a north–south line is presented in Fig. 4a. To have a sufficient number of reflectors along this line, a north–south zone was selected for a longitude be-tween 5.37 and 5.38◦E, about 700 m wide in the east–west direction. A slightly longer transect was chosen, as shown in Figs. 1 and 3. No exploitation took place more to the north than latitude 51.05◦N in the transect selected or its imme-diate surroundings; the same is true more to the south than latitude 51.005◦N (Van Tongeren and Dreesen, 2004). In the
northern and southern part, the residual movement was still subsidence but the values were small. In the zone between a latitude of 51.015 and 51.050◦N, mainly movements of −20 mm and more were observed, with the largest values situated between 51.035 and 51.045◦N. The variation of the observed values was about 20 mm. This can be explained by the inaccuracy of the method, by the variation in the east– west direction, and by the local variation between neighbor-ing points.
Figure 3.Spatial variation of total surface movement in the area between a latitude of 51.01–51.05◦N, and a longitude of 5.33– 5.40◦E: (a)period 1, 5-year time zone, from mid-August 1992 through mid-August 1997 (all reflectors; color scale is in mm); (b)period 1, 2.5-year time zone, from July 1998 through Decem-ber 2000 (only reflectors with a upward movement during this time zone).
corresponding reflectors. It is very clear that these locations are complementary to the zone of the largest residual subsi-dence observed in the first 5 years (Fig. 3a). The maximum subsidence rate observed was about the same as during the first 5 years, i.e., about−16 mm yr−1. The average rate was
much smaller, i.e.,−3.6 mm yr−1instead of−6.5 mm yr−1.
When looking at the north–south transect (Fig. 4b), large subsidence values occurred in a similar area as in the 5-year time zone. A peak was observed at a latitude of about 51.04◦N. The variation of the observed values re-mained about 20 mm. As illustrated above, there was a non-negligible number of reflectors characterized by uplifts, also above the unmined areas.
Figure 4.Variation of the total surface movement along a north– south transect, situated for a longitude between 5.37 and 5.38◦E: (a)period 1, 5-year time zone, from August 1992 through mid-August 1997; (b) period 1, 2.5-year time zone, from July 1998 through December 2000.
3.2 Second observation period, characterized, on average, by an uplift
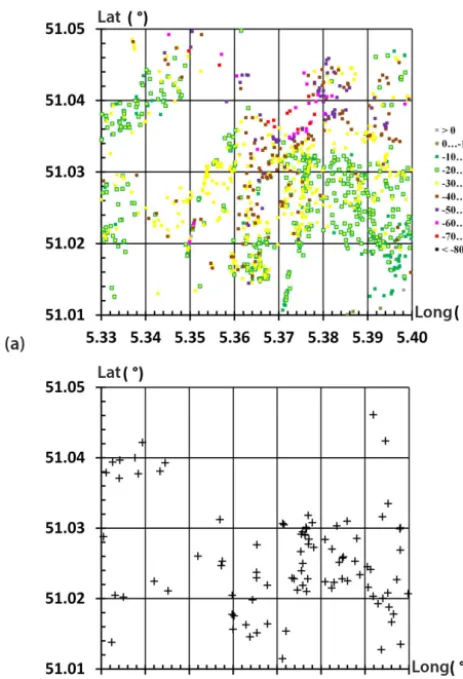
In the 5-year time zone from mid-September 2005 through mid-September 2010 at the end of the second observation period, it becomes obvious that an uplift over the entire area took place (Fig. 5a). Only 6 of the 1808 reflectors had a slight downwards movement over this time period. This justifies the choice of first looking at the last 5 years of the second ob-servation period. The smallest movement was−10 mm (Ta-ble 2). About 75 % of the reflectors underwent uplifts that ranged from 30 to 60 mm. The largest movement of all reflec-tors was 84 mm, corresponding to an average rate of about 17 mm yr−1, while the global average movement was 44 mm or nearly 9 mm yr−1. This means that the rate of uplift was larger than the residual subsidence rate in the 5-year time zone following the closure of the coal mine (e.g., an average rate of−6 vs. 9 mm yr−1). The shape of the distribution was
Table 2.Information on total surface movement during the two times zones of 5 and 2.5 years considered in the second observation period for the total area studied.
Period 2, 5-year time zone Period 2, 2.5-year time zone mid-September 2005 to mid-September 2010 December 2003 to June 2006
Number of reflectors 1808 1808
Minimum −9.9 mm −21.7 mm
Average 43.9 mm 11.8 mm
Maximum 83.5 mm 37.1 mm
Standard deviation 13.8 mm 7.6 mm
Skewness∗ −0.58 −0.19
∗Negative skewness means a long tail for small values, i.e., small uplift in the second observation period.
Figure 5.Distribution of total surface movement (in mm):(a) pe-riod 2, 5-year time zone, from September 2005 through mid-September 2010;(b)period 2, 2.5-years time zone, from December 2003 through June 2006. Largest uplift (positive values) is plotted to the right.
entire observation period in two. Figure 5b shows the distri-bution of the increase in surface movement over the 2.5 years between December 2003 and June 2006. About 6 % of the reflectors still had undergone subsidence (in comparison to 0.3 % in the last 5 years). The classes between 5 and 20 mm of total increase (corresponding to an average annual rate between 2 and 8 mm yr−1) contained about 71 % of the re-flectors for the first 2.5 years, while the classes for the same annual rate (i.e., from 10 to 40 mm total increase) contained only about one third at the end of the second observation pe-riod.
Figure 6.Spatial variation of total surface movement in the area be-tween a latitude of 51.01 and 51.05◦N, and a longitude of 5.33 and 5.40◦E:(a)period 2, 5-year time zone, from mid-September 2005 through mid-September 2010 (all reflectors; color scale is in mm); (b)period 2, 2.5-year time zone, from December 2003 through June 2006 (only reflectors with a downward movement during this time zone).
north-ern part, where the largest residual subsidence was recorded, small uplift values were observed. In the 2.5-year time zone, from December 2003 through June 2006, numerous reflec-tors still had undergone subsidence in that northern part (Fig. 6b). In the eastern part (longitude larger than 5.39◦E) of the southern half, subsidence was still recorded, while this part was characterized by relatively small residual sub-sidence in the first observation period (compare Fig. 3a with Fig. 6b).
Figure 7 presents north–south transects that are similar to those for the first observation period. In the last 5 years of observation (Fig. 7a), the maximum uplift was observed at a latitude of about 51.024◦N. Less than 10 mm of uplift was recorded farther to the south than 50.994◦N and farther to the north than 51.050◦N. These zones were not situated above exploitation panels; however, it is still worthwhile not-ing that there were uplifts in these areas. As for the subsi-dence, a variation of about 20 mm for a specific coordinate was observed again. Overall the curve is relatively symmet-ric. For the first 2.5 years of the second observation period (Fig. 7b), the values along this north–south transect confirm what was mentioned before; i.e., the most downward move-ment was situated in the northern and southern parts, while the peak in uplift became visible somewhere between 51.02 and 51.03◦N.
In comparison to these north–south transects, the east– west transects showed a smaller variation, except, of course, that the movement evolved to zero away from the exploita-tion in the east. In comparison to the east of the area stud-ied, where there was no exploitation, the exploitation of the Zolder mine bordered the exploitation of the Houthalen mine in the west. So, this clearly affected the movement. As an ex-ample, an east–west transect is presented in Fig. 8 for a lat-itude between 51.018 and 51.026◦N, which corresponds to the maximum uplift in the north–south transect. More to the east than a longitude of 5.41◦E, no reflectors were available as there is a nature reserve over a distance of about 3.5 km (without buildings or infrastructure). Although the variation is small between a longitude of 5.33 and 5.39◦E, the north– south transect chosen earlier (5.37–5.38◦E) was at or close to the east–west maximum.
4 Discussion of results
4.1 Location of maximum residual subsidence vs. location of maximum uplift
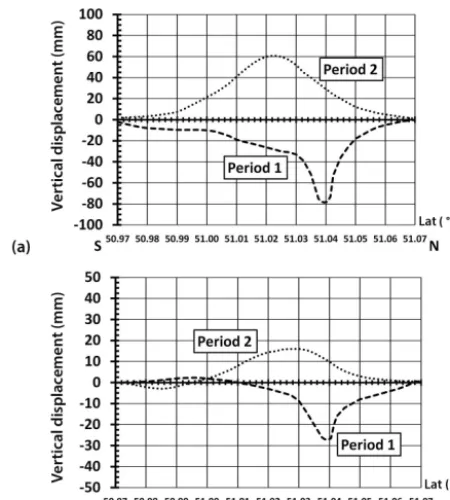
As mentioned above, the movement is more complex than can be represented by a single value. Hence, one should be careful in replacing the individual measured values by an av-erage or by a smoothed curve. However, for comparison pur-poses, such smoothed curves were drawn for the north–south transects, presented above. For the smooth curves of both of
Figure 7.Variation of the total surface movement along a north– south transect, situated for a longitude between 5.37 and 5.38◦E: (a)period 2, 5-year time zone, from mid-September 2005 through mid-September 2010;(b)period 2, 2.5-year time zone, from De-cember 2003 through June 2006.
Figure 8.Variation of the total surface movement along a east–west transect, situated for a latitude between 51.018 and 51.026◦N for the 5-year time zone in Period 2 (from mid-September 2005 through mid-September 2010).
the 5-year time zones that were studied, the following obser-vations were made (Fig. 9a).
Figure 9.Smoothed curves fitted for the total surface movement along a north–south transect, situated for a longitude between 5.37 and 5.38◦E: (a)the two 5-year time zones (see Figs. 4a and 7a respectively);(b)the two 2.5-year time zone (see Figs. 4b and 7b respectively).
– The maximum observed movements were at different locations. In the phase of residual subsidence, the max-imum was situated around a latitude of 51.04◦N, while
for the uplift phase, the maximum was observed around 51.020–51.025◦N. This is in agreement with the maps in Figs. 3a and 6a.
– To the northern and southern end of the chosen transect, the movements evolved towards zero, away from the ex-ploitation.
– The curve of the uplift is very symmetric, which is not the case for the curve of the residual subsidence. In Sect. 4.3, the mechanism behind the uplift is further dis-cussed. All these points are also visible when looking at the smoothed curves for both 2.5-year time zones that were studied (Fig. 9b). The only difference is that, in the southern part (more to the south than a latitude of 51◦N), on average, there already was an uplift in the
first observation period, while subsidence was observed, on average, in the second observation period.
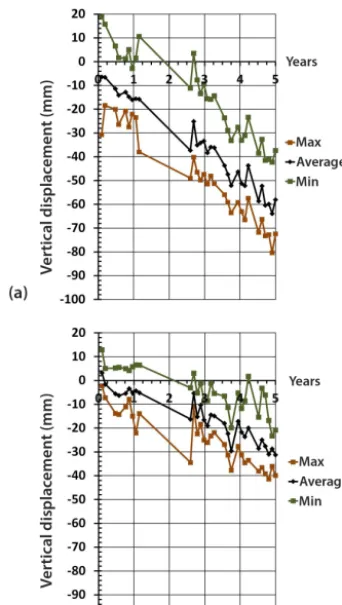
When looking in detail at the movements at the locations of both maxima, the above can be more quantified (Table 3, Figs. 10, 11). Around both maxima, the 10 nearest reflec-tors were selected. The reflecreflec-tors were not necessarily the same for the two observation periods, but they were the same within each of the two observation periods. The number of
Table 3.Information on the two locations, corresponding to the zones with approximately largest residual subsidence in the first pe-riod (MaxRES SUBS) and largest uplift in the second observation period (MaxUPLIFT): information on total movement of 10 reflec-tors around coordinates given in 5-year time zones studied and data on exploitation below these locations.
Location MaxRES SUBS MaxUPLIFT
Coordinates Lat 51.036
◦
N 51.022◦N
Long 5.375◦E 5.377◦E
Vertical movement over 5 years:
Min −37.4 mm −20.9 mm
First period Min −58.1 mm −31.2 mm
Max −72.4 mm −40.0 mm
Min 33.0 mm 50.2 mm
Second period Average 39.3 mm 59.7 mm
Max 46.3 mm 68.0 mm
Exploitation
Number of longwalls 4 6
Oldest year 1968 1939
Most recent year 1982 1959
Min depth 686 m 565 m
Max depth 796 m 712 m
Total mining height 7.0 m 9.3 m
10 reflectors is a compromise between zooming in on a par-ticular area and having enough data to be statistically rep-resentative. Table 3 presents the minimum, maximum and average of the total vertical movement over the 5-year time zone. The variation of these values as a function of time is plotted in Figs. 10 and 11. As could be expected based on Fig. 9a, the difference between the two groups of curves is clear. For the first observation period, there was a small over-lap between the two groups; i.e., the minimum of the residual subsidence of the location of the maximum residual subsi-dence was slightly smaller than the maximum of the other location studied, but the difference between the two averages was 27 mm over the 5-year time zone. For the second obser-vation period, there was no overlap between the two groups. The difference between their averages over the 5 years was 20 mm.
loca-Figure 10. Evolution of subsidence over 5-year time zone in the first observation period (from August 1992 through mid-August 1997): (a) 10 reflectors around coordinates 51.036◦N, 5.375◦E (location MaxRES SUBS); (b)10 reflectors around coor-dinates 51.022◦N, 5.377◦E (location MaxUPLIFT).
tion is within the zone of influence of that panel. However, on the E–W transect (across the panel), we did not observe any maximum in residual subsidence above the most recent panel. When comparing the mining depth, mining height and the number of panels mined underneath the two locations, the mining characteristics were rather similar. Therefore, this means that, apart from possibly the time of mining, there was no clear indication concerning the causes of the difference between the movements of the two locations. In the next two paragraphs, more locations are compared, which will indi-cate whether the effect of the time of mining is significant.
4.2 Influence of mining characteristics on residual subsidence after closure
Mining by the longwall method results in caving above the mined-out areas, creating the goaf area. A roof height of 2 to 8 times the mined height generally is considered to be suffi-cient to fill up the mined height, plus the caved height (Peng, 1986). In the Campine basin, an average value of 5 times normally was assumed, corresponding to a bulking factor of 1.2. The caved zone is composed of blocks of broken
mate-Figure 11.Evolution of uplift over 5-year time zone in the sec-ond observation period (from September 2005 through mid-September 2010):(a)10 reflectors around coordinates 51.036◦N, 5.375◦E (location MaxRES SUBS),(b)10 reflectors around coordi-nates 51.022◦N, 5.377◦E (location MaxUPLIFT).
rial and includes a large number of small and large cavities. Hence, Young’s modulus of this caved material is several orders of magnitude smaller than that of the original intact layers (Galvin, 2016). Over time, this volume is compressed progressively, but it will never reach its original state. Apart from the caving of the immediate roof layers, the rock fur-ther away fractures, and sliding along the induced fractures occurs. Still further away from the mining depth (i.e., closer to the surface), plastic and elastic deflections of layers also occur. All these phenomena result in the occurrence of sub-sidence at the surface. A typical trough shape is created, e.g., above and around a single panel that has been mined. The zone of influence at the surface is larger than the dimensions of the panel itself. By considering an angle of draw of 45◦, as was often done for the Campine coal basin, the width of the zone of influence is about the depth of mining, which varied from 539 to 967 m in the area studied. By looking at the map of the exploitation (Fig. 12), this means that nearly the entire area studied is within the zone of influence of at least one longwall panel. For the coal basin that we stud-ied, typical subsidence rates were 30 to 60 mm month−1in the months following the mining. Unfortunately, for the area studied, no public data were available for the subsidence that occurred prior to the satellite observations. Worldwide, the maximum subsidence ranges from 40 to 90 % of the total mining height (Wagner and Schümann, 1991; Sheorey et al., 2000). In the Campine basin, values of 80 to 90 % normally are used. This means that, for the area studied with a min-ing height varymin-ing from 2 to 12.3 m, subsidence of 1.6 to 11.1 m could have occurred. There is no reason to assume that the general rules of the amount of residual subsidence following years or decades after mining would be any dif-ferent from what can be considered as the globally accepted knowledge, e.g., more subsidence for larger mining heights and less subsidence for deeper longwalls (Galvin, 2016).
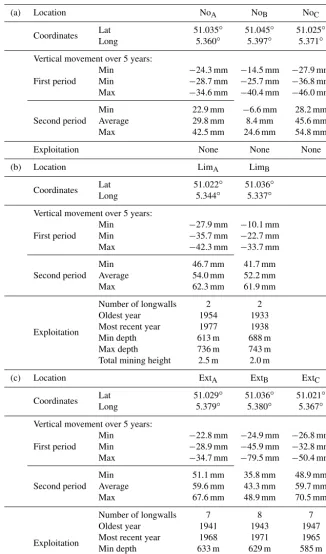
To study the possible link of the residual subsidence with the original mining characteristics in more detail, several groups of locations were selected (Fig. 12). First, three lo-cations were selected where, underneath, no mining had ever taken place (Table 4a). Second, two locations with a small amount of mining, i.e., two panels only and with a total min-ing height of 2 and 2.5 m, respectively (Table 4b). Third, three locations were selected with extensive mining, i.e., seven or eight panels and a total mining height of 9.2 to 10.3 m (Table 4c). As for the two locations with maximum movement (Table 3), the 10 reflectors in the most immedi-ate vicinity were studied. It was not easy to find an adequimmedi-ate number of locations so proper analyses could be done; i.e., enough reflectors had to be present in both observation peri-ods at a close distance, and the same mining conditions had to exist underneath these reflectors.
When one looks at the average total residual subsidence over the 5-year time zone, one gets −29/−26/−37 mm (no mining), −36/−23 mm (limited mining), and −29/−46/−33 mm (extensive mining), respectively.
Hence, one cannot conclude that the amount of mining underneath a relatively small area affects the residual subsidence, certainly if we also point out that location ExtB
(−46 mm) was situated very close to the location of the overall maximum of the residual subsidence in space. When looking at the minima or maxima, also no distinction is observed between the three groups of the amount of mining. This confirms what was observed when comparing both locations of maximum movement (Sect. 4.1).
By looking at the data of Table 4b and c as a function of the mining depth, no clear trend is observed. For the two lo-cations with a limited amount of mining, the most shallow mining resulted in the largest residual subsidence, while, for the three locations with extensive mining, the largest residual subsidence was for the deepest exploitation.
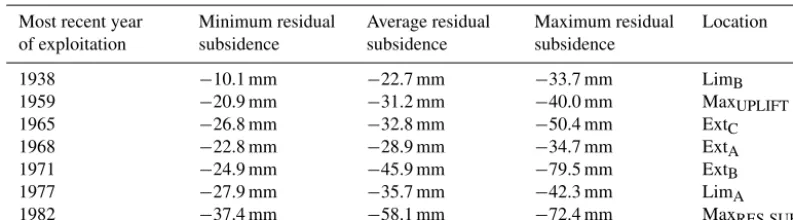
When comparing the two locations of maximum move-ment in Sect. 4.1, there was the possibility that more residual subsidence occurred directly above the more recent longwall panel. This would be logical. Therefore, Table 5 classifies the various locations as a function of the most recent long-wall panel underneath. Taking into account the large number of possible parameters that influenced the results, the trend of these seven locations is indeed that the locations above the most recent panels resulted in larger residual subsidence. However, it must be pointed out that the location with the second-most recent mining has undergone, on average, less movement than one of the locations without mining under-neath (i.e., NoCwith−36.8 mm). So, it certainly cannot be
concluded that there is a simple one-on-one relationship with the time since exploitation. Two different panels were mined in 1990 and 1992, respectively, but, unfortunately, no reflec-tors or insufficient reflecreflec-tors were present above these panels. When comparing the residual subsidence in the north– south transect (Fig. 9a) with the map of longwall panels, one can observe that the zone of influence is larger than expected based on the normally used values of the angle of draw. Based on the latter values and the depth of ex-ploitation, the influence zone during the phase of subsidence should be limited to the zone between a latitude of 50.995 and 51.06◦N, since no exploitation took place any further north than a latitude of 51.05◦N in the transect selected or its immediate surroundings or any further south than a lati-tude of 51.005◦N (Van Tongeren and Dreesen, 2004). This was confirmed in the northern part of this transect. However, as far south as 50.98◦N, residual subsidence clearly was ob-served, i.e., 1.5 km further away than the theory would pre-dict.
4.3 Influence of mining characteristics on uplift after closure
activi-Table 4.Information of selected locations, i.e., movement of 10 reflectors around coordinates given over 5-year time zones in both observation periods and mining characteristics underneath locations:(a)no exploitation,(b)limited exploitation;(c)extensive exploitation.
(a) Location NoA NoB NoC
Coordinates Lat 51.035
◦ 51.045◦ 51.025◦
Long 5.360◦ 5.397◦ 5.371◦
Vertical movement over 5 years:
Min −24.3 mm −14.5 mm −27.9 mm First period Min −28.7 mm −25.7 mm −36.8 mm Max −34.6 mm −40.4 mm −46.0 mm
Min 22.9 mm −6.6 mm 28.2 mm
Second period Average 29.8 mm 8.4 mm 45.6 mm
Max 42.5 mm 24.6 mm 54.8 mm
Exploitation None None None
(b) Location LimA LimB
Coordinates Lat 51.022
◦ 51.036◦
Long 5.344◦ 5.337◦
Vertical movement over 5 years:
Min −27.9 mm −10.1 mm
First period Min −35.7 mm −22.7 mm
Max −42.3 mm −33.7 mm
Min 46.7 mm 41.7 mm
Second period Average 54.0 mm 52.2 mm
Max 62.3 mm 61.9 mm
Exploitation
Number of longwalls 2 2
Oldest year 1954 1933
Most recent year 1977 1938
Min depth 613 m 688 m
Max depth 736 m 743 m
Total mining height 2.5 m 2.0 m
(c) Location ExtA ExtB ExtC
Coordinates Lat 51.029
◦ 51.036◦ 51.021◦
Long 5.379◦ 5.380◦ 5.367◦
Vertical movement over 5 years:
Min −22.8 mm −24.9 mm −26.8 mm First period Min −28.9 mm −45.9 mm −32.8 mm Max −34.7 mm −79.5 mm −50.4 mm
Min 51.1 mm 35.8 mm 48.9 mm
Second period Average 59.6 mm 43.3 mm 59.7 mm
Max 67.6 mm 48.9 mm 70.5 mm
Exploitation
Number of longwalls 7 8 7
Oldest year 1941 1943 1947
Most recent year 1968 1971 1965
Min depth 633 m 629 m 585 m
Max depth 888 m 965 m 735 m
Table 5. Information on residual subsidence of the locations considered in Tables 3 and 4, reordered as a function of the most recent exploitation panel.
Most recent year of exploitation Minimum residual subsidence Average residual subsidence Maximum residual subsidence Location 1938 1959 1965 1968 1971 1977 1982
−10.1 mm
−20.9 mm
−26.8 mm
−22.8 mm
−24.9 mm
−27.9 mm
−37.4 mm
−22.7 mm
−31.2 mm
−32.8 mm
−28.9 mm
−45.9 mm
−35.7 mm
−58.1 mm
−33.7 mm
−40.0 mm
−50.4 mm
−34.7 mm
−79.5 mm
−42.3 mm
−72.4 mm
LimB MaxUPLIFT ExtC ExtA ExtB LimA
MaxRES SUBS
ties ceased and the underground access was closed off, in-cluding dismantling of the pumping installations, the un-derground workings begins to be flooded (Bekendam and Pöttgens, 1995; Caro Cuenca et al., 2013; de Vent and Roest, 2013). In the beginning, the water finds its way through var-ious pathways, including open roadways, permeable faults, and volumes of loose blocks. However, there is no reason the rock mass adjacent to the mined area or between mined areas would not be submerged, and this leads to new pro-cesses. In the literature (Herrero et al., 2012), the swelling of clay minerals of argillaceous rocks under the influence of water is considered to be the main factor for inducing uplift. Swelling is governed by the swelling pressure and is, there-fore, linked to the mining depth. Caro Cuenca et al. (2013) showed the direct correlation between the increase of the wa-ter level in the underground areas and the uplift clearly. In all cases, the groundwater levels even showed a very high cor-relation (∼0.97) with surface displacements. Apart from the uplift, Herrero et al. (2012) pointed out that, due to the flood-ing, the mechanical properties of argillaceous rocks are af-fected significantly by water, resulting in a decrease of 60 to 80 % of their strength, which reactivates the downward set-tlement.
For the same average locations, as for the first observa-tion period, the minimum, average and maximum uplift of the 5-year time zone for 10 reflectors are given in Table 4. By considering the three groups as a function of the amount of mining, one gets average uplifts of 30/8/46 mm (no min-ing), 54/52 mm (limited mining) and 60/43/60 mm (exten-sive mining), respectively. Hereby, it must be pointed out that the average value of 8 mm was recorded at the far NE of the study area, outside the mining area and at a distance of about 3 km from the location with the maximum uplift. Although the two smallest of these eight average values were for the group without mining and the two largest were for the group of extensive mining, one should be very careful in linking the amount of uplift with the amount of mining directly under-neath. Earlier research also indicated that there is not a clear link between the uplift rate and mining (or the absence of mining) directly underneath (Vervoort and Declercq, 2016).
Often, one links the largest uplift to zones with the largest subsidence, and estimates the total uplift to be 3 to 4 % of the total subsidence (Herrero et al., 2012). Bekendam and Pöttgens (1995) also concluded that, generally, the uplift is 2 to 4 % of the subsidence; the latter conclusion is for the same Campine basin, but above the Dutch coal mines to the east. This cannot be confirmed by the area studied here and, of course, for the time periods considered; only the residual subsidence rate is known. As pointed out earlier, no public data were available for the subsidence that occurred prior to satellite monitoring, but by applying the rule of thumb for estimating the total subsidence, one could estimate that the subsidence was from about 1.5 to 11 m in the area studied, and 3 % of this would mean that a total of 45 to 330 mm of uplift finally would occur above the mined-out area. If this were correct, then the uplift during the second observation period (until 2010) would have reached only the bottom part of this predicted range; in other words, one can still expect more uplift above the mining area and immediate surround-ings.
As discussed in Sect. 4.2, the influence zone during the phase of subsidence should be limited to the zone between a latitude of 50.995 and 51.06◦N. In the northern part of the north–south transect that was considered, this was confirmed for the residual subsidence, but, in the south, the influence was about 1.5 km more to the south. For the uplift until 2010 (Fig. 9a), the zone of influence (e.g., an uplift of more than 5 to 10 mm) corresponded well with the limits of 50.99 and 51.06◦N. However, after 2010, the extent of the uplift zone could have increased.
Of course, the fact that mining and caving have taken place has an effect. It is the main reason that water flows into the underground workings. However, the local situation (e.g., the depth, extent or time of mining) does not seem to have a very significant influence on uplift. When looking at the interpo-lated curve of Fig. 9a, no local irregularities are noted; the curve itself also is very symmetric, much more so than the curve of residual subsidence (Fig. 9b).
5 Conclusions
Most research of surface movement above underground mines focuses on the direct effect of mining, i.e., within the lifetime of the mine, and less attention is given to the long-term impact of mining on surface movements. At the end of the last century, several coal basins were closed in Eu-rope, and researchers began to observe a new phenomenon, i.e., the uplift of the surface as a consequence of the flood-ing of the underground workflood-ings (Bekendam and Pöttgens, 1995). In addition, cases were reported of damage to build-ings and infrastructure during the uplift phase (Baglikow, 2011; de Vent and Roest, 2013; Caro Cuenca et al., 2013). During that period, satellite images with frequent and de-tailed measurements of the surface movement over large ar-eas became available, so this topic could be studied further. To date, the focus has been mainly on understanding the phe-nomenon (e.g., Herrero et al., 2012) and identifying general trends, like for example the link with the rise in the wa-ter level (Caro Cuenca et al., 2013; Devleeschouwer et al., 2008). In this study, the residual subsidence after closure, as well as the initiation and further evolution of the uplift were investigated for an area of 22 km2above the Houthalen coal mine, which was closed in 1992. We tried to better quantify the movement after closure and the difference between the residual downward movement and the ultimate uplift of the surface by considering past mining directly below the obser-vation points. All this has led to the following conclusions.
– In the first 5 years following the closure of the coal mine (between mid-August 1992 and mid-August 1997), the area studied was still characterized by an overall down-ward movement; the average residual subsidence was −33 mm over 5 years, corresponding to a rate of about −6 mm yr−1. The maximum rate for the studied area was about−16 mm yr−1(or a total of−80 mm). – Although large residual movements may occur next to
small movements, clustering was present, and it resulted in areas with, on average, smaller residual subsidence and other areas with larger values; certainly when look-ing at the north–south transects, there was a clear zone in which the maximum residual subsidence occurred. – In absolute terms, the rate of uplift was about the same
order of magnitude as the residual subsidence, but, in
fact, it was slightly larger; an average rate of uplift of 9 mm yr−1 was observed for the period between
mid-September 2005 and mid-mid-September 2010, in compar-ison to the average rate of−6 mm yr−1 in the 5 years following the closure.
– The zone in which the maximum uplift occurred was clearly at a different location from the zone with the maximum residual subsidence.
– The curve of the uplift along north–south lines was very symmetric, which was not the case for the curve of the residual subsidence.
– There was no clear sign that the amount of mining un-derneath a relatively small area had an effect on the residual subsidence. However, there was some indica-tion that the locaindica-tions above the most recent panels re-sulted in larger residual subsidence values. There is not a simple one-on-one relationship with the time since ex-ploitation. The zone of influence was larger than one would expect based on the normally used values of the angle of draw and depth of mining.
– Based on all of the information that was collected, there was no indication that the process of uplift was directly linked to the mining characteristics. It is more likely that the uplift as a result of flooding was initiated at or close to the shafts; from that central location, the additional flooding (in the horizontal direction) and rise of mine water (in the vertical direction) were extended, creating additional uplift at that central location and initiating uplift further away from the central area.
the following years at that central location, and uplift was ini-tiated farther away from this central area. This seems to be in accordance with the process of flooding the underground and the systematic rise of the water level. It will be interesting to investigate the further evolution of the uplift, when more recent satellite data become available.
The process of subsidence and the one of uplift are en-tirely different. The first is caused by a caving process and is mainly a mechanical stress-deformation process, including time-dependent aspects, while the process of uplift is caused by the swelling of the clay minerals in the argillaceous rocks in the coal strata, due to flooding. Hence, one cannot assume that the areas where one has the greatest risk for damage to infrastructure due to subsidence are the same areas for the hazards linked to the uplift process.
As for this area, no one-on-one relationships could be clearly identified between the surface movement and the mining characteristics, future research of this multivariate problem could benefit from using techniques including un-supervised learning and un-supervised learning (Noack et al., 2014). It would be best to have data on the initial subsidence, the residual subsidence and the uplift, combined with data on the mining characteristics.
6 Data availability
In this study, the European C-band ERS1/2 en ENVISAT-ASAR satellite images were used, which were made avail-able by ESA for research. To obtain these data, researchers who are interested have to submit a research proposal to ESA.
Competing interests. The author declares that he has no conflict of interest.
Acknowledgements. The input by Pierre-Yves Declercq from the Geological Survey of Belgium, Royal Belgian Institute of Natural Sciences, Brussels, is greatly acknowledged for providing the nec-essary basic data on surface movements and mining characteristics.
Edited by: T. Glade
Reviewed by: two anonymous referees
References
Akcin, H., Kutoglu, H. S., Kemaldere, H., Deguchi, T., and Koksal, E.: Monitoring subsidence effects in the urban area of Zongul-dak Hardcoal Basin of Turkey by InSAR-GIS integration, Nat. Hazards Earth Syst. Sci., 10, 1807–1814, doi:10.5194/nhess-10-1807-2010, 2010.
Baglikow, V.: Schadensrelevante Auswirkungen des Grubenwasser-anstiegs – Erkenntnisse aus dem Erkelenzer Steinkohlenrevier, Markscheidewesen, 118, 10–16, 2011.
Bekendam, R. F. and Pöttgens, J. J.: Ground movements over the coal mines of southern Limburg, The Netherlands, and their re-lation to rising mine waters, in: Land subsidence, Proceedings of the Fifth International Symposium on Land Subsidence, The Hague, IAHS, 234, 3–12, 1995.
Caers, J., Swennen, R., and Vervoort, A.: Petrography and X-ray computerized tomography applied as an integral part of a rock mechanical investigation of discontinuities, Transactions of the Institute of Mining and Metallurgy, Section B, Applied Earth Sci-ences, January–April 1997, 106, B38–B45, 1997.
Caro Cuenca, M., Hooper, A. J., and Hanssen, R. F.: Surface de-formation induced by water influx in the abandoned coal mines in Limburg, The Netherlands observed by satellite radar interfer-ometry, J. Appl. Geophys., 88, 1–11, 2013.
Dang, V. K., Doubre, C., Weber, C., Gourmelen, N., and Masson, F.: Recent land subsidence caused by the rapid urban develop-ment in the Hanoi region (Vietnam) using ALOS InSAR data, Nat. Hazards Earth Syst. Sci., 14, 657–674, doi:10.5194/nhess-14-657-2014, 2014.
de Vent, I. and Roest, H.: Lagging mining damage in the Nether-lands? Recent signs of soil movement in the Zuid-Limburg coal district, in: Proceedings of the XV International ISM Congress 2013, Aachen, Germany, 27–41, 2013.
Devleeschouwer, X., Declercq, P.-Y., Flamion, B., Brixko, J., Tim-mermans, A., and Vanneste, J.: Uplift revealed by radar inter-ferometry around Liège (Belgium): a relation with rising mining groundwater, in: Proceedings of Post-Mining 2008, 6–8 Febru-ary, Nancy, France, GISOS, Groupement d’intérêt scientifique de recherche sur l’Impact et la Sécurité des Ouvrages Souterrains, 13 pp., 2008.
Galvin, J. M.: Ground Engineering – Principles and Practices for Underground Coal Mining, Springer International Publishing AG, 684 pp., 2016.
Herrera, G., Fernández, J. A., Tomás, R., Cooksley, G., and Mu-las, J.: Advanced interpretation of subsidence in Murcia (SE Spain) using A-DInSAR data – modelling and validation, Nat. Hazards Earth Syst. Sci., 9, 647–661, doi:10.5194/nhess-9-647-2009, 2009.
Herrero, C., Muñoz, A., Catalina, J. C., Hadj-Hassen, F., Kuchen-becker, R., Spreckels, V., Juzwa, J., Bennett, S., Purvis, M., Bigby, D., and Moore, D.: Prediction and monitoring of subsi-dence hazards above coal mines (Presisubsi-dence), RFCS Final report 2012, RFCR-CT-2007-00004, EUR 25057 EN, European Com-mission, Brussels, 131 pp., 2012.
Hongdong, F., Kazhong, D., Chengyu, J., Chuanguang, Z., and Jiqun, X.: Land subsidence monitoring by D-InSAR technique, Min. Sci. Technol., 21, 869–872, 2011.
Jung, H. C., Kim, S.-W., Jung, H.-S., Min, K. D., and Won, J.-S.: Satellite observation of coal mining subsidence by persistent scatterer analysis, Eng. Geol., 92, 1–13, 2007.
Langenaeker, V.: The Campine basin. Stratigraphy, structural geol-ogy, coalification and hydrocarbon potential for the Devonian to Jurassic, Aardkundige Mededelingen, 10, 142 pp., 2000. Marinkovic, P., Ketelaar, G., van Leijen, F., and Hanssen, R. F.:
IN-SAR Quality Control: Analysis of five years of corner reflector time series, in: Proceedings of “Fringe 2009 Workshop”, edited by: Osten, W. and Kujawinska, M., Frascati, Italy, 8 pp., 2009. Noack, S., Knobloch, A., Etzold, S. H., Barth, A., and Kallmeier,
in: Proceedings of the International Archives of the Photogram-metry, Remote Sensing and Spatial Information Sciences, Vol-ume XL-2, 2014 ISPRS Technical Commission II Symposium, Toronto, Canada, 79–86, 2014.
Peng, S. S.: Coal mine, Ground Control, 2nd Edn., John Wiley & Sons, 491 pp., 1986.
Preusse, A., Kateloe, H. J., and Sroka, A.: Subsidence and up-lift prediction in German and Polish hard coal mining, Das Markscheidewesen, 120, 23–34, 2013.
Sheorey, P. R., Loui, J. P., Singh, K. B., and Singh, S. K.: Ground subsidence observations and a modified influence func-tion method for complete subsidence predicfunc-tion, Int. J. Rock Mech. Min., 37, 801–818, 2000.
Sousa, J. J., Hooper, A. J., Hanssen, R. F., and Bastos, L. C.: Com-parative study of two different PS-INSAR approaches: DEPSI vs. STAMPS, in: Proceedings of “Fringe 2009 Workshop”, edited by: Osten, W. and Kujawinska, M., Frascati, Italy, 8 pp., 2009.
Vandenberghe, N., De Craen, M., and Beerten, K.: Geological framework of the Campine Basin: Geological setting, tecton-ics, sedimentary sequences. External report SCK·CEN-ER-262 14/MDC/P-43, 2014.
Van Tongeren, P. and Dreesen, R.: Residual space volumes in aban-doned coal mines of the Belgian Campine basin and possibilities for use, Geol. Belg., 7, 157–164, 2004.
Vervoort, A. and Declercq, P.-Y.: Surface movement above old coal longwalls after mine closure, accepted for publication, Interna-tional Journal of Mining Science and Technology, in preparation, 2016.
Wagner, H. and Schümann, E. H. R.: Surface effects of total coal-seam extraction by underground mining methods, J. SAIMM, 91, 221–231, 1991.