CALCIUM AS A SECOND MESSENGER
IN DEVELOPING NERVE CELLS
Friedrich Zimprich
A thesis submitted for the degree of Doctor of Philosophy
in the
University of London
Department of Physiology University College London
ProQuest Number: 10046064
All rights reserved
INFORMATION TO ALL USERS
The quality of this reproduction is dependent upon the quality of the copy submitted.
In the unlikely event that the author did not send a complete manuscript and there are missing pages, these will be noted. Also, if material had to be removed,
a note will indicate the deletion.
uest.
ProQuest 10046064
Published by ProQuest LLC(2016). Copyright of the Dissertation is held by the Author.
All rights reserved.
This work is protected against unauthorized copying under Title 17, United States Code. Microform Edition © ProQuest LLC.
ProQuest LLC
789 East Eisenhower Parkway P.O. Box 1346
ABSTRACT
Calcium is thought to play a crucial role in the regulation of nerve cell
development and growth cone behaviour. In this context I studied three aspects of calcium as a second messenger.
- In growth cones of the N1E-115 cell line I studied the properties and distribution of calcium channels and the pattern of calcium flux through these channels.
- In the same cells the effect of the cytosolic calcium concentration [Ca2+]j on neurits outgrowth was investigated.
-Finally I monitored spontaneous calcium changes in life zebrafish embryos.
1) In imaging experiments, using the calcium indicator dye Fluo-3, I studied the calcium influx into club-shaped growth cones which are characteristically found on advancing neurites. Depolarisation caused the highest calcium influx near the distal, leading tip. This gradient is not altered by blocking calcium induced calcium release from internal stores. Using the voltage clamp technique in the cell attached mode I identified and characterised T type and
L type calcium channels on the growth cones of this cell line. L channel density was significantly higher at the distal tip than at the more proximal growth cone. The calcium gradient in the depolarised growth cone can thus be explained by a gradient of calcium channel density.
2) In N1E-115 cells decreasing [Ca2+]| below the resting value promoted
which show rather a bell shaped dependence. Surprisingly, neurite outgrowth was also promoted when [Ca2+]j was raised much above the resting levels.
3) In an attempt to study calcium dynamics in nerve cells in an intact, in vivo, preparation the calcium indicator dye calcium-green dextran was injected into one of the blastomeres of a 2 to 3 hour old zebra fish embryo which was then
allowed to develop further. Studying 18 to 24 hour old embryos, using a confocal microscope, labelled nerve cells among the daughter cells of the injected blastomere could be clearly identified according to their shape and position.
When such 24 hour old embryos were dissociated and plated on culture dishes labelled nerve cells responded to a depolarisation with a fluorescence increase demonstrating that the dye was retained in the cytoplasm and still
CONTENTS
Abstract... 2
Contents... 4
List of Figures... 8
Abbreviations...10
Acknowledgements... 11
Publications...12
CHAPTER 1 Introduction... 14
1.1 Calcium and nerve cell development... 14
1.2 Regulation of calcium signalling... 18
The level of [Ca^+]j is important... 19
Spatial heterogeneity of calcium regulation...19
The mode of entry matters... 20
Temporal regulation of calcium signalling... 21
Encoding information in calcium oscillations...21
1.3 Voltage dependent calcium channels in develop, nerve cells 22 Ion channels during develop, are different from adult forms 24 1.4 Significance of this study... 25
CHAPTER 2 Methods... 29
Section A: Experiments on N1E-115 neuroblastoma cells... 29
2A.1 Cell Culture... 29
General culture conditions... 29
Manipulating [Ca2+]j in differentiating neuroblastoma cells 29 Measuring neurite outgrowth... 30
2A.2 The epifluorescence microscope and the digital imaging
system...31
The epifluorescence microscope... 31
Other parts of the imaging system...32
2A.3 Measuring calcium with Fura-2 A M ...33
Loading cells with Fura-2 AM ... 33
Properties of Fura-2... 33
Calibration of the Fura-2 signal... 34
2A.4 Whole cell patch clamping and measuring Ca2+ with Fluo-3... 37
Whole cell recording setup and solutions...37
Depolarisation and image acquisition... 38
Inhibiting calcium induced calcium release... 39
2A.5 Single channel patch clamping... 40
The setup...40
Solutions.,...42
Formation of a high resistance sea l...43
Analysis parameters... 43
One channel patches... 44
Patch area...45
Section B: Experiments on zebrafish... 47
28.1 Zebrafish embryos... 47
Collection of embryos... 47
Dechorionation of eggs... 48
28.2 Injecting embryos with calcium-green dextran...49
The Injection setup and solutions... 49
The injection technique... 50
Development after injection... 50
2B.4 Cell dissociation experiments... 52
2B.5 Monitoring calcium in vivo... 53
CHAPTER 3 Imaging calcium influx in neuroblastoma growth c o n e s ...57
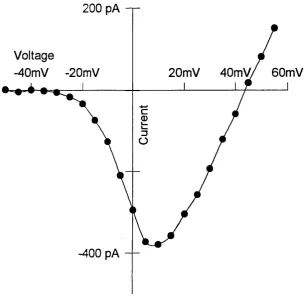
3.1 The HVA calcium current in neuroblastoma cells...60
3.2 Pattern of calcium influx... 65
3.3 Internal calcium stores... 75
CHAPTER 4 Calcium channels on neuroblastoma growth c o n e s ...78
4.1 Single channel properties... 78
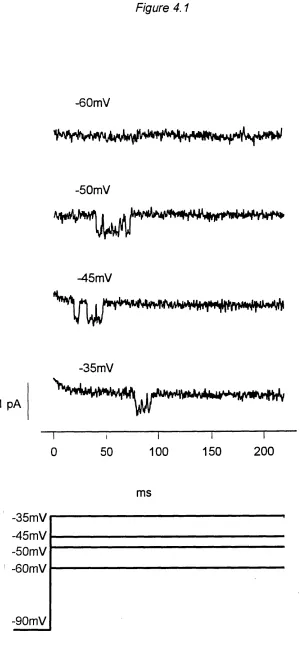
4.1.1. T type calcium channels... 78
4.1.2 L type calcium channels...86
L channel subconductance states of 12 pS...96
4.2 Distribution of L channels on growth cones...101
L channel activity is not randomly distributed but higher at the tip... 101
Is the higher N*Po at the tip due to more channels or a higher Po?... 102
Appendix to chapter 4: The fractal model of channel kinetics...113
Introduction... 113
L channel open times do not show fixed transition rates...115
Discussion of the fractal model... 119
CHAPTER 5 Discussion of calcium channels on growth cones and the ir distrib u tio n ... 120
5.2 Calcium channels are clustered at the tip of growth cones 123
Functional significance of channel distribution...124
CHAPTER 6 The effect of maintained calcium concentrations on neurite outgrowth in neuroblastoma cells 126 6.1 The dependency of neurite outgrowth on [Ca2+]j ... 126
Effects of [Ca2+]o on [Ca^+j; ... 127
Effects of [Ca2+]o on neurite outgrowth...130
Effects of [Ca2+]o on neurite length... 131
ionophores promote neurite outgrowth... 131
6.2 Discussion of results... 141
CHAPTER 7 Calcium dynamics in neurones of life zebrafish embryos... 145
7.1 Introduction... 145
7.2 Calcium-green labelling of spinal neurones... 147
7.3 Calcium-green in cells of 18 hpf embryos still responds to calcium changes... 154
7.4 Spontaneous calcium waves in developing motoneurones 160 7.5 Discussion of results...161
Calcium changes in developing motoneurones...167
LIST OF FIGURES
Figure 2.1 Fura-2 calibration c u rv e ...36
Figure 2.2 Confocality of the confocal microscope... ...56
Figure 3.1 Photomicrographs of growth cones... 59
Figure 3.2 IV relationship for the L-type current...62
Figure 3.3 Nifedipine blocks L type current:... 64
Figure 3.4 Voltage protocol and image acquisition...68
Figure 3.5 Timecourse of the Fluo-3 fluorescence increase...70
Figure 3.6 Hotspots at the tip of growth cones... 72
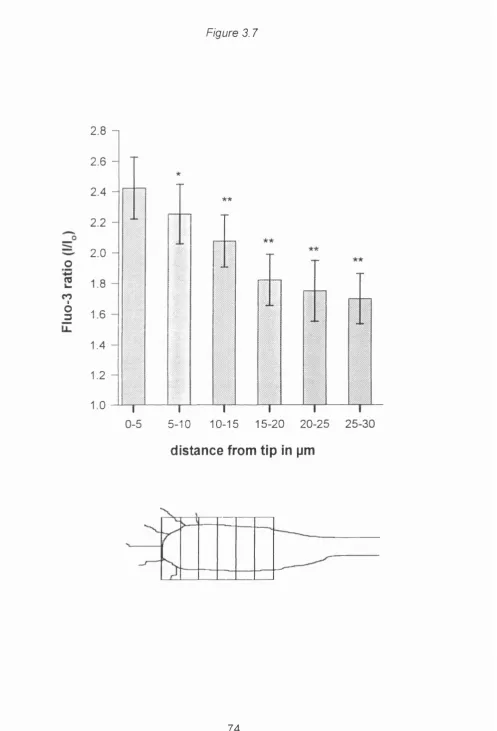
Figure 3.7 A distal to proximal gradient of calcium rise... 74
Figure 3.8 Effects of dantrolene and ryanodine...77
Figure 4.1 T channel openings... 81
Figure 4.2 Steady state inactivation of T channels... 83
Figure 4.3 T channel conductance... 85
Figure 4.4 L channel openings...89
Figure 4.5 L channel conductance... 91
Figure 4.6 L channel open time histogram... 93
Figure 4.7 L channel inactivation...95
Figure 4.8 L channel subconductance states... 98
Figure 4.9 Transitions between subconductance states and full Lchannel openings...100
Figure 4.10 Multichannel growth cone patch... 104
Figure 4.11 Distribution of N*Po values of 60 patches... 106
Figure 4.12 A higher N*Po at the tip... 108
Figure 6.1 Photomicrographs of N1E-115 c e lls ... 129
Figure 6.2 [Ca^+jg versus [Ca^+jj... 134
Figure 6.3 [Ca^+jg and fraction of cells with neurites... 136
Figure 6.4 [Ca^+jg neurite length... 138
Figure 6.5 lonophore promotes neurite outgrowth...140
Figure 7.1 Key stages in early zebrafish development... 149
Figure 7.2 Spinal neurons labelled with calcium green... 153
Figure 7.3 Calcium green responds to calcium changes... 157
Figure 7.4 Fluorescence rise in cultured zebrafish neurons... 159
Figure 7.5 Spontaneous calcium waves in s itu... 163
Figure 7.6 Spontaneous calcium waves in s itu... 165
Table I Properties of VD D C ...22
Table II Developmental changes in ion channel expression... 24
ABBREVIATIONS
AM acetoxymethyl ester
BAPTA 1,2-bis(o-aminophenoxy)-ethane-N,N,N',N’-tetraacetatic acid [Ca2+]i cytosolic free calcium concentration
[Ca2+]o free calcium concentration in the bathing medium CCD charge coupled device
CICR calcium induced calcium release
□HP dihydropyridine
□MEM Dulbecco's modification of Eagle's medium DMSO dimethyl sulphoxide
DRG dorsal root ganglion
EGTA ethylene glycol-bis(P-aminoethyl ether) N.N.N'.N'-tetraaceticacid PCS foetal calf serum
GABA y-aminobuturic acid
HEPES N-[2-hydroxyethyl]piperazine-N'-[2-ethanesulfonic acid] hpf hours post fertilisation
HVA high voltage activated LTP long term potentiation LVA low voltage activated NA numerical aperture NMDA N-methyl-D-aspartate PBS phosphate buffered saline PC Personal computer
Po single channel open probability
RMS root mean square TEA tetraethyl-ammonium
TRIS hydroxymethyl-aminomethane TTX tetrodotoxin
ACKNOWLEDGEMENTS
Above all, I want to sincerely thank Stephen Bolsover, my supervisor, for his guidance, advice, objective criticism and encouraging support during this work. I would also like to thank Hugh Pearson at the Royal Free Hospital for introducing me to the practical aspects of single channel patch clamping and Steve Wilson at King's College for helping me get the zebrafish experiments started. I am grateful to Michael Duchen, Angus Silver and David Attwell for helpful discussion on this work. Thanks too, to
PUBLICATIONS
F. Zimprich, S. R. Bolsover (1995) Calcium channels in neuroblastoma cell growth cones. Eur Journal Of Neuroscience submitted
F. Zimprich, K. Torok and S. R. Bolsover (1995) Nuclear calmodulin responds rapidly to calcium influx at the plasmalemma. Cell Calcium, 17, 233-238
F. Zimprich, M. Gailey and S. R. Bolsover (1994) Biphasic effect of calcium on neurite outgrowth in neuroblastoma and cerebellar granule cells. Developmental Brain Research, 80, 7-12
CHAPTER 1
INTRODUCTION1. 1 Ca l c i u m a n d n e r v e c e l l d e v e l o p m e n t
Calcium is one of the most important second messengers in the regulation of normal cellular function. In recent years i t has emerged that calcium plays a particularly prominent role during neuronal development. Almost
every aspect of nerve cell development studied so far was shown to be influenced by calcium. During the formation of the nervous system cells
undergo maturation from an uncommitted epidermal cell to a fully functioning and differentiated nerve cell. Several key processes can be identified during this development which determine the eventual fate of the neuron. In the following paragraphs I will try to give a summary
of those processes which are thought to be regulated by calcium.
Neural Induction: In amphibians during late gastrulation ectoderm cells overlying the mesoderm are induced to differentiate into neural cells. A recent paper by Moreau et al. (1994) has demonstrated that the signal for this differentiation is an influx of Ca2+ through L -type calcium channels. If the associated rise in intracellular calcium [Ca^+Jj is inhibited ectoderm cells develop into epidermis instead. In vertebrates neurogenesis usually
occurs in germinal centres from where postmitotic nerve cells have to migrate to their final positions (Jacobson, 1991). The migration of
blockers curtails the migration (Komuro & Rakic, 1992; Komuro & Rakic, 1993; Rakic et al., 1994). Usually at an early stage in its differentiation a
neuron decides which transmitter it will express. Calcium influx has been shown to influence this choice of neurotransmitter phenotype in many
preparationssuch as in sympathetic neurones where it stabilises adrenergic
differentiation (Walicke & Patterson, 1981) or in mouse spinal neurones where it promotes a cholinergic differentiation (Ishida & Deguchi, 1983). In Xenopus spinal neurones action potentials elicit much larger calcium
transients during an early critical period than later on in the development (Holliday & Spitzer, 1990). These transients promote the differentiation into y-aminobuturic acid (GABA) positive interneurons and also regulate the maturation of potassium channels (Desarmenien & Spitzer, 1991 ; Spitzer et al., 1993; Gu & Spitzer, 1995).
The most obvious morphological change during the development of a nerve cell is the outgrowth of neurites from an initially unpolarised cell. The structure at the tip of neurites, the growth cone, contains the cellular machinery responsible for finding the correct pathway by integrating attractive or repulsive guidance information from the environment (Goldberg & Burmeister, 1989, Davis et al., 1992; Tessier-Lavigne, 1994). Many studies have now extensively documented that signalling by calcium ions is central in the regulation of growth cone behaviour (Kater & Mills, 1991). To list a few of these experiments: depending on the cell type studied either small increases or decreases in the intracellular calcium level were shown to promote the formation of new neurites and the rate of
linked to small local increases in calcium (Gunderson & Barrett, 1980; Silver et al., 1990; Bedlack et al., 1992; Davenport & Kater, 1992; Williams
et al., 1994; Zheng et al., 1994). Guidance information transmitted to the
growth cone via cell adhesion molecules is clearly associated with calcium influx through voltage operated L or N type calcium channels (Williams et
al., 1992; Doherty & Walsh, 1994). Calcium oscillations in the growth cones of Xenopus spinal neurones and chick embryo DRG's seem to signal the arrest of neurite elongation (Gomez et al., 1995; Gu & Spitzer, 1995),
spontaneous electrical activity induced calcium influx in Purkinje cells causes dendrites to branch (Schilling et al., 1991)^and finally growth cone collapse or retraction is mediated by large increases of cytosolic calcium (Silver et al., 1989; Fields et al., 1990; Bandtlow et al., 1993).
When growth cones meet their postsynaptic target membrane they are transformed to svnapses. A retrograde signal from the postsynaptic cell causes the calcium to rise presynaptically and to remain high, and this calcium change is essential for the morphological development of the
synapse and the induction of transmitter release (Dai & Peng, 1993; Funte & Haydon, 1993; Zoran et al., 1993; Haydon & Zoran, 1994). After synaptic connections have been established neurones are linked together to coactive networks. In the cerebral cortex the formation of such domains is characterised by synchronous calcium transients in all participating cells (Yuste et al., 1992). In the subsequent development of these initial networks to a complex central nervous system^the detailed synaptic wiring needs to be modulated continuously even after the completion of the
embryonic phase. Again calcium is a key second messenger in this
NMDA-glutamate receptors and the subsequent influx of calcium into the postsynaptic cell (Madison et al., 1991; Bliss & Collingridge, 1993).
Neuronal survival and cell death: In recent years it has become generally
accepted that at all times during the development from undifferentiated precursor cells to the establishment of functioning connections, neurones
need to be kept alive by active signalling from the environment. Only those
nerve cells that receive such signals continue to develop whereas the redundant rest - it seems a significant proportion of all cells - are rapidly
removed by a process termed apoptosis or programmed cell death (Jacobson, 1991; Altman, 1992).
Early studies showed that depolarisation enhances the survival of neurones in culture (Scott & Fisher, 1970). This effect was shown to be due to the influx of calcium ions through voltage operated L type channels and the resulting increased levels of [Ca2+]j (Collins et al., 1991; Larmet et al., 1992; Lampe et al., 1995).Other studies have shown the paradoxical result that increased intracellular calcium levels can signal cell death or apoptosis in embryonic neurones (Takei & Endo, 1994; Wolszon et al., 1994).
In conclusion these experiments demonstrate that calcium is a widely used second messenger in the development of the nervous system. What enables calcium to be such a central player? One reason for this may lie in the fact that calcium occupies a strategic position. It can respond to a wide variety of different stimuli. Calcium can not only act as a classical second messenger but also carries a current across the membrane which can produce important use dependent effects. On the other hand calcium also affects an exceptionally broad range of intracellular process either directly or indirectly via the activation of calcium dependent molecules such as
context of nerve cell development important effects of calcium include its
influence on the cytoskeleton which may explain its many effects of calcium on growth cone behaviour. Large increases in intracellular calcium concentration destabilise the actin cytoskeleton (Bentley & O'Connor, 1994; Neely & Gesemann, 1994)^ whereas small local increases may trigger
the induction of new filopodia (Bedlack et al., 1992; Davenport & Kater, 1992). Calcium also plays^key role at various stages of secretion and incorporation of new membrane into the plasmalemma which are important
steps for the release of neurotransmitters and growth of membrane (Neher & Zucker, 1993; Burgoyne, 1995). Finally calcium can trigger a signalling
cascade resulting in the expression of new genes (Sheng et al., 1988; Bading et al., 1993; Gallin & Greenberg, 1995). Such a calcium induced gene expression was demonstrated in neurotransmitter differentiation, apoptosis and calcium promoted cell survival (Spitzer et al., 1993; Takei & Endo, 1994; Galli et al., 1995).
1 . 2 Re g u l a t i o n o f c a l c i u m s i g n a l l i n g
Maybe the most striking aspect of the above investigations taken together is that apparently very similar calcium signals, such a rise in [Ca2+]j, can mediate many disparate biological events or even opposite effects such as neurite elongation versus growth cone collapse or neuronal survival versus cell death. How is the cell able to maintain the independence of different stimulus response pathways if they all share calcium as an element in the signalling cascade? Several explanations can be applied to resolve this
The level of [Ca^+jj is important
The observation that distinct calcium sensitive processes in neurite outgrowth require different narrow ranges of calcium levels led to the proposal of the "calcium optimum" or "set-point hypothesis" (Mattson & Kater, 1987; Kater & Mills, 1991). According to this hypothesis the cell or the growth cone would integrate the various stimuli acting on the cell in
terms of the cytosolic calcium concentration^and the resulting calcium level would or would not be within the permissive range for the particular process. In support of this hypothesis it was shown that in some developing
neurones low levels of calcium are associated with growth cone advance, somewhat higher levels with increased filopodial activity and yet higher concentration with growth cone collapse and retraction (Silver et al., 1989). In dorsal root ganglion cells or cerebellar neurones neurite outgrowth clearly shows a bell shaped dependence on [Ca^+Jj (Al-Mohanna et al., 1992; Zimprich et al., 1994). A similar calcium optimum hypothesis has been suggested for the calcium dependence of early neuronal survival or death (Koike et al., 1989; Larmet et al., 1992), or the events related to synaptogenesis (Dai & Peng, 1993; Zoran et al., 1993) but as outlined below for many other processes this theory is not an adequate explanation (Fields et al., 1993).
Spatial heterogeneity of calcium regulation.
to be the result of L-type calcium channel clustering (Silver et al., 1990).
Similarly electric field induced depolarisations caused calcium to rise only
in small localised areas of the growth cone and marked the site of future outgrowth (Bedlack et al., 1992; Davenport & Kater, 1992). It was
estimated that calcium may reach several hundred micromolar within such a domain, but due to the action of fast mobile calcium buffers such as calbindin these levels would be confined to a very small volume around the site of calcium entry (Roberts, 1994). On a bigger scale differences in [Ca2+]j can also exist between the growth cone and the cell body. In grasshopper pioneer axons the leading growth cone has a higher [Ca^+Jj
than the cell body during neurite elongation (Bentley et al., 1991) and in Xenopus spinal neurones spontaneous calcium transients can occur in
isolation either in the growth cone or the cell body (Gu & Spitzer, 1995).
The mode of entry matters
Several lines of evidence suggest that the route of calcium entry into the cytosol and the kinetic characteristics of the calcium rise are important determinants of the nature of the response. In the migration of neuronal granule cell^ blocking calcium influx through N type channels or NMDA
resistant to collapse mainly because the rise time of the calcium increase is
slowed (Fields et al., 1993).
Temporal regulation of calcium signalling
One simple form of temporal regulation is the alteration either of calcium
responsive elements or of mechanisms that influence calcium levels over time. Changes to calcium levels during development are exemplified by the
maturation of the action potential^which is associated in many neurones with a reduction in the calcium influx (Spitzer, 1991). Early Xenopus spinal nerve cells for instance were shown to express a higher density of low voltage activated calcium channels^ which favours higher spontaneous calcium elevations during this short period (Gu & Spitzer, 1993). The susceptibility of certain processes to calcium can also change during development. This point is nicely illustrated in developing cerebellar granule cells. During the first day in culture calcium influx through N- methyl-D-aspartate (NMDA) receptors promotes mainly neurite outgrowth; during the following days general cell differentiation is stimulated and after 5 days NMDA receptor stimulation is essential for cell survival (Burgoyne et al., 1993). Similarly the survival promoting effect of calcium in chick nodose neurones can only be observed during a restricted period (Larmet et al.,
1992).
Encoding information in calcium oscillations.
It has only been discovered recently that many neurones show spontaneous oscillating calcium transients during development with a great
Table I: Properties of voltage operated calcium channels
Type Electrophysiology ai-subunit
cDNA class Distribution Blockers References
HVA high activation threshold (—20 to-30 mV ) L single channel conduct.= 19-28 pS, slow
inactivation during depol., resistance to steady state inactivation at -40mV. relatively slow deactivating.
N single channel conduct. = 13-18 pS, intermediate fast inactivation, little steady state inactivation at -60 mV
LVA
single channel conduct. = 9 - 1 9 pS no inactivation during depolarisation resist, to steady state inactiv. at neg. volt. intermediate fast inactivation,
no single channel data
A current component in cerebellar granule cells resistant to DHP, conotoxins and agatoxins with rapid inactivation
low voltage activation threshold ( ~ -GOmV ) single channel conduct. = 7-11 pS
fast inactivation during depol.
needs holding voltage > -80 mV to avoid steady state inactivation, slow deactivation
C Smooth mu. Heart, Brain, Pituitary D Brain, Heart,
Pituitary,Pancreas 8 Skeletal muscle B Brain
Brain
? (A) Brain
(E) Brain, elsewhere?
(E) many excitable and nonexcitable cells
Dihydropyridines (class D also reversibly inhibited by o-co notoxin)
irreversibly blocked by ©-conotoxin G VIA (a toxin from a cone snail)
©-agatoxin IVA (toxin from funnel web spider)
©-CO notoxin MVIIC (this toxin also blocks N and P-type). ©-agatoxin IVA (only in lOOx higher conc. than for P channels)
No specific blockers NI2+, amiloride, flunarizine,
Hess et a!., 1984, Nature 311:538 Nowyckyetal., 1985, Nature 316:440 Tanabeetal., 1988, Nature 366:134 Mikamietal., 1989, Nature 340:230 Hui et at, 1991, Neuron 7:35 Seine et at, 1992 PNAS 89:584
Nowyckyetal., 1985, Nature 316:440 Fox et at, 1987, J Physiol 394:149 Fox dL at, 1987, J Physiol 394:173 Plummer et at, 1989, Neuron 21453 Dubel et at, 1992, PNAS 89:5058 Williams et at, 1992, Science 257:389
Mintzetat, 1992, Nature 355:827
Usowiczetat, 1992 Neuron :1185
Zhang et at, 1993, Neurophamnacol 321075 Wheeler et at, 1994, Science 264:107
Randall and Tsien, 1995, J Neurosd 15:2995
Zhang Ë at, 1993, Neurophamnacol 321075 Randall and Tsien 1995, J Neurosd 15:2995
calcium oscillations are probably a sophisticated form of calcium signalling.
It is thought that specific information is encoded in the number, frequency, amplitude or kinetics of the calcium transients which would permit a very complex signalling mechanism. In support of this theory Gu and Spitzer
(1995) present evidence that in Xenopus neurones short calcium spikes promote neurotransmitter expression and channel maturation but longer lasting calcium waves regulate neurite extension.
1 . 3 Vo l t a g e d e p e n d e n t c a l c i u m c h a n n e l s i n d e v e l o p i n g
NERVE CELLS
The best characterised pathway for calcium entry into cells is across voltage dependent calcium channels (VDCC) on the plasmalemma and there is good evidence that from early on during nerve cell development these channels are expressed and critically influence the cytoslic calcium concentrations (Gottmann et al., 1988; McCobb et al., 1989; Silver et al., 1989). Not surprisingly, VDCCs are involved in almost all the developmental processes mentioned in the previous paragraphs. Their importance is maybe most clearly demonstrated in experiments where specific channel blockers
interrupt various aspects of normal neuronal development such as growth cone extension, guidance, retraction, neuronal migration or early cell
survival.-(Robson & Burgoyne, 1989; Komuro & Rakic, 1992; Williams et al., 1992; Moorman & Hume, 1993; Franklin et al., 1995).
1991: Snutch & Reiner, 1992; Dolphin, 1995). LVA channels or T type channels from all studied tissues share very similar single channel characteristics although whole cell kinetic differences within the same cell
type have been described (Kobrinsky et al., 1994). In contrast HVA channels are a very heterogeneous group and big differences can be found
in biophysical properties such as activation and inactivation kinetics, voltage requirements or single channel conductances (Nowycky et al., 1985; Fox et al., 1987; Forti & Pietrobon, 1993). Currently it istWou^Wt that
the most reliable tool to distinguish between HVA channel subtypes and defining criterion is their sensitivity to specific pharmacological agents. In neuronal preparations L, N, P and Q type channels have been described to date. L type channels are sensitive to dihydropyridines (Hess et al., 1984), N type channels are blocked by co- conotoxin GVIA (Williams et al., 1992) and Q and P type channels are blocked at different concentrations by m- agatoxin IVA (Mintzetal., 1992 ; Randall & Tsien, 1995). More channel types however may yet be discovered. The underlying basis for the marked diversity of calcium channels lies largely in their complex molecular composition. Neuronal VDCCs consist of at least four subunits . The large transmembrane a l subunit forms the calcium permeable pore, carries the binding site for dihydropyridines, conotoxins and agatoxins and functions as the voltage sensor (Hofmann et al., 1994). The auxiliary transmembrane o2 and 5 subunit and the intracellular p subunit are substantial for effective expression of the channel complex and profoundly influence the kinetics
and voltage dependencies of activation and inactivation (Isom et a!., 1994;
Wave been
Berrow et al., 1995). So far six different genes isolated that code for
Examples of developmental changes in ion channel expression
Ion channel Tissue Type of change and functional consequence References
AChR (nicotinic bovine acetylcholine skeletal receptor) muscle AChR (nicotinic chick acetylcholine ciliary receptor) ganglion
GABA^
(y- aminobutyric acid) receptor L -type calcium channels
T-type calcium channels
rat brain
rat heart
Xenopus
spinal cord
Replacement of the y subunit in the fetal receptor by the s subunit in the adult. This causes in the adult receptor an increased single channel conductance and a shorter channel open time.
Between embryonic stages E8 and E18 the density of AChRs and the ACh response per unit membrane increases whereas the affinity of receptors for ACh decreases. The 25pS conductance channel disappears and a 40 pS conductance becomes more abundant. The receptor becomes sensitive to a cAMP mediated mechanism that enhances the ACh response. From fetal and early postnatal to adult brain expression of the 0L2, ag, a^, y^ and y^ subunits
decreases whereas and ^2 subunits are more abundant in the adult brain. Over the same period there is a switch from the excitatory effect of GABA to an inhibitory effect.
Two splice variants of the third membrane spanning region of the fourth motif (CaCh2a and CaCh2b) of the a1 subunit of the C class L channel are expressed in a mutually exclusive fashion in the fetal and adult heart. This correlates temporally with a change in the timecourse of the heart action potential and a lower sensitivity of the adult CaCh2a to the DHP antagonist nisoldipine.
The percentage of cells expressing a T-type calcium current is high -9 0 % in young embryonic spinal neurons but drops to 35% during development. This correlates with a more negative threshold for action potentials and higher incidence of spontaneous calcium elevations in young neurons.
Mishima Ë al. Nature 321:406-11 (1986)
Margiotta et al. DevBiol 135:326-9 (1989)
McLennan et al. Neurosd 43:369-77 (1991 ) Cherubini et al TINS 14:515-9 (1991 )
Diebold etal. PNAS 89:1497-501 (1992) Wellington et al CIr-Res 73:974-80 (1993)
HVA and calcium channels
LVA chick and mouse spinal cord
The number of motoneurones expressing LVA calcium channels declines during early development whereas expression of HVA current increases. Appearance of HVA current correlates with death of 50% of motoneurons.
additional functional differences between calcium channels result from the
modulation of channel characteristics by phosphorylation and G-proteins (Hescheler & Schultz, 1993; Dolphin, 1995).
Ion channels during development are different from aduit forms
Considering this big potential for complexity it must be assumed that differences evolved to fulfil specialised functions in the cell. Consistent with the notion that ion channels have different functions in an embryonic and an adult organism is the fact that the exact composition of ion channels changes during development. For instance certain isoforms of subunits of GABAa channels or neuronal nicotinic acetylcholine receptors are predominantly expressed during the embryonic phase (Margiotta & Gurantz, 1989; Wisden & Seeburg, 1992; Fritschy et al., 1994) and a similar temporal differential expression was observed for splice products of a calcium channel gene (CaCh2 ) in developing cardiac cells (Diebold et al., 1992). Although comparatively little is known about the functional significance of differential subunit composition during development^ it was
suggested that such structural differences in GABA^ receptors are correlated with the change of the depolarising effect of GABA in developing neurons to the hyperpolarising action in mature nerve cells (Cherubini et al., 1991; Fritschy et al., 1994). An example which demonstrates that the regulation of the expression of specific calcium channel types can have marked effects on the development comes from Xenopus neurones in culture . As mentioned before, the increased expression of low voltage
activated T-type calcium channels during a critical period is a requirement for spontaneous calcium oscillations and normal maturation of these
What are the aspects of developmental calcium channels that need to be studied to understand their function? The exact subunit composition of
calcium channels is certainly a central question and can be studied with the methods of molecular biology. If markers or antibodies for specific developmental variations or subunits are available their subcellular and
anatomical distribution can be investigated which can give important cues. Studies in adult rat brains for example have shown that different L channel
a1 subunits (gene class C and D) are expressed mainly on the cell body
and major dendrites implicating a function in general cellular signalling pathways, whereas the N channel a1 subunit (gene class B) is located mainly on synapses indicating a role in transmitter release (Westenbroek et al., 1992; Hell et al., 1993). Finally from the electrophysiological point it will be important to investigate the functional properties of developmental calcium channels such as voltage requirements, activation and inactivation kinetics. This information would allow conclusions about the circumstances when channels are activated, how large the calcium influx would be and consequently which developmental processes could be activated.
1 . 4 Si g n i f i c a n c e OF THIS STUDY
In the work presented here I tried to investigate several aspects of the role of calcium as a second messenger in nerve cell development. The following section will briefly outline the approaches I took for this study and summarise the most important new findings.
morphology of developing neurones and extend neurites with large growth cones (Kimhi et al., 1976). The large size of their growth cones makes these cells extremely suitable for the technically complicated imaging and patch clamp experiments performed here. The underlying question for
chapter 3 and partly for chapter 4 was how calcium signals transmitted by voltage dependent L-type calcium channels are spatially organised in
growth cones. Localised modulation of calcium changes has been proposed to underlie the steering or directional outgrowth of growth cones
by neurotransmitter gradients, voltage signals or cell adhesion molecules (Silver et al., 1990; Williams et al., 1992; Doherty et al., 1993; Zheng et al., 1994). N1E-115 neuroblastoma cells are a particularly suitable model for
the study of local calcium signals because depolarisation causes calcium
of
to rise in a number spatially restricted hotspots, triggering a localised advance (Silver et al., 1990). To facilitate analysis I restricted the experiments in this thesis to the simple club shaped growth cones which are characteristically found on advancing neurites (Silver et al., 1989; Soekarno et al., 1993). In chapter 3 I used the calcium indicator dye Fluo3 to image calcium changes in growth cones associated with activation of L- type calcium channels. Depolarisation caused calcium to increase in a
number of hotspots and the average calcium rise was highest at the distal leading tip with a continuous falling gradient towards proximal growth cone regions. Agents that disrupt calcium induced calcium release did not affect these calcium dynamics^ruling out a local release of calcium from internal stores as the source of hotspots or the gradient. In chapter 4 I used the cell attached patch recording technique to show that L type calcium channels are present at a higher density at the distal tip of the growth cone. These results demonstrate that in growth cones depolarisation induced calcium gradients are a direct consequence of the distribution of single L-type
In the rest of chapter 4^ I examined the single channel characteristics of L
and T type channels on N1E-115 neuroblastoma growth cones. This is the first detailed investigation of single channel properties of calcium channels found on mammalian growth cones. Apart from Lipscombe et al. (1988)^ who reported that single channel conductances of L and N-type channels were the same in growth cones and cell bodies of frog sympathetic neurones, there have been no other investigations into the single channel
properties of calcium channels on vertebrate growth cones and only one
other study on any growth cone (Cohan et al., 1985; on the mollusc Helisoma). I report here single channel conductances, mean open times,
inactivation timecourses and open probabilities for T and L-type channels. I also observed subconductance states of L channels,which is the first report of them on neuronal cell membranes in situ,although they were described on a pituitary cell line (Kunze & Ritchie, 1990).
The starting point for experiments in chapter 6 was the calcium optimum hypothesis for neurite outgrowth proposed by Kater's group (Mattson & Kater, 1987). This model, as mentioned earlier, predicts that outgrowth is optimal at a narrow range of intracellular calcium but is impaired by excursions of [Ca^+jj below or above a set point. I tested whether this model applied to N1E-115 cell by clamping [Ca^+ji to a wide range of different concentrations below and above the normal levels and then
Although culture systems allow greater experimental access,conditions are
necessarily simplified as developing nerve cells are not exposed to many influences of their original environment. It is,therefore, difficult to judge which of the many potential roles of calcium reported in culture are also
relevant under normal physiological conditions. However/ only very few studies have made calcium measurements in situ/\n part because of the great experimental difficulties involved. The aim of the work presented in chapter 7 was therefore, to establish a system for in vivo
monitoring of calcium changes in developing nerve cells of life zebrafish embryos. In short: The calcium indicator dye calcium-green dextran was injected into one of the blastomere cells of a few hour old still unformed
CHAPTER 2
METHODS
SECTION A: EXPERIMENTS ON N1E-115 NEUROBLASTOMA CELLS
2A.1 Ce l l Cu l t u r e
General culture conditions
N1E-115 Neuroblastoma cells were maintained in Dulbecco's modification of Eagle's medium (DMEM) buffered with 1.21 g/litre NaHCOs and
supplemented with 10% foetal calf serum in an atmosphere of 5% CO2 at
33°C. Cells were harvested from cell culture bottles by gentle rinsing and replated onto polylysine coated cell culture dishes (Bachofer, Germany). 2% dimethylsulphoxide (DMSG) was added to the growth medium to promote differentiation (Kimhi et al., 1976). Cells were left in this differentiation medium for 3 to 7 days by which time many cells had grown neurites with prominent growth cones.
Manipulating intracellular calcium in differentiating neuroblastoma
cells
For experiments studying the effect of different intracellular calcium concentration ([Ca^+Jj) on neurite outgrowth I manipulated [Ca^+j; indirectly
by varying the calcium concentration in the differentiation medium ([Ca2+]o). [Ca2+]o was increased by addition of CaCl2, or was reduced by
1,2-bis(o-aminophenoxy)-ethane-N,N,N',N'-tetraacetatic acid (BAPTA) (Molecular Probes). The vast majority of BAPTA molecules will each bind one calcium
ion, so that media containing 1 and 1.5 mM BAPTA will contain 0.9 and 0.4 mM free [Ca^+Jo respectively, while media containing 2 mM BAPTA will
have free [Ca^+jo of around 1 pM. The selectivity of BAPTA for calcium over magnesium is such that free magnesium should not change significantly (Tsien, 1980). However, to guard against artefacts due to variation of extracellular divalent cation concentration^ I also added 20 mM magnesium chloride to the differentiation medium in some dishes to give a total
extracellular magnesium concentration of 21 mM. In a different set of experiments [Ca^+Jj was raised by adding up to 1 pM of the calcium
ionophore A23187 (Calbiochem) to the bathing medium. Cells were left for three days to differentiate under these conditions before the extent of neurite outgrowth was measured.
Measuring neurite outgrowth
I tried to assesstwo aspects of neurite outgrowth, initiation of new neurites and length of established neurites. For neurite initiation, I measured the fraction of all cells with at least one neurite longer than the diameter of the cell body. This parameter varied from experiment to experiment, maybe due to differences in the confluency and feeding state of the cultures. I therefore normalised data from any particular experiment such that the value in the control medium (calcium concentration not altered) became 1.
Immunostaining cells for tubulin and actin
follows: all agents in phosphate buffered saline (PBS). Cells were fixed in
4% formalin for 20 min, penmeabilized in 0.5% Triton X-100 for 5 min, labelled with a rat anti-a tubulin antibody (Amersham; diluted 1:50) for 30
min and then exposed to FITC-conjugated Pab2 fragments of rabbit anti rat
IgG (Amersham, dilution 1:100). Cells were then directly stained for actin with rhodamine labelled phalloidin (dilution 1:10; Molecular Probes).
Between steps dishes were thoroughly washed with PBS. Photographs were taken on a fluorescent microscope in Dr Rhona Mirsky's lab.
2 A . 2 Th e e p i f l u o r e s c e n c e m i c r o s c o p e a n d t h e d i g i t a l
IMAGING SYSTEM
The digital imaging system consisted of an inverted microscope with an ultraviolet light source, a highly sensitive camera and a computer system capable of digitising video signals from the camera and manipulating data for analysis.
The epifluorescence microscope
For experiments in chapter 3 to 5 I used a Zeiss IM microscope with either a 40x or lOOx glycerol immersion objective (Neofluor UV-F, Nikon). Both
objectives had a numerical aperture of 1.3. Light in the UV and visible range was generated in a 150W high pressure xenon arc lamp (Wotan,
Germany) and passed through a heat filter. When using the ratiometric dye Fura-2 a 350 or 380 nm narrow band filter was rotated into the UV path using a computer controlled stepper motor. Filtered light was then reflected
through the objective. Light emitted from the specimen was again collected by the same objective and passed through the dichroic mirror and a broad
band filter of centre wavelength 510 nm before directed either to the ocular
or the video camera.
For experiments with the calcium indicator dye Fluo-3 light from the arc lamp was directed through a UV block filter and a 485 nm narrow band filter before being reflected by a 500 long pass dichroic mirror. Emitted light passed through a broad band filter of centre wavelength 535 nm. (All filters
were bought from Omega Optical) The video camera used (extended ISIS- M, Photonic Sciences, UK) was an intensified CCD camera with a higher signal to noise ratio in the blue-green part of the spectrum.
Other parts of the imaging system
For experiments with Fura-2 AM the video signal was digitised and stored in 256 grey scale levels by a Gould FD 5000 image processor. Subsequent image manipulation was carried out by the image processor controlled by
programs written by Angela G. Lamb and run on a DEC Microvax computer. For experiments on growth cones using Fluo-3 I used a Personal Computer based image processing system, consisting of a video adaptor, a Fidelity 100 Frame Grabber Board (Data Translation, MA), in a 486 DX 66 MHz PC with 16 MB random access memory and 230 MB hard disk memory. Images from the camera were digitised as an array of 768 x 576 pixels using a program written by Kevin Boone. After the experiment data were stored on a 1 GB optical disk. Image analysis was performed using a
program called Global Lab Image (Data Translation) and a program written
2 A . 3 M e a s u r i n g c a l c i u m w i t h f u r a - 2 am
For measurements of [Ca^+Jj in neuroblastoma cells in chapter 6 the
ratiometric calcium indicator dye Fura-2 AM was used.:
Loading cells with Fura-2 AM
The acetoxymethyl ester of Fura-2 (Fura-2 AM, Molecular Probes) is the
membrane permeant form of the dye and converted by cell esterases to a highly impermeant form. It therefore remains trapped inside the cytosolic compartment. 2 mM of Fura-2 AM was added to the bathing medium and the dishes incubated at room temperature for 25 minutes in an atmosphere of 5% CO2. Cells were then rinsed with the same medium but without Fura-
2 AM and incubated at 33° for 20 minutes before being placed on the stage of the Zeiss IM fluorescence microscope for measurement of [Ca^+jj as outlined below.
Properties of Fura-2
The calcium indicator dye Fura-2, developed by Grynkiewicz et al. (1985), has a broad excitation spectrum ranging from below 300 nm to above 400 nm and an optimal emission at a wavelength of 510 nm. On binding calcium ions there is a change in the excitation spectrum in such a way that there will be more emission during 350 nm excitation^and at the same time less emission during 380 nm excitation. Although the absolute emission
intensity at each of these wavelengths ( I 3 5 0 and I 3 8 0 ) is dependent on the
concentration of the dye^ this is not true for the ratio of I 3 5 0 / I 3 8 O which is
the ratio of I350/I380 (R) according to the following formula (Grynkiewicz et
al., 1985):
(1 ) [Ca^"*"] = K i/2 "{[R -R m in ] / [R m ax"R ]}
Rmin is the minimum ratio when no calcium is bound; Rmax the maximum ratio when the dye is saturated. K1 /2 is a function of Ky, the dissociation
constant. (Kd equals the calcium concentration where 50% of the dye is saturated):
(2 ) K 1/2 = Kd*[l380free/ l380bound]
•380free IS the intensity at 380 nm excitation at zero calcium and l380bound
the intensity at 380 nm when the dye is saturated with calcium.
Calibration of the Fura-2 signal
The values for Rmax, Rmin and K1 /2 depend on the optics of the microscope
and other factors and need to be known for the calculation of [Ca^+j from
R, the ration of I350 / I 38O. For the calibration of these parameters on my
Zeiss imaging setup (lOOx Nikon objective, room temperature) I employed the following approach.
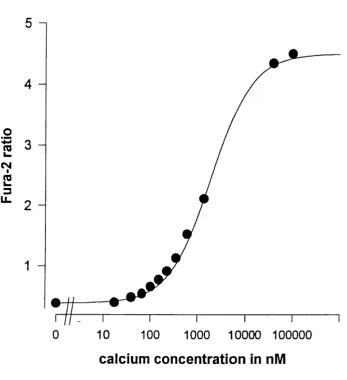
Fura-2 solutions (10 mM) in a range of buffers with known calcium concentrations (Molecular Probes) were drawn up into microslides, cuvettes with 50 pm path length (Camlab, UK) and placed on the stage of the microscope. Fluorescence intensities at 350 nM and 380 nm were measured and background subtracted. Ratios of I350 /I38O were calculated and plotted against the calcium concentration (Figure 2.1). K1 /2 R m ax and Rmin could be evaluated from the best curve fit through these points. As
the Kd of Fura-2 at 20°C is 236 nM as compared to 285 nM at 37°C K1 /2
Figure 2.1
Fura-2 calibration curve for the Zeiss imaging setup (room temperature, 20 X objective). The ratios of background subtracted fluorescence
intensities at 350 and 380 nM of a 10 mM Fura-2 solution in microslides
were plotted against the calcium concentration (Filled circles). The straight line is the best curve fit through these points using formula (1):
[C a 2 + ] = K i/2 '{[R -R m ln ] / [R m ax-R ]}- The values obtained for these
Figure 2.1
o
E
S
3 LL
4
3
2
10
0 100 1000 10000 100000
Fura-2 AM loaded cells^the ratio of emission intensities at excitation at 350 nm and 380 nm was then measured and [Ca2+]j calculated according to formula (1).
2 A . 4 Wh o l e c e l l p a t c h c l a m p i n g a n d m e a s u r i n g c a l c i u m w i t h
f l u o- 3
For imaging experiments of calcium influx into growth cones in chapter 3j I
used the patch clamp technique in the whole cell mode. This technique offered the advantages that the calcium indicator dye, Fluo-3, could be introduced into the cells in sufficient quantities to visualise the growth cones and at the same time allowed control over the membrane voltage.
Whole cell recording setup and solutions
For these experiments neuroblastoma cells were rinsed 4 to 7 days after plating with the following "whole cell bath medium":
120 mM NaCI
10 mM CsCI
5.5 mM KCI 1.0 mM MgCl2 1.8 mM CaCl2
20 mM TEA (tetraethylammonium chloride) 20 mM TRIS (hydroxymethyl-aminomethane) 25 mM glucose
Patch pipettes were pulled on a L/M-3P-A pipette puller (List Medical, Germany) from thick wailed borosilicate capillaries with inserted microfilaments (GC150F-10, 1.5 mm outer diameter, 0.86 mm inner diameter Clarke Electromedical) to give resistances of 5-8 MH. The following solutions were used to backfill the pipettes. In imaging experiments the "whole cell pipette solution A" contained:
135 mM CsCI 25 mM TEA
7.5 mM HEPES (^H2-hydroxyethyl]pipe^azine-N'-[2-ethanesulfbnicacid]) 1.0 mM MgCl2
5.0 mM MgATP
10 mM Fluo-3 pH adjusted to 7.0
In experiments where I determined the characteristics of the whole cell calcium current^ the 10 mM Fluo-3 was replaced with 10 mM EGTA and 1 mM CaCl2 was added ("whole cell pipette solution B"). In some the
experiments 5 pM of the dihydropyridine antagonist nifedipine (Calbiochem) was added to the bath .
A pipette, backfilled with either of the above solutions, was then connected to the headstage of an Axopatch 200 patch clamp amplifier (Axon Instruments) and positioned near the cell using a water filled hydraulic micromanipulator (Narashige, Japan). After offsetting the pipette current the pipette was sealed onto the cell body and on formation of a gigaseal the membrane patch at the tip ruptured by light suction. The cell was voltage clamped at -50 mV.
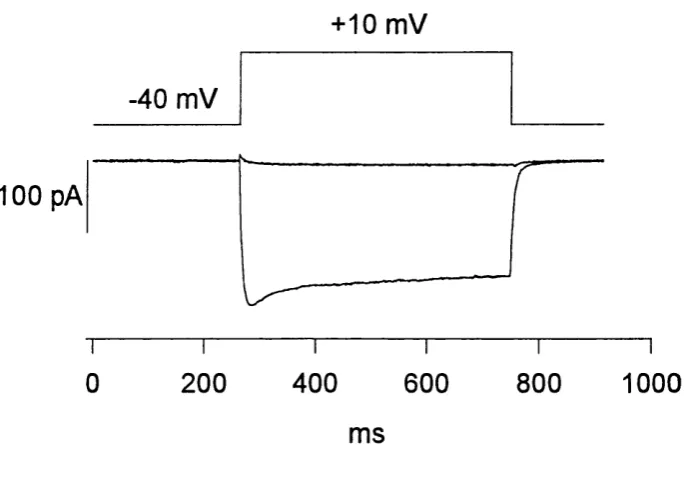
Depolarisation and image acquisition
growth cone was moved into the centre of the camera view^ and the camera
gain adjusted so that it was high enough for the growth cone to be clearly visible above the background noise, but low enough so that on Fluo-3 fluorescence increase the camera would not saturate. The holding voltage was then changed to -40 mV and after one minute the cell was depolarised
to +10 mV for one second. The depolarisation protocol was controlled by Clampex, a program in the pCIamp software (Axon Instruments), on a Personal Computer connected to the patch clamp amplifier via a digital-
analog converter (TL-1/Labmaster, Axon Instruments). The voltage protocol in imaging experiments was designed to specifically open L type calcium channels^ as T type calcium channels are inactivated at a holding potential of -40 mV (Silver et al., 1990). Cell currents were filtered at 1000 Hz digitised and saved on the computer for later analysis. Slightly before
the cell was actually depolarised a signal was sent to the imaging computer to start image acquisition at a rate of 120 ms (in earlier experiments 240 ms) per image so that 4 images (earlier exp. 3) were acquired as controls before the cell was depolarised and 8 images during the depolarisation (Figure 3.4). Images were background subtracted and divided through the average of the control images. The resulting ratio was thus a measure of the fractional or relative fluorescence increase compared to before the
depolarisation. For analysis of the spatial pattern, the fluorescence increase in every growth cone was averaged in sections of 5 pM from the tip, so that the fluorescence increase within 5 pM of the tip could be
compared with more proximal regions (Inset in figure 3.7).
Inhibiting Calcium induced calcium release
performed. The first run was intended as an internal control to get a value
for the fluorescence rise in each growth cone. Immediately afterwards cells
were exposed either to a bathing solution that contained inhibitors of internal calcium stores - 200 pM ryanodine (Calbiochem) or 40 pM
dantrolene (Sigma) - or for control purposes left in the same solution. To change solutions without disrupting the delicate seal^ I used a diamond shaped perfusion chamber (RC-26, Warner Instruments, CT). (Before the experiment this chamber had been sealed onto the dish with silicon
grease). 210 sec after the first run the cell was again depolarised. Fluorescence changes during the second depolarisation were normalised
to the 480 ms value of the first depolarisation. The normalised fluorescence increases in the control, ryanodine and dantrolene groups were then compared with each other.
2 A . 5 Si n g l e c h a n n e l p a t c h c l a m p i n g
To recording single channel currents, I used the voltage clamp technique in
the cell attached mode (Hamill et al., 1981).
The setup
The centrepiece of the cell attached patch clamp setup was the Axopatch 200 patch clamp amplifier with a CV 201 headstage (Axon Instruments). The headstage with an HL-1 pipette holder (Axon instruments) was
holder with Ag/AgCI coating at the tip made contact with the pipette
solution and a Ag/AgCI pellet served as an indifferent electrode in the bath. A TL-1 Labmasterboard was interfaced between the patch clamp amplifier and a 286 Personal Computer.This allowed digital to analog conversion of
complicated voltage protocols to control the amplifier with the computer and it permitted instantaneous analog to digital conversion, so that the recordings could be digitally stored and further analysed on the computer.
The software used for these purposes was the pCIamp series (Axon Instruments). To achieve low noise recordings suitable for detecting single channel events smaller than 1 pA several factors were important. The amplifier itself was able to operate at very low noise levels of below 0.1 pA RMS (root mean square or standard deviation of the baseline noise current) at a bandwidth of 5 kHz. It achieved this low noise performance by using a capacitive feedback technique. The entire preparation
(microscope, headstage, manipulator etc.) was shielded in a Faraday cage and all objects within the cage grounded via a central copper bar. To reduce noise from stray capacitance - from the pipette to the ground - I used thick walled pipettes pulled from borosilicate glass capillaries with an inner filament (GC150F-10, 1.5 mm outer diameter, 0.86 mm inner diameter, Clarke Electromedical) to resistances of 8 -1 3 MQ on a L/M-3P- A pipette puller (List Medical, Germany). Pipettes were kept as short as possible (~3 cm) which also improved mechanical stability. As most of the stray capacitance arises across the pipette wall where the pipette is in
Solutions
Pipettes were backfilled with the following "single channel pipette solution"
110 mM BaCI, 1 pM TTX:
10 mM HEPES; pH 7.3
Neuroblastoma cells 3 to 7 days after plating were rinsed and bathed in a
"single channel bath solution" (Kobrinsky et al., 1994):
70 mM NaCI 70 mM KCI 1 mM MgCl2
10 mM EGTA
10 mM HEPES; pH 7.3
Where indicated 5 pM of the dihydropyridine (DHP) agonist BAYK 8644 (± racemate, Calbiochem) was added to the bath to increase the open probability of L-type channels. In some experiments 5 pM of the DHP antagonist nifedipine (Calbiochem) was used to suppress L channel current.
In the cell attached configuration the resting voltage of the cell is not known. To overcome this problem the high concentration of potassium ions in the bath was intended to depolarise the cell to a constant voltage near 0 mV which could then serve as a reference point. I measured the resting voltage in this depolarising bath solution in 11 cells. Pipettes were filled with the whole cell pipette solution B in these experiments. Cells were current damped after establishing a whole cell recording configuration and
the membrane voltage measured within a few seconds that is, before the
as bath relative to pipette, thus the true membrane voltage is about 5 mV
more negative
Formation of a high resistance seal
A pipette was positioned near the cell and the pipette current offset to zero.
While moving the pipette to the desired location on the cell or growth cone I applied slight positive pressure to clear the tip from impurities that might
affect the quality of the seal. On touching the cell surface I sucked slightly to pull the membrane patch onto the pipette tip. Usually this resulted within a few seconds in a very high resistance seal in excess of 20 GQ. The membrane patch was then clamped at a voltage of -40 mV for several seconds before recording began. Currents were filtered at 1000 Hz and digitised at a sampling rate of 6.6 kHz. To ensure that the patch had remained cell attached during the whole recording I ruptured the patch after finishing the experiment. When the patch had been truly cell attached I was able to record a large capacity transient, typical of the whole cell
configuration. This test excluded the rare cases of inside-out patches that had been pulled away from the cell due to a slight drift of the manipulator.
Analysis parameters
For the detection of single channel openings I used the 50 percent threshold crossing method (Colquhoun, 1987). A threshold was set halfway between the full opening and the shut level and a transition was
very short) false threshold crossing event per 100 seconds of recording (Colquhoun, 1987). On the other hand filtering currents has the effect that very short true channel openings will not reach the threshold. In these
experiments a 4-pole low pass Bessel filter was used with 1000 Hz as the
-3 dB frequency. The 90% rise time of this filter was 0.35/1000 Hz or approximately 350 psec. As the duration of an event needs to be roughly
1.3 of the rise time to be measured reliably, the resolution was therefore limited to around 500 ps. To measure amplitudes of openings correctly, the opening duration must be at least twice the rise time. I therefore excluded
all events that were shorter than 1 ms for evaluating current amplitudes. For the construction of open time histograms an eventlist was created from the original current record. Channel open times were then binned into bins of 0.5 ms binwidth (Figure 4.6). Fitting of exponentials to obtain the "open- time time-constants" was performed after omitting the first bin from 0 to 0.5 ms. For arithmetic mean open times the arithmetic average of all openings (including those shorter of 0.5 ms) was calculated. For single channel conductance measurements the amplitude of channel openings to several test potentials was measured and then plotted against the voltage.
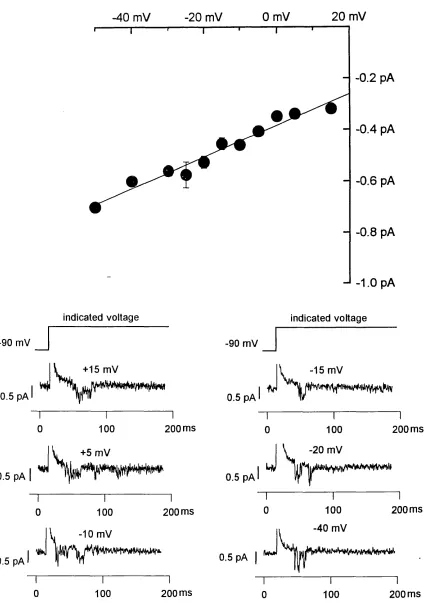
A straight line was fitted through these points. The slope of this line equalled the single channel conductance. From the same graph the reversal potential could be determined as the point where the fitted line crossed the voltage axis.
One channel patches
Most single channel parameters could be determined from patches that
contained more than one channel. However, estimation of the open probabilitv of a single channel requires the identification of patches
recording time in these patches was 44 seconds (minimum 7, maximum
188 seconds) at +10 mV. In these patches only one channel ever opened at one time. I refer to these as "possible one channel patches". For each patch I calculated the probability that the records would have been obtained if two channels were in the patch according to the following
consideration. The assumption is that there are two independently opening
of
channels in the patch. What is the probability obtaining a record in which
each of the two channels opens only when the other one is closed? If A is
the channel that has opened most recently or is still open B is the other one. There are N openings in the record. How many of these openings would one expect to be of the B channel? Slightly more than 50%, because
B is available for opening all the time but A only (1 -P o ) of the time. In fact
one would expect N /(2 -P o ) closed to open transitions of the B channel. The
probability that the B channel opens during a time interval when no channel is open is (1 -P o ), which is the fraction of the time when the A
channel is shut. The probability that all N /(2 -P o ) openings of the B channel
occurred in this time interval is therefore: Patches for which the probability was low were unlikely to contain more than one channel. In two of the nine possible one channels patches this probability was less than 0.05, equivalent to a 5% confidence that there was only one channel. These two patches are referred to as "probable one channel
patches".
Patch area
used method to determine accurately the inner diameter of pipette tips is to
measure the "bubbling pressure (Pb)", the pressure necessary to expel bubbles of air through the pipette tip into a methanol solution (Martin & Cook, 1990). When pressure applied to the pipette is large enough to
overcome the surface tension of the air-methanol surface, bubbles will leave the tip. The most important variable influence on the bubble pressure is the tip diameter (d).
(3) Pb = 4a / d
a is the surface tension (for methanol at 20°C it is 22.61 dynes/cm). To measure Pb, I connected a 50 cc syringe to the pipette, pushed the plunger
and observed the syringe volume (Bubble number or B) when bubbles emerged into the methanol solution. From this volume Pb could be calculated;
(4) Pb = [(50/B)-1]* Pa (atmosphericpressure =1013250dynes/cm^)
By reforming equation (3) d could be determined. For thick walled pipettes of 8-13 MQ, tip opening diameters were calculated to be in the range of 0.76 to 0.92 pm. As very good seals formed usually without much suction and tip cones are almost parallel in thick walled pipettes patch areas were