IJEDR1702192
International Journal of Engineering Development and Research (www.ijedr.org)1157
Agronomy Study on Small Scale Irrigation Project
Ebissa G. K
Department of Civil Engineering Indian Institute of Technology,Roorkee
________________________________________________________________________________________________________ Abstract: Irrigation development plays an essential role in stabilizing crop production by either supplementing or replacing the need for natural precipitation. Irrigation makes agriculture more confidential. It stabilizes crop production by protecting against drought and by increasing crop yields, increases their income and crops that improve their diet. The field study consists of agricultural surveys, focus group discussion, individual meeting and interviews with farmers, experts from zonal, and woreda office of agriculture. The scope of this volume includes the general presentation of existing crop production situation and strategic attempt to promote agricultural production that would be acceptable by farmers. The methodology used in this development study was aimed at plainly defining and describing the agronomic situation of the area and out lining the major crop production constraints and developing recommendation for implementation. Primary and secondary data were collected from the Kebele development agents, farmers and Wareda agricultural and development office using checklists through group discussion and key informant interview on crop production, cropping pattern, farming practice and production constraints. Four soil profiles were dug to a possible soil depth at representative sites in the command area and samples were collected at two different depths to catch different root depths of various crops. Physical and chemical properties of the soil (PH, texture, EC, OC and OM) were analyzed. Crop water requirements of crops are computed using crop wat 4 windows model.
In general, as a conclusion the agro-climatic condition of the project site, the suitability of the soil for crop production, physical feature of the command area and the availability of irrigation water are suitable for development of irrigation. Despite the above facts, the sustainability of the project is very much dependent on the full participation of the beneficiaries in all aspects of the project implementation. The participatory approach will create a sense of responsibility and ownership and greatly contributes to the success of the irrigation schemes constructed in previous years.
The objectives of the project will only achievable when:
The beneficiaries are encouraged to organize themselves for operation, input provision and marketing of products, Provision of credit for inputs and other needs is on time, The extension service is effectively established and Periodical training is provided to both extension field staff and beneficiary farmers.
The cropping pattern proposed for the scheme is based on the current knowledge of the beneficiaries and as such does not pose any problem of adoption. However, the production of vegetables and other cash crops is, for most part, dictated by the prevailing market demands. Planning of vegetable crop production, therefore, requires adequate market information to be parted to the farmers. Moreover, continuous adaptive research in vegetables and other cash crops need to be supported by regional research institutions.
Keywords: Agronomy, Irrigation Crop Production, Cropping pattern, Crop water requirement, crop wat 4 windows model.
________________________________________________________________________________________________________
I.INTRODUCTION
Eighty-five percent of the population of Ethiopia depends directly on agriculture for their livelihoods, while many others depend on agriculture-related cottage industries such as textiles, leather, and food oil processing. Agriculture contributes up to 50 percent of gross domestic product (GDP) and up to 90 percent of foreign exchange earnings through exports (Davis et al., 2009). It is widely believed that Ethiopia has ample resources for agriculture. The country has 111.5 million hectares of land. While74 million hectares are arable, only 13 million hectares are currently being used for agricultural activities (Abate, 2007).Water resources are also plentiful in many parts of the country. Referring to the 2007 Housing and Population Census of Ethiopia Abate (2007) pointed out that there were about 12 million farm households providing human resources for agriculture and related activities. Ethiopia’s livestock resources are among the top in the world, at least in terms of quantity. The country also has a high level of biodiversity, with several different economically important crops indigenous to the country.
IJEDR1702192
International Journal of Engineering Development and Research (www.ijedr.org)1158
The field study consists of agricultural surveys, focus group discussion, individual meeting and interviews with farmers, experts from zonal, and woreda office of agriculture. The scope of this volume includes the general presentation of existing crop production situation and strategic attempt to promote agricultural production that would be acceptable by farmers.The aim of this paper is to estimate (1)To evaluate the existing agricultural situation of the area including crops grown, the cropping pattern and farming practice, (2) To propose the necessary interventions and ensure the possible increase in productivity, (3) To investigate the suitability of soil, climate and water to irrigated agriculture, (4) To estimate crop water requirements and (5) To estimate input requirements of irrigated crops
II.STUDYAREA
2.1 Description of the Project Area 2.1.1 Location
Gondoro river diversion irrigation project is found in Southern Ethiopia nation, nationality and people’s regional state, Kefa administrative zone of Adiyo woreda at Yecha kebele. It is found on 64 km away from the zone town, Bonga. The project area is situated at 4.5km far from woreda town, Kaka, from which 2.5km is all weather road and the rest 2km is only dry weather road.
2.1.2 Climate
According to agro ecological classification the kebele consists of major, kola (55%) woina- dega (29.5%),and dega (15.5%).(Woreda and kebele agricultural office).
2.1.2.1 Rain Fall
The rainfall pattern of the project area is bimodal type in which one main rainy season is occurred during the summer season mostly starting in June and ends in September. Even though, there is no regular time of staring for the belg rain usually it starts after two to three months of break. The major rain is received in the months of July and August (Table 1).
Table 1: The mean monthly rainfall of the area (mm)
Month Jan Feb Mar Apr May Jun Jul Aug Sep Oct Nov Dec Total
Mean monthly rain fall 39.3 31.9 117.0 180.1 189.7 199.1 200.4 208.5 196.9 150.1 73.2 62.1
2.1.1.2 Temperature
The mean maximum average annual temperature of the area is 27.20c and the mean minimum average annual temperature of 120c, in which the highest mean maximum temperature of 29.3 0C and a mean minimum temperature of 10.50C were recorded in March and December months respectively
Table 2: Mean max. and min temperature (oc)
Month Jan Feb Mar Apr May Jun Jul Aug Sep Oct Nov Dec Average
Mean Max. Temp. 28.4 29.1 29.3 27.8 27.5 26.0 25.9 25.8 26.0 27.1 26.4 27.6 27.2 Mean Min. Temp. 10.6 10.9 12.0 13.0 12.8 12.8 12.4 12.7 12.8 12.2 10.7 10.5 12.0
2.1.3 Topography
The command area begins immediately from the head work. The left side of the command starting from the headwork is bounded by a hilly mountain covered with natural vegetation.
The command area has undulating topography. The agro forestry system, crops under scattered trees, is practiced in the area. Generally the slope of the area is from 2-15%. Therefore, the furrow alignment, planting geometry and irrigation application method has to be considered.
2.1.4 Land Use of the Kebeles
Land use of the kebele is mainly forest land, coffee plantation and cultivated land of rain fed based production system. The forest cover accounts up to 19.4% of the total area of the kebele.
Table 3: Land use pattern of the kebele
Land use Area(has) %
1. Cultivated land 972 29.01 2. Grazing land 178.5 5.32 3. Forest cover 650 19.40
4.Others 1549.5 46.25
Total 3350 100
Source: kebele development office
2.1.5 Methodology of the study
IJEDR1702192
International Journal of Engineering Development and Research (www.ijedr.org)1159
Primary and secondary data were collected from the Kebele development agents, farmers and Wareda agricultural and development office using checklists through group discussion and key informant interview on crop production, cropping pattern, farming practice and production constraints. Four soil profiles were dug to a possible soil depth at representative sites in the command area and samples were collected at two different depths to catch different root depths of various crops. Physical and chemical properties of the soil (PH, texture, EC, OC and OM) were analyzed. Crop water requirements of crops are computed using crop wat 4 windows model.III.RESULTSANDDISCUSSION 3.1 Crop Production in the Project Area 3.1.1Rain Fed Crop Production
Existing Cropping Pattern
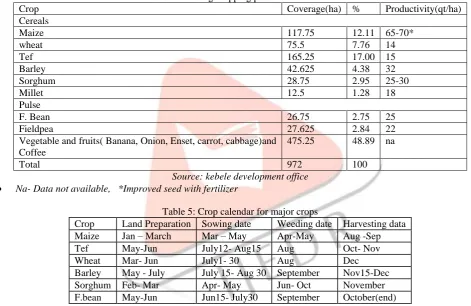
In the kebele agriculture is mainly dependant on rainfall and it is dominated by the production of sol crop maize, tef, wheat, barley, F.bean, sorghum and coffee. Banana and Enset are grown in most of the households around there homestead and it is a main source of food and cash income for the households. The system of production is traditional one in which plowing, harvesting and threshing is done by human and animal power only. Crops grown in the command area are Maize, tef, sorghum, wheat, barley and F. bean. Previous years Cropping pattern of the kebele for their total cultivated land is shown below.
Table 4: Existing cropping pattern of the kebele
Crop Coverage(ha) % Productivity(qt/ha)
Cereals
Maize 117.75 12.11 65-70*
wheat 75.5 7.76 14
Tef 165.25 17.00 15
Barley 42.625 4.38 32
Sorghum 28.75 2.95 25-30
Millet 12.5 1.28 18
Pulse
F. Bean 26.75 2.75 25
Fieldpea 27.625 2.84 22
Vegetable and fruits( Banana, Onion, Enset, carrot, cabbage)and Coffee
475.25 48.89 na
Total 972 100
Source: kebele development office
Na- Data not available, *Improved seed with fertilizer
Table 5: Crop calendar for major crops
Crop Land Preparation Sowing date Weeding date Harvesting data
Maize Jan – March Mar – May Apr-May Aug -Sep
Tef May-Jun July12- Aug15 Aug Oct- Nov
Wheat Mar- Jun July1- 30 Aug Dec
Barley May - July July 15- Aug 30 September Nov15-Dec
Sorghum Feb- Mar Apr- May Jun- Oct November
F.bean May-Jun Jun15- July30 September October(end) Source: kebele development office & field survey
3.1.2 Production Factors Land
The maximum land holding of a household extends up to 10 hectare. The lowest land holding is 0.5 hectare and average landholding of the kebele is 3.5 hectare. The average land holding size of the households is decreasing through years as compared to the previous years. This land holding may decrease more due to the annual increment of rural population. In such situation to satisfy additional food requirement, higher yields would only achieved by through the application of irrigation water and use of appropriate farm management including the introduction of improved farm inputs and implements as well as better cultivation technique.
Animal Power
IJEDR1702192
International Journal of Engineering Development and Research (www.ijedr.org)1160
Table 6: Number of oxen per household at the kebeleNo. No. of oxen No.of Households %
1 No. of HH who posses nil ox 55 15.4
2 No. of HH who posses one ox only 86 24.08
3 No. of HH who posses two oxen 135 37.81
4 No. of HH who posses three oxen 74 20.72
5 No. of HH who posses four and above 7 1.96
Total 357 100
Source: kebele development office
Input
Major inputs used in the area are fertilizers and improved seeds. Fertilizer is applied for crops mainly for maize, wheat and tef. Improved seed is used for maize and wheat only. Application of inputs (fertilizer and improved seed) is increasing from time to time. The basis for this is farmer’s attitude on fertilizer and improved seed is changed, farmers realize the yield obtained from improved technologies is by far better than from the conventional one.
In the 2009/10 cropping season a total of 300.5qt DAP and Urea and 49.25qt of improved seed was utilized by the kebele. Whereas in the 2010/11 cropping season a total of 555 qt DAP and Urea and 180.5 qt improved seed was used.
The major problems in input use in the kebele are: Lack of on time delivery of inputs, Lack of accessible roads up to the Kebele, Different varieties of improved seeds are not delivered, High input price, and Lack of skilled manpower
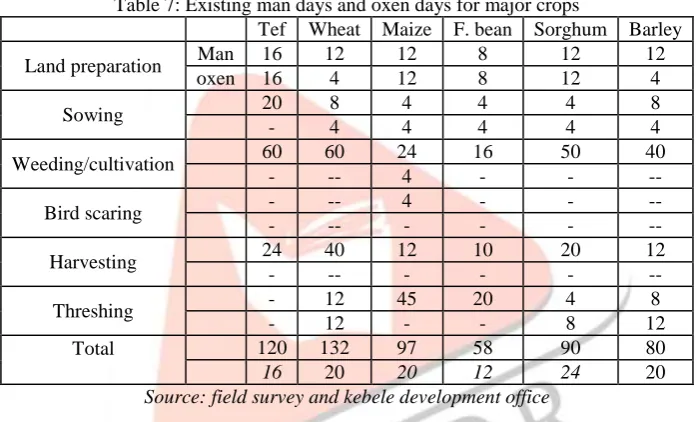
Table 7: Existing man days and oxen days for major crops
Tef Wheat Maize F. bean Sorghum Barley
Land preparation Man 16 12 12 8 12 12
oxen 16 4 12 8 12 4
Sowing 20 8 4 4 4 8
- 4 4 4 4 4
Weeding/cultivation 60 60 24 16 50 40
- -- 4 - - --
Bird scaring - -- 4 - - --
- -- - - - --
Harvesting 24 40 12 10 20 12
- -- - - - --
Threshing - 12 45 20 4 8
- 12 - - 8 12
Total 120 132 97 58 90 80
16 20 20 12 24 20
Source: field survey and kebele development office
Farming Practice
Land Preparation:-Land preparation is done by using the traditional way of plow drawn by two oxen. The number of plowing vary from one crop to another, within a given crop also the frequency of plowing vary due to the presence or absence of enough labor and animal power.
Sowing and weeding/ cultivation:-The method of sowing for most of the crops is by broad casting. After the crop has sown, weeding is practiced to decrease the competition of weeds for nutrients, light and moisture. Therefore, weeding is practiced through hand weeding, for maize there is a traditional practice called ‘shelshalo’. They also use 2,4D for most of the crops.
Harvesting and Threshing:-Harvesting is done by hand picking and with the help of sickles; this is done when the crop reach at maturity. The harvested crop is collected and transported to winnowing area and left for some time to decrease the moisture content of the grain. When it becomes dry they run over animals to separate the grain from its cover.
Table 8: Frequency of plowing and weeding for major crops Crop Frequency of plowing Frequency of weeding
Tef 4 1-2
Maize 3-4 2(one Shelshalo)
Wheat 4 2
F. bean 2 -
Sorghum 2 1-2(and 2,4D)
Barley 3-4 2
Source: field survey and kebele development office
3.1.3 Cropping System
IJEDR1702192
International Journal of Engineering Development and Research (www.ijedr.org)1161
Therefore, the common crop rotations practiced by the farmer in the area are:Maize --- Tef
Maize --- Wheat/Barley Wheat --- F.bean/F.pea
3.1.4 Agricultural Extension
Like any other areas of the region, the agricultural extension system in the woreda is agricultural training and advisory extension system. Two types of extension approaches/ packages are under implementation (minimum and family package). Agricultural extension has been given by the development agents. The development agents supervise the farmers and give technical support about the preparation of compost, fertilizer application, making terrace, forage production. ….In the Kebele there are development agents having different profession (cooperative, plant science and natural resource).
3.1.5 Crop Protection
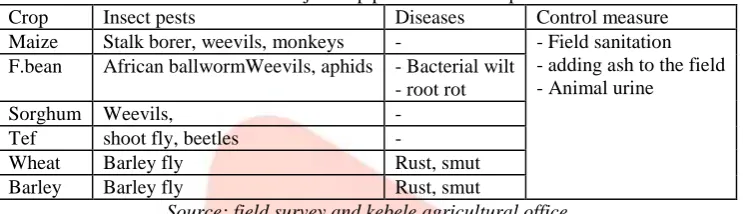
In addition to the other factors, which has great impact on crop production, a significant amount of yield is lost due to pests, these pests include insect pests, diseases, weeds and rodents causing losses at both the pre harvest and post harvest stages.
The types of crop pests are different depending on the type of host crop. So, important crop insect pests, diseases and weeds and the existing control measures are mentioned below.
Table 9: Major crop pests of main crops
Crop Insect pests Diseases Control measure
Maize Stalk borer, weevils, monkeys - - Field sanitation - adding ash to the field - Animal urine
F.bean African ballwormWeevils, aphids - Bacterial wilt - root rot
Sorghum Weevils, -
Tef shoot fly, beetles -
Wheat Barley fly Rust, smut
Barley Barley fly Rust, smut
Source: field survey and kebele agricultural office
In addition to insect pests and diseases, weeds are also causing a significant yield loss, through competition for nutrients, light and moisture, as a host plant for insect pests and diseases, and used as an oviposition site. Weeds are great problems to the farmers due to its high demand for labor to remove the weed. The dominant weeds present in the farmland area are, cucrbits, Cyprus spps, Eragrosties cilianensis, and others. The farmers control these weeds by hand weeding and apply 2-4 D.
3.1.6 Major Constraints of Agriculture
Lack of varieties of improved seed, Erratic nature of the rain fall, Crop insect pest, disease and weed infestation, In accessibility of most of the kebeles to deliver inputs, and Lack of trained manpower at Woreda as well as kebele level
3.2 Traditional Irrigation
There is no well practiced traditional irrigation in the project site. However, elementary schools found in the village divert Gondoro River traditionally and use it to produce vegetable crops and coffee seedlings. But some few farmers able to produce few vegetable crops fetching water using cans from the canal.
3. 3 Irrigation Crop Production 3.3.1 Rational and Objectives
Crop production in the project area is mainly relying on rainfall only one major production season per year. In the project area agriculture comprises both crop and livestock production. Grain is produced under rain fed condition using the traditional ox- drawn plow by smallholder farmers at subsistence level. Few farmers use a low input and most of the farmers do not use inputs. Farmers use low yielding local crop varieties with very small amounts of agro-inputs. Crop production is severely affected by the utilization of back ward farming practices, less diversified crops, and incidence of different crop pests. All these lead to very low crop yields and low standard of living.
On top of the above facts, there is a need to supplement the rain fed production with irrigation and cultivate the land under full irrigation during the dry season by providing different crop types in order to meet the objective of increasing household income, provide food throughout the year for the family, and generally increase the living standard of the people.
Implementation of Gondoro irrigation project is aimed at increasing crop production as well as income of farmers in the project area through the application or use of improved technologies and agricultural inputs and by applying irrigation water from Gondoro river diversion to supplement the rain fed production and for the dry season irrigation for about 80 ha of land.
IJEDR1702192
International Journal of Engineering Development and Research (www.ijedr.org)1162
3.3.2 Proposed Cropping Pattern
The proposed cropping pattern for the project area in the wet season includes Maize, tef, wheat, Barley and F.bean. During the dry season onion, garlic, cabbage, maize, carrot and fruit trees mainly coffee are proposed. The wet season cropping calendar ranges from May to November. Planting of the dry season cropping staggered from December to January targeting the market demand household food scarcity, and allowing enough time for the land preparation to the proceeding crop.
The above crops are selected based on farmers preference, value of the crops, labor required for production, feeding habit of the people and environmental requirements of the crops (suitability of the soil and the prevailing climate).
Table 10: Proposed cropping pattern
% Area(ha)
Wet season
. Maize 10 8 . Tef 45 36 . F.bean 5 4 . Wheat 20 16 . Barley 10 8 . Fruit trees 10 8 Dry season
. Onion 30 24 . Garlic 30 24 . Cabbage 10 8 .Carrot 5 4 .Maize 15 12 . fruit trees 10 8
Total 100 80
The cropping pattern is revised according to the market demand, farmer's diet change and other factors.
The proposed cropping pattern has advantageous for by bringing a certain level of annual income, changes the feeding habit of the family by providing different nutritional contents, improves efficient use of natural resources and ultimately secure household food security.
Table 11 Crop calendar for proposed crops.
Crop Land preparation Planting Time Harvesting Time Wet Season
Maize April-May May October
Tef May-June July November
F.bean May- June June October
Wheat June June-July October
Barley June July October
Dry Season
Onion Nov- Dec Late December Early April Garlic Nov- Dec late December April Cabbage December Jan April Carrot Nov - Dec late December March .Maize December Jan Early May
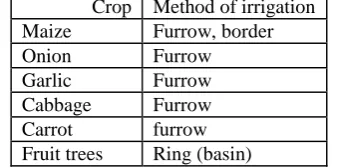
3.3.3 Irrigation System and Method
Irrigation is supplementing rainfall for crop production by bringing surface water or ground water from a surface to fields. Artificial supply of water is needed for ensuring a regular supplement of water during the wet season and providing irrigation during the dry season. Gondoro irrigation project has an irrigation system of diverting Gondoro River. The method of irrigation proposed is furrow, which is suitable for soils of regular topography and medium and heavy soils, reduces the losses due to evaporation, and minimizes the puddling hazard in heavy soil.
Table 12: Method of irrigation for proposed crops Crop Method of irrigation Maize Furrow, border
Onion Furrow
Garlic Furrow
Cabbage Furrow
Carrot furrow
IJEDR1702192
International Journal of Engineering Development and Research (www.ijedr.org)1163
3.3.4 Irrigation Scheduling
Field irrigation schedules are based on the field water balance and are expressed in depth and interval of irrigation. Too frequent small application of water tend to reduce irrigation efficiency and also time consuming for the farmer, delayed irrigation on the other hand particularly when the crop is sensitive to water stress could affect yields which cannot be compensated for by subsequent over watering. Therefore, correct time of irrigation application has great importance for the crop as well as to use effectively the scarce water.
Table 13: Irrigation water requirement (mm/month)
Crop Jan Feb Mar Apr May Jun Jul Aug Sep Oct Nov Dec
Wet Season
Tef 0 0 0 0 0
Maize 0 0 0 0 0
wheat 0 0 10.96 2.13
Barley 0 0 6.33 6.1
F.bean 0 0 0 9.66 4.06
Dry sSeason
Onion 19.15 51.61 61.31 20.51
Garlic 69.35 77.83 53.99 8.23 12.33
Maize 7.81 43.66 67.58 36.78 0
Carrot 26.87 67.56 56.7 5.59
Cabbage 20.27 52.42 62.24 11.89
Fruit 104.37 99.24 78.74 40.25 1.41 0 0 0 1.79 31.33 68.42 91.01 Table 14: Net irrigation requirement (mm/month)
Crop % Jan Feb Mar Apr May Jun Jul Aug Sep Oct Nov Dec
Wet Season
Tef 45 0 0 0 0 0
Maize 10 0 0 0 0 0
wheat 20 0 0 2.19 0.42
Barley 10 0 0 0.63 0.61
F.bean 5 0 0 0 0.48 0.2
Dry Season
Onion 30 12.61 25.04 18.73 1.35 2.83
Garlic 30 20.81 23.35 16.20 2.47 3.70
Maize 15 1.17 10.14 10.14 5.52 0.00
Carrot 5 1.34 3.38 2.84 0.28
Cabbage 10 2.03 5.24 6.22 1.19
Fruit 10 10.44 9.92 7.78 4.03 0.14 0.00 0.00 0.00 0.18 3.13 6.84 9.10
NIR 48.39 77.07 61.91 14.55 0.14 0 0 0 3.48 1.23 6.84 15.91
GIR 96.788 154.146 123.814 29.1 0.28 0 0 0 6.96 2.46 13.68 31.82 Duty for 12hr 0.7 1.2 1.0 0.2 0.0 0.0 0.0 0.0 0.1 0.0 0.1 0.2
Table 15: Irrigation interval and depth of application for proposed crops
Crop Crop
evapotranspiration (mm/season)
Irrigation water requirement (mm/season)
Maximum ETC (mm/day)
Fraction of available soil water(p)
Total
available soil water mm/depth(sa)
Rooting depth d(m)
Depth of application p.sa.d/Ea (mm)
irrigation interval I=p.sa.d/Etcrop days
Onion 432.67 207.84 4.78 0.25 200 0.4 40 4
Maize 502.05 155.84 4.85 0.6 200 1 240 25
Garlic 528.68 221.72 4.57 0.25 200 0.4 40 4
Cabbage 345.23 146.81 4.57 0.45 200 0.4 72 8
Carrot 343.91 156.73 4.57 0.35 200 0.7 98 11
Fruit trees
1533.91 516.56 5.22 0.5 200 1.3 260 25
Soil type: Silt clay loam
Total available soil water (sa): 200mm/m
3.3..5 Irrigation Water Management
IJEDR1702192
International Journal of Engineering Development and Research (www.ijedr.org)1164
By considering farmers experience for irrigation and management of the canals and to reduce loss of water during excessive time of application twelve hours daytime irrigation is proposed.3.3.6 Organizational Aspects of the Project
A permanent solution for all irrigation water management problems is to involve participation of farmers for water distribution right from the stage of release of water from the headwork up to its uptake by the plant and make them responsible for maintenance of the irrigation system. Participation of farmers in irrigation water management implies a significant role for them in decision-making.
The farmers’ participation should be through legal bodies by establishing water users association, which has a supreme committees and sub committees organized, based on neighboring farms or blocks.
The main committee should include farmers, development agents and kebele administrative council. The committee can control and manage the irrigation scheme by deciding seasonal water allocation water balance and operational plan, Controls outlets and structures, ensure equitable distribution of water to all the farmers, repair and maintain the irrigation system during damage and develop by-laws and execute accordingly. The subcommittee also has a duty of preparing timetable for irrigation, control water distribution and cleaning canals within their blocks.
In addition to this farmers should be organized into cooperatives so that they can get inputs through their cooperative. The cooperative also help them to search better price for their produce.
3.3.7 Extension and Research Demonstration
Despite of the fact that, there is an already existing extension system in different agricultural activities it is not effective as of its stage. So, to identify and overcome production problems at the farm level there should be a strong linkage between farmers, researchers and extension staff. The primary extension technique would be participatory technology development, supplemented and supported through a variety of other modern extension systems. Moreover it is better to use the elementary school situated in the midst of the village as a demonstration site since it is already started this work by producing through traditional irrigation.
3.3.8 Crop Protection
To have effective crop protection practice at household level as well as in the Kebele the following activities should be done, i.e. Identifying traditional pest control measures practiced by farmers and use this as part of the pest control measures; Supply the necessary crop protection inputs on time, Pest monitoring at different pest development stage, Training of farmers, development agents and woreda experts on integrated pest management, Conduct on farm demonstration trail of pest control techniques, and Improve post harvest handling of crops and use biological control measures not to affect the environment and crop quality.
3.3.9 Input Requirement
The main agricultural inputs are fertilizer, improved seed and chemicals
Table 16: Input requirements for proposed crops
Crop Seed rate (kg/ha) Fertilizer (kg/ha) Pesticide Herbicide DAP Urea
Maize 25-30 100 100 Enosulfan5% dust 7.8kg/ha
2.5 kg/ha mancozeb - 3.5 kg/ha Ridomil
1lt, 24-D
F.bean 100-120 - -
Tef 20 - 30 100 50
Wheat 150 -175 100 125
Barley 125 50 100
Onion 4-5 100 100
Garlic 1200 - 200
Carrot 4.5 175 -
Cabbage 0.6 250 150
Fruit trees/Coffee 250 seed ling 100/year 80/year
Table 17: Man and oxen days per hectare required for proposed crops Man days oxen days
West season
Maize 102 20
F. bean 64 22
Tef 125 30
Wheat 130 30
Barley 110 16
Day season
Onion 150 20
Garlic 160 26
Carrot 236 20
Maize 226 25
IJEDR1702192
International Journal of Engineering Development and Research (www.ijedr.org)1165
Fruit trees/coffee 280 103.3.10 Yield Projection
To build the yield of the proposed crops throughout the project year references are used on results obtained from research centers, on farm trials and demonstration sites, existing yield of the farmer and the ability to adopt and practice the proposed agricultural practices and so on. The yield of the proposed crops increases with a smaller rate at the start and increases when the extension services become strong and farmers’ awareness for technologies escalates.
Table 18: Yield build up of irrigated crops ( qt/ha) Crop Implementation year
1 2 3 4 5
Maize 30 40 50 60 60
F. bean 12 16 20 22 25
Wheat 30 35 40 45 48
Barley 24 30 36 40 43
Tef 13 16 20 20 20
Onion 150 200 250 300 300
Garlic 20 30 40 45 45
Carrot 55 60 80 90 100
Cabbage 80 110 120 130 140 Fruit trees/coffee 12 15 17 17 17
3.3.11 Anticipated Benefits
The implementation of the project will provide irrigation water to an area of 80 hectares. Farmers’ in the project area able to cultivate double cropping under summer season with supplementary irrigation and during the dry season full irrigation. This will increase total production and productivity of the area. Planting of horticultural crops and high value crops makes the beneficiaries to get high income and different nutritional content crops. Moreover, helps to secure food availability for the household throughout the year.
The practice of irrigation will create additional employment opportunities for the beneficiaries as well as for the people outside the command area. A part from the scheme’s beneficiaries, many other families in the surroundings will benefit from increased food production and possible labor opportunities in the irrigated fields.
Crop failure due to late set or early withdrawal of the rainfall will be considerably reduced through the provision of supplementary irrigation of wet season crops. This will boost crop yields and offset food deficit in the area. The project will also encourage crop diversification based on market demands in and out of the Wareda.
New farming practices and improved technology will be provided through the extension services of the project. More importantly, apart from the benefits it provides to the beneficiaries, the project will also serve as a demonstration site for irrigation practices to the surrounding farmers.
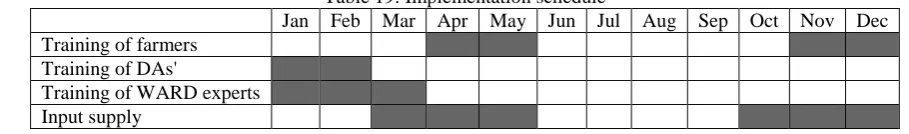
3.3.12 Implementation Schedule
Increasing yield of agricultural products is one of the challenges of developing countries with the growing population. So, there should be a mechanism to increase the productivity of a unit of land by applying most effective technologies developed by farmers, researchers, or any other body. Along with this, training of farmers and agricultural development staff should be under taken to back up the practical and theoretical expertise of improved technologies. So that, training should be given for farmers before the starting of irrigation crop production in different technical and management practices, development agents and extension staff should also be trained. To make the project sound, inputs are also delivered on time and with enough amounts.
Table 19: Implementation schedule
Jan Feb Mar Apr May Jun Jul Aug Sep Oct Nov Dec Training of farmers
Training of DAs'
Training of WARD experts Input supply
3.3.13 Resource Required
As part of the resource required there are human and physical resources required. For the kebele there are three development agents with different discipline, and there are also woreda experts in each field who work in all the kebeles.
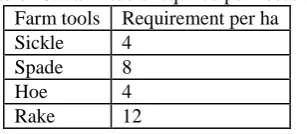
Concerning materials required for the household, since they are planning to cultivate vegetables, there is an intensive work of land preparation, cultivation and watering. So the materials required by the family are given below.
IJEDR1702192
International Journal of Engineering Development and Research (www.ijedr.org)1166
Table 20: Farm tools required per hectareFarm tools Requirement per ha Sickle 4
Spade 8
Hoe 4
Rake 12
3.3.14 Soil Study
In all the test pits taken at the command area the depth of the soil is very deep which is greater than 2m. The command area has a soil type of clay loam, loam and silt loam. The soil PH ranges from 4.91 to 6.57 which are slightly acidic. The organic carbon continent is from 1.21 % from the deepest depth to 4.08% at the top of the soil. The electrical conductivity (EC) is also from 0.02 to 0.10. In general the soil is ideal for crop growth. Detail soil characteristics are explained in Table 21.
Table 21 Soil Laboratory Test Result Test pit no. Sample no. Sample depth(cm) Analysis type
Texture(%Sand, Silt, Clay) PH EC(ms/cm) OC
1 1 0-30 22.8,54.67,22.51(silt loam) 5.87 0.10 2.91
2 30-60 15.79,40.97,43.24(Silt clay) 4.91 0.03 1.21
2 3 0-30 32.31,45.85,21.83(Loam) 6.57 0.09 4.08
4 30-60 25.16,38.52,36.32(Clay loam) 6.23 0.03 1.40
3 5 0-30 23.41,45.31,31.28(Clay loam) 6.37 0.07 3.94
6 30-60 17.05,36.50,46.45(Clay) 5.43 0.03 1.73
4 7 0-30 42.53,37.25,20.22(Loam) 5.64 0.08 4.51
8 30-60 22.49,39.83,37.68(Clay loam) 5.01 0.02 1.38
IV.CONCLUSIONS
In general, as a conclusion the agro-climatic condition of the project site, the suitability of the soil for crop production, physical feature of the command area and the availability of irrigation water are suitable for development of irrigation.
Despite the above facts, the sustainability of the project is very much dependent on the full participation of the beneficiaries in all aspects of the project implementation. The participatory approach will create a sense of responsibility and ownership and greatly contributes to the success of the irrigation schemes constructed in previous years.
The objective of the project will only achievable when:
- The beneficiaries are encouraged to organize themselves for operation, input provision and marketing of products - Provision of credit for inputs and other needs is on time
- The extension service is effectively established and
- Periodical training is provided to both extension field staff and beneficiary farmers
The cropping pattern proposed for the scheme is based on the current knowledge of the beneficiaries and as such does not pose any problem of adoption. However, the production of vegetables and other cash crops is, for most part, dictated by the prevailing market demands. Planning of vegetable crop production, therefore, requires adequate market information to be parted to the farmers. Moreover, continuous adaptive research in vegetables and other cash crops need to be supported by regional research institutions.
V.REFERENCES
[1] Abate H. (2007), Review of Extension Systems Applied in Ethiopia with Special Emphasis to the Participatory Demonstration and Training Extension System, Rome: FAO.
[2] Admasu Gebeyehu, 1988: Regional Analysis on Some Aspects of Stream flow Characteristics in Ethiopia. (Unpublished Draft Report). August 1988.
[3] ARARI, 2005. Crop production guideline for development agents, Vegetable and Fruit crops (Amharic). Bahir dar
[4] Awulachew, S.B. et al. 2007, Water resources and irrigation development Ethiopia, Ethiopia working paper 123, Addis Ababa, International Water Management Institute.
[5] Banihabib, M. E., Valipour, M., and Behbahani, S. M. R. (2012). “Comparison of autoregressive static and artificial dynamic neural network for the forecasting of monthly inflow of Dez reservoir.” J. Environ. Sci. Technol., 13(4), 1–14.
[6] Beltrando, G., Camberlin, P., 1993. Inter annual variability of rainfall in the eastern horn of Africa and indicators of atmospheric circulation. Int. J. Climatol. 13, 533-546.
[7] Camberlin, P., 1997. Rainfall anomalies in the Source Region of the Nile and their connection with the Indian Summer Monsoon. Journal of Climate, Vol. 10, pp. 1380 - 1392.
[8] Continental consultants,1996. Irrigation agronomy in SAERAR micro irrigation schemes. Vol. VIII
[9] Davis, K, B. Swanson, and D. Amudavi. (2009), Review and Recommendations for Strengthening the Agricultural Extension System in Ethiopia. International Food Policy Research Institute (IFPRI).
[10] ERA (Ethiopian Roads Authority), 2002: Drainage Design Manual, Hydrology.
IJEDR1702192
International Journal of Engineering Development and Research (www.ijedr.org)1167
[12] FAO, 1996. Irrigation and drainage paper. vol-24.Rome.[13] FAO, 1996. Irrigation and drainage paper. vol-33.Rome.
[14] FAO (1998): CROPWAT for Windows, User-Guide, Version 4.3.
[15] Food and Agriculture Organization, homepage. www.fao.org (01-01-2008)
[16] FAO (Food and Agricultural Organization of the United Nations) (2014), Food and Agriculture organization of the United Nations, Global information and Early warning system country brief. December 2014.
[17] Fiddes D, 1977: Flood estimation for small East African rural catchments, Proceeding Institution of Civil Engineers, Part 2, 63, 21-34 (1977)
[18] Haile, T., 1986. Climatic variability and support feedback mechanism in relation to the Sahelo-Ethiopian droughts. M.Sc. Thesis in Meteorology, Department of Meteorology, University of Reading, U.K. pp.119-137
[19] Haile, A.M. 2007, A tradition in transition, water management reforms and indigenous spate irrigation systems in Eritrea. Leiden, Taylor and Francis/Balkema. Ph. D. thesis. Wageningen University.
[20] K. Subramanya (2006), Engineering Hydrology, Second Edition, Tata McGraw Hill; New Delhi
[21] Mersha, E., 1999. Annual rainfall and potential evapotranspiration in Ethiopia. Ethiopian Journal of Natural Resources 1(2): 137-154.
[22] MOWR 2004, National water development report for Ethiopia, United Nations Educational, Scientific, and Cultural Organization World Water Assessment Program.
[23] Mutreja, K.N. (1986) Applied Hydrology. 959 p. Tata McGraw Hill.
[24] NMSA (National Meteorology Service Agency), 1996. Climatic and Agro climatic Resources of Ethiopia. Vol. 1, No. 1. National Meteorology Service Agency of Ethiopia, Addis Ababa.137 pp.
[25] Rahimi, S., Gholami Sefidkouhi, M. A., Raeini-Sarjaz, M., and Valipour, M. (2014). “Estimation of actual evapotranspiration by using MODIS images (A case study: Tajan catchment).” Arch. Agron. Soil Sci., 1.
[26] R.D Misra and M. Ahmed.1987. Irrigation agronomy manual. India.
[27] Shaw, Elizabeth M., 1988: Hydrology in Practice. International Van Nostrand Reinhold.
[28] Schrader, F., et al. (2013). “Estimating precipitation and actual evapo transpiration from precision lysimeter measurements.”
Procedia Environ. Sci., 19, 543–552.
[29] S.K. Garg (2005), Hydrology & Water Resources Engineering; 13th revised edition ; New Delhi
[30] Taddesse, T., 2000. Drought and its predictability in Ethiopia. In: Wilhite, D.A. (Ed.), Drought: A Global Assessment, Vol. I. Routledge, pp. 135-142.
[31] Tesfaye, K., 2003. Field comparison of resource utilization and productivity of three grain legumes under water stress. Ph.D. thesis in Agro meteorology, Department of Soil, Crop and Climate Sciences, University of the Free State, South Africa. [32] Teshome, W. 2003, Irrigation practices, state intervention and farmers’ life-worlds in drought-prone Tigray, Ethiopia. Ph. D.
thesis. Wageningen University.
[33] Tian, H., Wen, J., Wang, C. H., Liu, R., and Lu, D. R. (2012). “Effect of pixel scale on evapotranspiration estimation by remote sensing over oasis areas in north-western China.” Environ. Earth Sci., 67(8), 2301–2313.
[34] Tian, F., Qiu, G., Yang, Y., Lu, Y., and Xiong, Y. (2013). “Estimation of evapotranspiration and its partition based on an extended three temperature model and MODIS products.” J. Hydrol., 498, 210–220.
[35] Tilahun, K, 1999. Test homogeneity, frequency analysis of rainfall data and estimate of drought probabilities in Dire Dawa, Eastern Ethiopia. Ethiopian Journal of Natural Resources 1(2) 125-136.
[36] US Army Corps of Engineers (1993). Hydrologic Frequency Analysis, Engineer Manual 1110-2-1415.
[37] USDA Soil Conservation Service (1972) National engineering handbook: section 4. Hydrology, Chapters 4–10 USDA-SCS, Washington, DC
[38] Valipour, M. (2014a). “Analysis of potential evapotranspiration using limited weather data.” Appl. Water Sci., in press. [39] World Bank (2008), Ethiopia at a glance. Washington, D.C.: World Bank.