IJEDR1701007
International Journal of Engineering Development and Research (www.ijedr.org)33
Dynamic Message Id Allocation And Arbitration In
Can Architecture
Keshav Verma1, Raman Jeet Singh2
1 Student, Electronics and communication Department 2 Lecturer, Electronics and communication Department
Ludhiana Collage of Engineering and technology, Katani kalan
Abstract - On board communication on FPGA is an issue of interest for many researchers in recent years. Various protocols have been proposed in the literature to provide communication between central unit and peripherals. Control Area Network is also an on board protocol for communication of FPGA or microcontrollers with different peripherals. Traditionally, the message id allocation in CAN is static which means only one id is given to each application and it remains same throughout the communication. This leads to biasness for various applications while others always access the bus at the time of arbitration. In this paper Dynamic approach of message id allocation from the message id window is proposed which increases the randomness and thereby decreases the biasness. The results discussed in the coming sections also prove the same.
Keywords - CAN, Bus Arbitration, Dynamic Message Scheduling.
INTRODUCTION
The Controller area Network may be a serial bus prescript developed by Bosch within the early Eighties [1]. It defines a regular for economical and reliable communication between detector, controller, actuator and different nodes in period of time applications. It is the de facto customary during a giant form of networked embedded management systems. The first development was primarily supported by the vehicle industry: which is found during the form of cars, trucks, boats, spacecraft, and different kinds of vehicles [2]. The protocol is additionally wide used these days in industrial automation and different areas of networked embedded management, with applications in numerous products like production machinery, medical instrumentality, building automation, weaving machines, and wheelchairs [1].
The will protocol standardizes the physical and electric circuit layers, that square measure the 2 lowest layers of the open systems interconnect communication model. For many systems, higher-layer protocols square measure required to modify economic development and operation [3]. Such protocols square measure required for outlining. However, protocol ought to be employed in applications, as an example, a way to talk to the configuration of identifiers with relation to application messages, a way to package application messages into frames, and the way to affect start-up and fault handling.
Description
A bus can manage data field and overhead, like symbol and management fields [4]. Since the appliance processes generally square measure asynchronous, the bus features a mechanism for resolution conflicts. For CAN, it's supported a non-destructive arbitration method. The will protocol thus belongs to the category of protocols denoted as carrier sense multiple access/collision shunning, which implies that the protocol listens to the network so as to avoid collisions [5]. CSMA/CD protocols like local area network have instead a mechanism to affect collisions once they're detected. It can also include numerous strategies for error detection and error handling. The communication rate of a network supported will depends on the physical distances between the nodes [5]. If the gap is a smaller amount than forty m, the speed is up to one Mbps.
Application Presentation
Session Transport
Network Data link Physical
Figure: 1: Vehicle Applications of Controller Area Network Message formats
CAN distinguishes four message formats: information, remote, error, and overload frames. Here we tend to limit the discussion to info frame. The knowledge frame begins with the start-of-frame bit. It’s followed by associate eleven-bit symbol and also the remote transmission request bit. The symbol and also the RTR bit kind the arbitration field [6]. The management field consists of six bits and indicates what percentage bytes of information follow within the data field. The info field is zero to eight bytes. The info field is followed by the cyclic redundancy verification field that permits the receiver to envision if the received bit sequence
IJEDR1701007
International Journal of Engineering Development and Research (www.ijedr.org)34
was corrupted [7]. The two-bit acknowledgment field is employed by the transmitter to receive associate acknowledgment of a legitimate frame from any receiver.SOF Identifier RTR Control Data CRC ACK EOF
Figure 2: CAN bus Arbitration
Arbitration is that the mechanism that handles bus access conflicts. Whenever the will bus is free, any unit will begin to transmit a message [8]. Attainable conflicts, as a result of quite more than one unit getting down transmitting at the same time, square measure resolved by bit-wise arbitration victimisation the symbol of every unit [8]. Throughout the arbitration section, every transmission unit transmits its symbol and compares it with the extent monitored on the bus [9]. If these levels square measure equal, the unit continues to transmit. If the unit detects a dominant level on the bus, whereas it had been attempting to transmit a recessive level, then it equal transmission.
Figure 3: CAN message frame PROPOSED METHODOLOGY
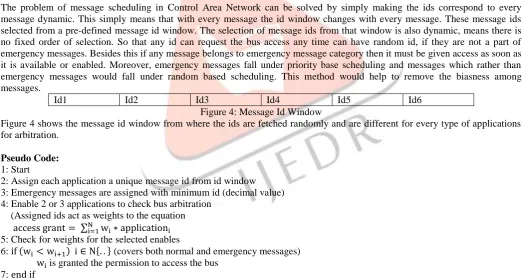
The problem of message scheduling in Control Area Network can be solved by simply making the ids correspond to every message dynamic. This simply means that with every message the id window changes with every message. These message ids selected from a pre-defined message id window. The selection of message ids from that window is also dynamic, means there is no fixed order of selection. So that any id can request the bus access any time can have random id, if they are not a part of emergency messages. Besides this if any message belongs to emergency message category then it must be given access as soon as it is available or enabled. Moreover, emergency messages fall under priority base scheduling and messages which rather than emergency messages would fall under random based scheduling. This method would help to remove the biasness among messages.
Id1 Id2 Id3 Id4 Id5 Id6
Figure 4: Message Id Window
Figure 4 shows the message id window from where the ids are fetched randomly and are different for every type of applications for arbitration.
Pseudo Code: 1: Start
2: Assign each application a unique message id from id window 3: Emergency messages are assigned with minimum id (decimal value) 4: Enable 2 or 3 applications to check bus arbitration
(Assigned ids act as weights to the equation access grant = ∑Ni=1wi∗ applicationi 5: Check for weights for the selected enables
6: if (wi < wi+1) i ∈ N{. . } (covers both normal and emergency messages) wi is granted the permission to access the bus
7: end if 8: End
Worst case response time: Process is said to be schedulable only when it meet its deadline or message reach at its destination before deadline it mean there is no chance when it violate its deadline. However, in physical application there are many processes which ended up very close to their deadline. Response time of the system defines the weather system is scheduled or unscheduled. Basic idea of this work to consider additional interference that can block the transmission of message M. Such interference can describe by the function E(α,ω,i). Whereby α represent the scaling factor, ω describe the time interval over which interference occur and i is priority level affected by interference.
Robust priority order
The priority assignment produced by the RPA algorithm using the additional interference function which is 𝛼 that is maximizes the number of faults that the system can tolerate without any message missing its deadline. Furthermore, value of interference depend upon interference factor 𝛼 and interference function can be derived through E (𝛼, 𝜔, ! ). 𝛼 is interference factor, 𝜔 is scaling factor and ! is priority level which going to be affected.
NODE 1
BUS
NODE 2
IJEDR1701007
International Journal of Engineering Development and Research (www.ijedr.org)35
Robust Priority Assignment Algorithm:for each priority level m, lowest first {
for each unassigned message M {
binary search for the largest value of α for which message M is Schedulable at priority m
}
if no messages are schedulable at priority m return unschedulable
else
assign the schedulable message that tolerates the max α at priority m to priority m }
return schedulable
α is represented by maximum number of error that bus can tolerate of particular frame that being transmitted on bus. In other words we can say α is maximum number of error bits one particular message can tolerate before the transection of message being completed. Tα is a transmission time for α.
RESULTS AND DISCUSSIONS
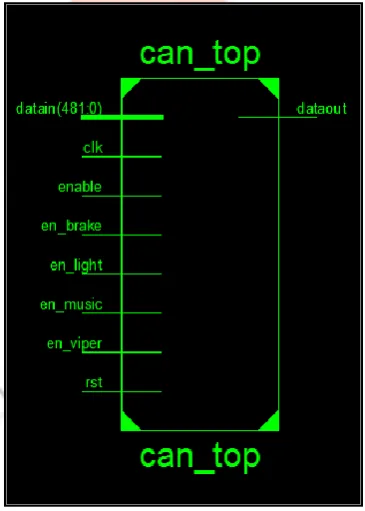
The proposed methodology is simulated using the Xilinx Virtex4 FPGA in Xilinx ISim and the coding is done in Xilinx ISE environment using VHDL language. Figure 6 shows the top module implementation of the proposed methodology and figure 7 shows the simulation of the top module.
Figure 5: CAN Top Module The worst case response time of the system to each message is given by
WMn+1= min(α, Fixed Id) + ∑
WMn+ τbit+ DM TM
(1)
RM= WMn+1+ CM (2)
Here 𝑅𝑀 is the worst case response time. 𝛼 Is the number of bits error, 𝜏𝑏𝑖𝑡 is the time required to transfer 1 bit, 𝐷𝑀 is the deadline time and 𝑇𝑀 is the period of the message, 𝑊𝑀 is the step value for Message M and 𝐶𝑀 is maximum transmission time of frame. Table 1 to Table 5 shows the actual order of processing of all messages. Dead line time frame has been considered on the basis of assumption by studying previous work on Controller Area Network.
IJEDR1701007
International Journal of Engineering Development and Research (www.ijedr.org)36
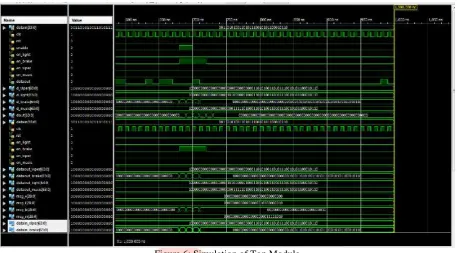
Figure 6: Simulation of Top ModuleHowever, arbitration bit value would decide the priority level of each ECU. Each and every sensor or ECU having its own priority level or arbitration bit value. It is very important to note that binary bit value at arbitration level would decide the priority level among ECUs. In above figure there are four ECUs considered which controls lights, break, wiper, music. Control of bus to any particular ECU shall be provided through arbitration mechanism. The ECU which having lower binary or decimal value would win the arbitration.
Response time Calculation with full frame: Full frame comprise with 128 bits and below result has been calculated by the transfer of 128 bits on CAN bus with 500Kbit/s. Moreover, it has been assumed that no error occur during the full communication.
OM Message α Tα RTB RT DM DMB
1 M1 680 1.36 320 0.64 2 1000
5 M2 1688 3.376 832 1.664 5 2500
4 M3 1796 3.592 704 1.408 5 2500
3 M4 1924 3.898 576 1.152 5 2500
2 M5 2052 4.104 448 0.896 5 2500
6 M6 2540 5.08 960 1.192 7 3500
7 M7 2192 4.384 1088 2.176 8 4000
11 M8 3400 6.8 1600 3.2 10 5000
10 M9 3528 7.056 1472 2.944 10 5000
9 M10 3656 7.312 1344 2.688 10 5000
8 M11 3784 7.568 1216 2.432 10 5000
12 M12 5722 11.444 1728 3.456 15 7500
Table 1: Response Time calculation with full frame
IJEDR1701007
International Journal of Engineering Development and Research (www.ijedr.org)37
Graph 1: Response Time calculation with full frameResponse Time calculation with Arbitration bits and Data bits: In CAN protocol use 64 bits for data and uses standard arbitration bit values which is 11 bits or extended bit values which comprise of additional 18 bit values. Response time calculated with the assumption of no error occur during the data transmission.
OM Message α Tα RTB RT DM DMB
1 M1 680 1.36 320 0.64 2 1000
5 M2 1808 3.616 692 1.384 5 2500
4 M3 1901 3.802 599 1.198 5 2500
3 M4 1994 3.988 506 1.012 5 2500
2 M5 2087 4.174 413 0.826 5 2500
6 M6 2715 5.43 785 1.57 7 3500
7 M7 3122 6.244 878 1.756 8 4000
11 M8 3750 7.5 1250 2.5 10 5000
10 M9 3843 7.686 1157 2.314 10 5000
9 M10 3932 7.864 1068 2.128 10 5000
8 M11 4029 8.058 971 1.942 10 5000
12 M12 6157 12.314 1343 2.686 15 7500
Table 2: Response Time calculation with Arbitration and data bit
Response time calculation with one bit error with maximum stuff bits: Response time calculation with one bit error and the error occur when a bus just about to finish the transmission. Moreover, we assume error occurs at 127th bit value and which makes network to retransmit the whole data along with additional 31 bits due to fact that error which makes additional (17 to 31) stuff bits added on bus.
OM Message α Tα RTB RT ERT ERTB DM DMB
1 M1 330 0.66 320 0.64 1.34 670 2 1000
5 M2 686 1.372 832 1.664 3.628 1814 5 2500
4 M3 972 1.944 704 1.408 3.056 1528 5 2500
3 M4 1258 2.516 576 1.152 2.484 1242 5 2500
2 M5 1544 3.088 448 0.896 1.912 956 5 2500
6 M6 1400 2.8 960 1.192 4.2 2100 7 3500
7 M7 1614 3.228 1088 2.176 4.772 2386 8 4000
11 M8 1470 2.94 1600 3.2 7.06 3530 10 5000
10 M9 1756 3.512 1472 2.944 6.488 3244 10 5000
9 M10 2042 4.084 1344 2.688 5.916 2958 10 5000
8 M11 2328 4.656 1216 2.432 5.344 2672 10 5000
12 M12 3684 7.368 1728 3.456 7.632 3816 15 7500
Table 3: Response Time calculation with maximum stuff bit
0 2 4 6 8 10 12 14 16
1 5 4 3 2 6 7 11 10 9 8 12
RT
DM
IJEDR1701007
International Journal of Engineering Development and Research (www.ijedr.org)38
Graph 2: Response Time calculation with maximum stuff bitWe have illustrated above results in form of lines in Graph-2.Here we have calculated response time of a system in event of error occurs during transmission and that is represented by Error response time (ERT). Line graph clearly shows that system is schedulable accord with above results due to fact that response time of all messages with in the deadline and within stipulated timeline frame. Blue line represents response time and red line shows dead line which is maximum stipulated time frame in which data can transfer.
Moreover, it is very important to note that violation of deadline time would lead to the instability. In order to make sustainable system there is necessarily measure for every transmission that it complete with in time frame. α is maximum number of error bits one particular message can make before the transection of message being completed. Tα is a transmission time for α.
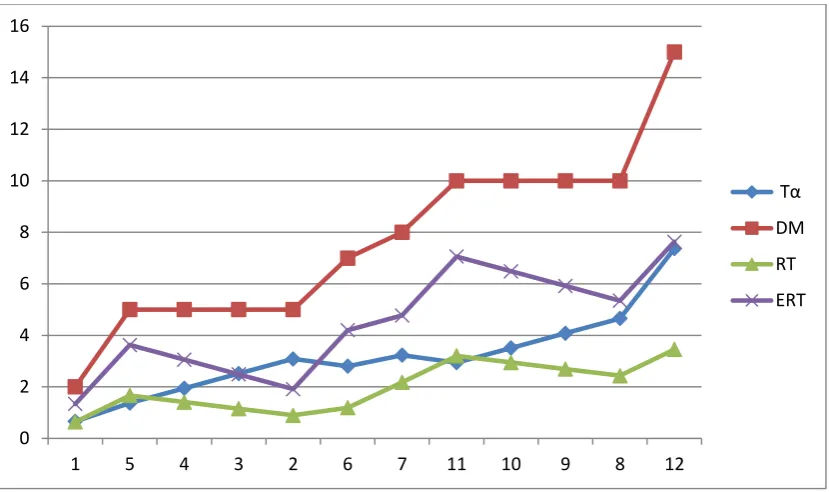
Response time calculation with one bit error with minimum stuff bits: Response time calculation with one bit error and the error occur at very early just after the transmission gets started. Moreover, below result has been calculated by assuming error occurs at 10th bit.
OM Message α Tα RTB RT ERT ERTB DM DMB
1 M1 653 1.306 320 0.64 0.694 347 2 1000
5 M2 1533 3.066 832 1.664 1.934 967 5 2500
4 M3 1688 3.376 704 1.408 1.624 812 5 2500
3 M4 1843 3.686 576 1.152 1.314 657 5 2500
2 M5 1998 3.996 448 0.896 1.004 502 5 2500
6 M6 2378 4.756 960 1.192 2.244 1122 7 3500
7 M7 2723 5.446 1088 2.176 2.554 1277 8 4000
11 M8 3103 6.206 1600 3.2 3.794 1897 10 5000
10 M9 3258 6.516 1472 2.944 3.484 1742 10 5000
9 M10 3413 6.826 1344 2.688 3.174 1587 10 5000
8 M11 3568 7.136 1216 2.432 2.864 1432 10 5000
12 M12 7948 15.896 1728 3.456 4.104 2052 15 7500
Table 4: Response Time calculation with minimum stuff bits
0 2 4 6 8 10 12 14 16
1 5 4 3 2 6 7 11 10 9 8 12
Tα
DM
RT
IJEDR1701007
International Journal of Engineering Development and Research (www.ijedr.org)39
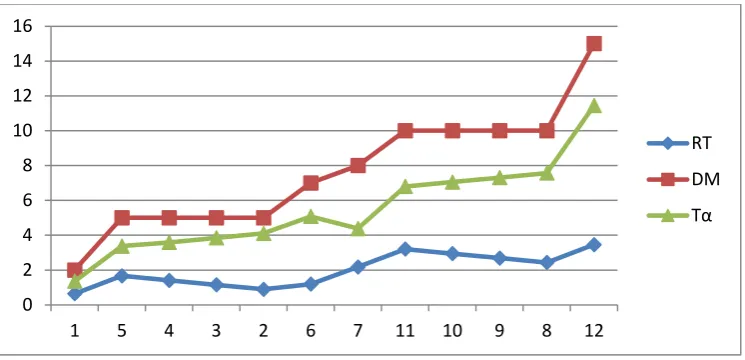
Graph 3: Response Time calculation with minimum stuff bitsHere we have illustrated the results in form of lines. Here we have calculated response time of a system in event of error occurs during transmission and that is represented by Error response time (ERT). Line graph clearly shows that system is schedulable accord with above results due to fact that response time of all messages with in the deadline or with in stipulated timeline frame. Blue line represents response time and red line shows dead line which is maximum stipulated time frame in which data can transfer.
Average response Time: Average response time has been calculated by the Error response time taken from Table 3 and Table 4. On the basis of Error response time we have calculated Average response time. We have also tried to demonstrated Average response time in Line Graph 4 and in which clearly indicated the Average response time is under the time frame. In addition to this graph also shows the ERT calculated in Table 3 and Table 4.
OM ERTB1 RT1 ERTB2 RT2 RTB ART
1 670 1.34 347 0.694 508.5 1.017
5 1814 3.388 967 1.934 1390.5 2.781
4 1528 2.876 812 1.624 1170 2.34
3 1242 2.364 657 1.314 949.5 1.899
2 956 1.852 502 1.004 729 1.458
6 2100 3.9 1122 2.244 1611 3.222
7 2386 4.412 1277 2.554 1831.5 3.663
11 3530 6.46 1897 3.794 2713.5 5.427
10 3244 5.948 1742 3.484 2493 4.986
9 2958 5.436 1587 3.174 2272.5 4.545
8 2672 4.924 1432 2.864 2042 4.084
12 3816 6.972 2052 4.104 2934 5.868
Table 5: Average Response Time
0 2 4 6 8 10 12 14 16
1 5 4 3 2 6 7 11 10 9 8 12
Tα
DM
RT
IJEDR1701007
International Journal of Engineering Development and Research (www.ijedr.org)40
Graph 4: Average Response TimeAbbreviation RT: Response Time RTB: Response Time Bit DM: Dead Line
DMB: Dead Line Bit ERTB: Error response Time ERT: Error Response Time TM: Total Time
CONCLUSION AND FUTURE SCOPE
The message id allocation in CAN is done statically which results in biased bus arbitration. So firstly dynamic message id allocation is tested which shows improved and unbiased message id allocation and bus arbitration. Then for emergency messages dynamic message id allocation is tested and it is proved from the simulation results that whenever there is any emergency message then it immediately grants access to that message.
In future the proposed methodology must be tested for a number of other application specific signals. Mainly for those applications which use two or more emergency messages and wants to access the resource or are involved in bus arbitration. We have calculated response time of transmitting full frame, Data and arbitration bits and error occur during full frame transmission at the rate of 500 Kbit/sec. At the end in table-5 we have calculated average error may occur during transmission and that may effect on response time of a system. Average result has been calculated by considering error happen at particular message with the cost of retransmission.
REFERENCES
[1] Isizoh A.N, Ogu C.D,Nwokoye A.O.C,Okide S.O: Modelling and real time simulation for a network control system with distributed load. Vol. 2 No. 6 Dec 2011-Jan 2012.
[2] Robart I Davis, Alan Burns: Controller Area Network (CAN) Schedulability Analysis: Refuted, Revisited and Revised. [3] Jose Rufino, Paulo Verissimo, Guiherme Arroz: Embedded Platforms for Distributed Real-Time Computing: Challenges and Results.
[4] Divya Shrama Mayank Gupta, “Controller Area Network for Automobile Application Using ASIC Based on PSoC and Analysing Through Vector CAN. International Journal of Innovative
Volume-2, Issue-5, April 2013
[5] Nicolas Bravo, Skanda Koppula, Matthew Chang[2015]: A Public-Key Authentication Scheme for Controller Area Networks.
[6] Robart I Davis and Steffen kollmann: Schedulability Analysis for Controller Area Network (CAN) with FIFO Queues Priority Queues and Gateways.May 2015.
[7] Tajel F, S.N Pawar[2012]:Controller Area Network Data Extraction for Automobile. March 2012.©IJAET ISSN: 2231-1963.
[8] Bogdan Groza and Pal-Stefan Murvay[2013]: Broadcast Authentication in a Low Speed Controller Area Network.
[9] L.Jayaraju, I.Manjula Raini[2012]: Automotive Automation and Remote Access using GSM Technology. (IJCSITS), ISSN: 2249-9555 Vol. 2, No. 1, 2012.
0 2 4 6 8 10 12 14 16
1 5 4 3 2 6 7 11 10 9 8 12
RT1
DM
RT2
IJEDR1701007
International Journal of Engineering Development and Research (www.ijedr.org)41
[10] Wei Lun Ng , Chee Kyun Ng, Borhanuddin Mohd. Ali, Nor Kamariah Noordin, and Fakhrul Zaman Rokhani[2010]: Review of Researches in Controller Area Networks Evolution and Applications.Asia-Pacific Advanced Network 2010 v. 30, p. 14-21.x.doi.org/10.7125/APAN.30.3