ABEPRO
DOI: 10.14488/BJOPM.2017.v14.n2.a4
MULTICRITERIA DECISION AID TOOL FOR THE OPERATIONAL MANAGEMENT OF AN
INDUSTRY: A CONSTRUCTIVIST CASE
Sandro César Bortoluzzi1, Sandra Rolim Ensslin1, Leonardo Ensslin1, Marcos Ottoni de Almeida1
Federal University of Santa Catarina
ABSTRACT
The objective of this work is to construct a performance evaluation model to provide support to a production director in the management of the productive operations of a furniture industry. In this sense, we sought through the Multicriteria Decision Aid Constructivist Methodology (i) to identify the factors considered important by the production director for evalu
-ating the performance of productive operations, (ii) to measure each criterion of performance evaluation, (iii) to integrate the criteria to allow the evaluation of organizational performance at the tactical and strategic levels and (iv) to develop a process to manage the actions of productive operations improvement.As a research result we have a performance evaluation model for supporting the management of the productive operations. We conclude that the MCDA-C allowed for building the knowledge of the decision-maker on how to identify and measure the critical variables and manage the performance of the productive operations.
1. INTRODUCTION
There is an extensive amount of literature on operational management, considering different ways in which a produc
-tion system should behave, as well as methods to improve the performance (Gupta et Somers, 1996; Quezada et al., 2006; Lima, Costa et Angelis, 2008; Baldwin et al., 2010). However, the mathematical models are concentrated on a small part of the real problem, whiletheperformance prob
-lems of production involve a wide range of factors (Hopp et al., 2007).
The need to improve the performance of the operational activities of production began after the Industrial Revolution and is intensified today mainly due to global competition and shorter product life cycles. Thus, in order to achieve success in the market, the manufacturing companies have sought new ways: (i) to reduce costs; (ii) to improve quality; (iii) to increase flexibility; (iv) to reduce the response time and; (v) to develop and introduce innovation (Hoop et al., 2007; Gupta et Somers, 1996).
In this context, the use of evaluation tools for productive operations performance in organizations has appeared to be a particularly successful way to support the manager in the identification and adoption of strategies and action plans.
However, the performance evaluation (PE) system must allow the visualization of which operational activities explain the strategic objectives, as well as their current situation and the contribution of improvement actions (Frost, 1999).
The limitations of the first-generation evaluation models, which were restricted to the financial aspects, should be overcome and all the activities that have been identified as adding value should be incorporated, whether tangible or intangible (Ensslin et al., 2010; da Rosa et al., 2012).
This systemic view of the process leading to performance evaluation (PE) requires it to meet the six paradigms below:
1. Being constructed in a personalized way to repre
-sent the values and preferences of the managers as
-sociated with the environment specificities that it is proposed to evaluate;
2. Recognizing that, even though they experience the same environment every day, managers have no clear goals. Asking them what their goals are for the context will generate misaligned responses that the managers themselves will question later. The process used has to recognize these limitations of knowledge and help managers to build their under
-standing according to their values and preferences;
3. The objectives contained in the PE model are the re
-sult not only of the values and preferences of man
-agers, but also of how they are influenced by the context in which they operate;
4. The construction of the PE model requires the con
-tinued participation of managers to ensure the con
-struction of their knowledge in terms of the problem and to ensure legitimacy;
5. To give foundation and validity to the measurements made; they need to meet the requirements of the Theory of Measurement;
6. The model should, in each of its stages of construc
-tion and use, have the recogni-tion of the manager in regard to the legitimacy of the constructed knowl
-edge and its explicit representation, as well as as
-surance that all the instruments used have scientific recognition (Lacerda et al., 2011; Ensslin et al., 2010; Bortoluzzi et al., 2011).
Additionally, it should be clear that Organizational Per
-formance Evaluation (OPE) is the management process used to build, establish and disseminate knowledge through the identification, organization, measurement and integration of necessary and sufficient aspects (variables) used to measure and manage the performance of the strategic objectives of a particular context of the organization (Ensslin, et al., 2010).
In this context, the question that guides this research is presented: Which variables should be considered in a model that aims to assess the performance of the productive oper
-ations of a furniture industry? To answer the research ques
-tion, we present the general objective of this work: to build a model of performance evaluation of the productive opera
-tions of the industrial company Marel Furniture Industry SA.
The work is situated in the area of Operational Research (OR) named Decision Aid (DA), focusing on evaluating the production area of the furniture branch of industry. Decision Aid is the activity that, in ways we call scientific, helps to ob
-tain elements that clarify decisions in order to provide actors with the most favorable conditions possible for the type of behavior that will increase coherence between the evolu
-tion of the process, on the one hand, and the goals and/ or systems values within which these actors operate, on the other (Roy, 1994). The contribution of this work to Opera
-tion Research is not in the mathematical area but in the op
the service of shedding light on managerial decisions and/ or of guiding complex processes within organized systems. When I speak of the DA-OR field, I am referring essentially to this project.”
Because it is a poorly structured context that needs to be considered in a personalized way in that the manager needs support to expand and organize his understanding to explain the goals that best represent their values and preferences, we used the Multicriteria Decision Aid Constructivist Meth
-odology (Bortoluzzi et al., 2010; Azevedo et al., 2011).
Besides this introduction, the paper presents the proce
-dures for model construction 2; the case study in section 3; and, lastly, the final considerations of the work.
2. PROCEDURES FOR MODEL CONSTRUCTION
The Productive Operational Management foundations were created in a positivist paradigm, having been devel
-oped through classical Operational Research (OR), searching for the optimal alternative from a set of previously defined alternatives. Roy (1994) says in regard to this situation:
First of all, this conception of OR tends to cut it off from the milieu which nourishes it and le -gitimates it as something other than a branch
of mathematics. Cutting off OR in this way en
-courages researchers to work in isolation. This results in naïve or impoverished references to
managerial reality and decision-making process
-es. Those responsible for solving concrete prob
-lems are thus inevitably disappointed by the gap between their own expectations and the results they receive. Secondly, this conception tends to lend validity to the notion that a scientific ap -proach to any problem dealt with in Operational
Research first consists of setting forth the prob
-lem correctly and, if possible, bringing it in line with the list of standard models, then of solving the problem, and finally, after a validation phase in some instances, of implementing the solution. Even in cases where this approach is relevant (and we can cite many examples where it has
proven to be fruitful), I believe that limiting Op
-erational Research in this way is to cripple it.
Therefore, it is necessary to analyze its paradigms more deeply in order to see how it fits with the practical Pro
-ductive Operational Management in which complexity, uncertainty, conflicts of interest and partial knowledge are present. This kind of analysis and questioning are vital for developing an understanding in terms of the right problem and a process that takes care of all its peculiarities (Roy,
1993; Landry, 1995).
Dvir et Lechler (2004) argue that Productive Operational Management analyzed in a positivist paradigm means noth
-ing in situations where the initial understand-ing is partial and complexity and uncertainty are present. While the tra
-ditional Operational Research (OR) view of Productive Op
-erational Management focuses on achieving performance following time and cost, the aims of the management are more focused on value for the actors involved, and therefore they are different problems.
A number of authors who use a theoretical approach based on the field of Productive Operational Management observe that the Decision Aid (DA) soft Operational Research (OR) approach has positive impacts on management when technological uncertainty is high (De Meyer et al., 2002), the long-term consequences are diffuse, the consequences are liable to be affected by external factors, the knowledge has to be developed, the management results in a huge change in the company or even in the market and the complexities of scope and the context of the management are high (At
-kinson et al., 2006).
These conditions represent the complex and ambiguous world that companies face on a daily basis in a more accurate way (Pich et al., 2002). Adequate approaches are needed to deal with such a reality, as the one proposed by Thiry (2002), who defends a constructivist and personalized position to support decisions about the definition of Productive Oper
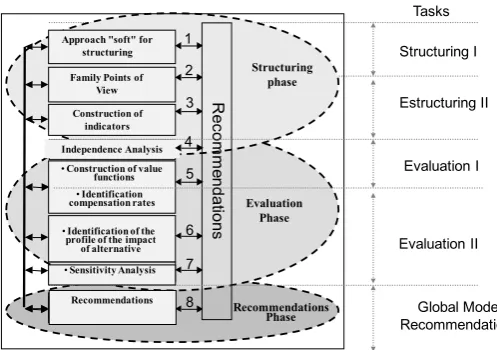
-ational Management. Bearing in mind these peculiarities and the context of Productive Operational Management, we conclude that the used of the MCDA-C, OR–DA approach as presented in Figure 1 is appropriate for dealing with Produc
-tive Operational Management.
The Multicriteria Decision Aid Constructivist Methodol
-ogy (MCDA-C), by taking into account the six paradigms of decision support provided in section 1, can be seen as ap
-propriate for carrying out the process of performance eval
-uation of the productive operations of the company Marel Furniture Industry SA.
Structuring I
Estructuring II
Evaluation I
Evaluation II
Global Model Recommendations
Approach "soft" for structuring
Family Points of View Construction of
indicators
•Construction of value functions
•Identification compensation rates
Formular Recomendações
•Identification of the profile of the impact of alternative
R
ec
om
m
en
dat
ions
Structuring phase
Evaluation Phase
Recommendations Phase
Independence Analysis
Análise do Resultado•Sensitivity Analysis
Análise do ResultadoRecommendations
Tasks 1
2
3
4 5
6
7
8
Figure 1. Flow of activities of the MCDA-C methodology
Source: Adapted from Ensslin et al., (2001)
2.1. Structuring Phase
Step 1: Contextualization Stage
The structuring phase aims to explain the context and build a level of understanding of the environment, which enables the problem and what is outside it to be delimited. The contextualization begins by identifying the decision con
-text in which the actors are present, that is, those who par
-ticipate, directly or indirectly, in the process in which man
-agement is performed. The actors in this process are: the decision-maker, the facilitator, the players and the affected people.
Subsequently, a label should be defined for the problem and its statement prepared. The label must contain the main focus of the work, indicate the purpose to be achieved and, finally, it should be built with a summary containing the following information: the problem;what raises the impor
-tance of the problem;the purpose of the work; what we propose to do in order to reach the goal and solve the prob
-lem and;what we hope to achieve by the end of the work (results).
This set of information constitutes the first step in the process of structuring using the MCDA-C methodology (En
-sslin et al., 2001).
Step 2: Value Hierarchic Structure
At this stage, the facilitator encourages the decision-mak
-er to talk about the context openly. This talk is recommend
-ed to be held with as few interruptions as possible. From
the talk, the facilitator compiles a set of information relating to the concerns and values of the decision-maker and the properties of the context. This information is called Primary Elements of Assessment (PEAs) (Bana e Costa et al., 1999).
This information represents the aspects deemed essen
-tial by the decision-maker and makes up part of the element set that substantiates the dimensions that he has in mind when assessing the context. It is, however, still in too sum
-marized a form. The next step thus is to expand this set of information to turn it into concepts. This is accomplished by encouraging the decision-maker to talk about it, preferen
-tially, which direction is sought with each one of the PEAs, as well as the consequence of not achieving this purpose.
Now there is a plethora of information in the form of pre
-ferred directions pursued in the context. This set of informa
-tion is now grouped by content or area of concern (Ensslin
et al., 2001). Each area of concern is then composed of a set of concepts. To expand the understanding of each one of these, a cognitive map is built (Eden, 1988). Each map is then broken down into its constituent clusters and this struc
-ture is transformed into a Value Hierarchic Struc-ture (Ensslin
et al., 2001; Keeney, 1992).
Step 3: Construction of Descriptors
The hierarchical structure of value represents, at its top, the strategic goals or strategic dimensions of the deci
-sion-maker for the context, which, in the MCDA-C method
-ology, are called Fundamental Points of View (FPV). Its lower branches explain the tactical functions and, below these, the operating activities.
The previous stage identified what needs to be mea
-sured. Now with the help of Cognitive maps we identify the properties of the context whose properties should be mea
-sured (Bana e Costa et al., 1999). Aiming to explain the pref
-erences of the decision-maker, in this built ordinal scale we must now specify the reference levels. The lower level will be denoted as neutral and the upper level as good (Ensslin et al., 2001). With this information, the process of building the qualitative understanding in the MCDA-C methodology is finished. Now the improvement of knowledge will take place with the introduction of more information to give greater accuracy or precision. This is achieved by transforming the obtained ordinal knowledge into cardinal knowledge.
Step 4: Independence Analysis
-ogy uses compensatory models to integrate its constituent parts and generate a global model. The MCDA-C compen
-satory models (Unique Synthesis Criterion Approach) re
-quire their compensation rates to be constant. In order for the compensation rates to be constant, the criteria must be preferentially independent. At this stage, the analysis of the independence of the ordinal and cardinal descriptors takes place (Ensslin et al., 2000).
The next step in the MCDA-C methodology is to transform the ordinal scales of descriptors into cardinal scales. The transformation requires the decision-maker to provide the difference of attractiveness between all the levels of the de
-scriptor. The numerical scale that meets all the differences of attractiveness is a possible value function for the criterion or point of view. Aiming to make the value functions compa
-rable, the neutral level of each criterion receives a score of zero, and the good level the score of one hundred.
2.2. The Evaluation Phase
The descriptors’ construction ends the structuring phase of MCDA-C (which forms the basis for the subsequent pro
-cedures in the construction of the multicriteria evaluation model). The descriptors are essential to clarify the mean
-ing of the FPVs, to make them more comprehensible and to avoid ambiguity. One can now proceed to the evaluation phase, which consists of the assessment of all the potential actions.
Various approaches to carrying out the evaluation of mul
-ticriteria methodologies can be used in this phase. Vincke (1992) divides these methodologies into three categories, namely: (i) Multiple Attribute Utility Theory; (ii) Outranking Methods; and, finally, (iii) Interactive Methods. Roy (1996) termed these methods: (i) the Unique Synthesis Criterion Approach; (ii) the Outranking Synthesis Approach; and, fi
-nally, (iii) the Interactive Local Judgement Approach, respec
-tively. In this paper, Roy’s terminology is used.
As the decision-makersidentify, in this specific case, that they agree that the decrease in the performance of any of the FPVs (criteria) can be compensated for by an increase in other FPVs, we realize that the most appropriate approach in this case is (i) the Unique Synthesis Criterion Approach. Thus, the overall evaluation is performed using an aggrega
-tion model, in which each variable FPV should have a value function defined as an interval of preference to avoid levels of excessive desirability as well as the opposed excessive re
-pulsiveness. In this way, the model is built and valid for this interval in each criterion. This function can be represented as follows:
(a))
.
(V
.
w
V(a)
n1
j j FPVJ
∑
==
where:
V(a) is the global punctuation (attractiveness) of a ÎA;
A is the set of all possible actions;
wj is the compensation rate for the criterion j, which al
-lows for the transformation of a unit of partial value accord
-ing to each FPVj into units of global value, for the established good and neutral interval;
(VFPVj (a)) is the impact indicator, which contains the local punctuation (attractiveness) of the actions of A, in relation to FPVj.
In this study, wj (j= 1, [...] n), where
∑
=>
=
n
1
j j j
0
w
and
1
w
For the FPVs to be compared, it is essential for the attrac
-tiveness and repulsiveness levels to be equivalent in all the FPVs. Thus, all the neutral and good levels must have the same partial value, hence:
=
=
0
)
(neutral
V
100
)
(good
V
j FPV
j FPV
j j
In a multicriteria methodological framework, the evalua
-tion basically consists of two stages as follows: “(1) the con
-struction of a criterion for each fundamental point of view, that is, an evaluation model that formally represents the lo
-cal attractiveness of potential actions for some evaluator(s) – single point of view evaluation, or local evaluation process; and (2) the application and exploration of a multicriteria ag
-gregation procedure that, taking into account some infor
-mation of inter-viewpoints’ nature, assembles the various criteria in an overall evaluation model – overall evaluation or aggregation process” (Bana e Costa et al., 1999).
Step 5. Building Value Functions
Some approaches have been proposed for the construc
-tion of the value func-tions, for example, “Direct Rating” (von Winterfield et Edwards, 1986), “Bisection” (Goodwin
This study is based on the MACBETH methodology (Mea
-suring Attractiveness by a Categorical Based Technique). Through its simplification, it can overcome the difficulties stemming from the questioning process. The actor just has to elaborate absolute judgements on theattractiveness dif-ference between two actions (Bana e Costa et al., 1999).
The MACBETH questioning procedure consists of asking the actor the following question: “Given the impacts ij(a) and ij(b) of two potential actions a and b of A according to a FPVj, ‘a’ being judged more attractive (locally) than ‘b’, is the attractiveness difference between ‘a’ and ‘b’: ‘indiffer
-ent’; ‘very weak’; ‘weak’; ‘moderate’; ‘strong’; ‘very strong’ or ‘extreme’?”.
During this questioning process, the analyst fills in a tri
-angular sub-matrix superior to the n × n matrix, according to the answers given by the actors from the semantic catego
-ries. Then MACBETH finds (by linear programming) the car
-dinal scale that best represents the actors’ absolute judge
-ments.
Step 6. Identification of the Compensation Rates
Various approaches have been proposed for the determi
-nation of the compensation rates, among them the classic “trade-off procedure” (Keeney, 1992), the “swing proce
-dure” (von Winterfield et Edwards, 1986) and MACBETH (Bana e Costa et al., 1999). Again, here, the MACBETH meth
-odology is used.
The determination of the compensation rates (wj) (that is, the normalized cardinal scale of the value judgement among the FPVs), is carried out in three different timescales. The first consists of identifying the alternatives (Figure 7). The second consists of orderingthe alternatives (Figure 8). The third consists of constructing the semantic matrix of value judgement (Figure 9) on the same basis as that used for the construction of the value functions. The only difference is the addition of a fictitious action with a neutral impact on every FPV, which will be used as an anchor (point 0 of the scale). These three timescales, ordering of the alternatives and construction of the semantic matrix will be discussed next (Figures 7, 8 and 9).
Step 7: Diagnosis and Status Quo (SQ)
The built knowledge now allows us to visualize numerical
-ly and graphical-ly the profile of the current situation and the consequences of actions to promote its improvement. The model built by C-MCDA methodology makes possible an ex
-plicit and reasoned evaluation, highlighting the strengths and weaknesses and thus the opportunities for improvement.
2.3. The Recommendations Phase
Step 8: Formulation of Recommendations
The knowledge generated allows the decision-maker to visualize graphically and numerically for each criterion whether the performance is “excellent”, “normal” or “com
-promising”. On the other hand, the scale gives him/her in
-formation on which of the performances is superior to the current one. This, combined with the decision-maker’s addi
-tional knowledge about the context, will enable him or her to identify actions to improve and predict the level at which the context will be if the performance is implemented.
Then, the model will inform the decision on the contribu
-tion to the criterion and to the global context. Thus, multiple actions can be generated and ranked in the order of contri
-bution. This phase is called the recommendation phase.
3. CASE STUDY
3.1. Structuring Phase
Step 1: Contextualization Stage
The researcher began by holding meetings with the indi
-vidual responsible for the company production area at Mar
-el Furniture Industry SA. The organization wanted a process through which to conduct substantial operational manage
-ment in a clear, reasoned and participative way, as perceived by the Director of Production. The subsequent interviews showed the following:
Chart 1. Actors involved in the performance problem of business operations
Decision-Maker Production Director
Intervenients Other directors
Facilitators Authors of the work
Affected Employees, suppliers, clients, financial institu
-tions and trade unions
Label: Performance Evaluation of the Production Opera
-tions of Marel SA Company.
Summary:
The person responsible for the Productive Operational Management wants to improve the performance accord
-cate such knowledge. This understanding is important for: achieving consistency in his decisions and actions; dissemi
-nating the knowledge of what is important; and being able to highlight the good and the bad results. Developing the knowledge of the decision-maker and presenting it in the form of a model is the objective of the decision-maker. Giv
-en the complexities of the context, the multiple actors with different powers and abilities and the conflicting interests of those involved, the MCDA-C methodology will be used.
As a result, the decision-maker hopes to build knowledge that allows him to define clearly what is important, with scales to measure the performance and compensation rates needed to establish an order of contribution and to show the strengths and weaknesses of the properties perceived as important by the decision-maker.
Step 2: Value Hierarchical Structure
Having legitimized the context, we continued with the process of interviews with the decision-maker.
We asked the decision-maker to identify the concerns in
-herent in the productive sector of the company. We tried to motivate the decision-maker to talk about all the aspects that he believed to be important, and reassured him that he should not worry about redundancy. In this case, the interviews with the decision-maker and the analysis of the strategic planning of the company produced 106 Primary El
-ements of Assessment (PEA).
Thus, Chart 2 below shows some of the Primary Elements of Assessment (PEA) identified in this step:
Chart 2. Examples of Primary Elements of Assessment (PEA)
1 – Fixed costs 5 – Partnership relations with suppliers
2 – Investments 6 – Loading management
3 – Time of raw material and
supplies 7 – Internal processes
4 – Machinery and equipment
with too much use time 8 – Lead time
Source: Research data.
Following this, the concepts oriented to action, were prepared with the decision-maker. In this process, each PEA undergoes an expansion of knowledge about the concerns previously mentioned in order to identify the direction of preference of each PEA and its psychological opposite. Each PEA was discussed with the decision-maker in order to build knowledge regarding which aspects should be considered in a model of performance evaluation of the productive opera
-tions of the company.
The concepts were obtained from the interviews with the decision-maker, when he was asked to speak in detail about each PEA. In Chart 3, are some samples of concepts oriented to action, where the ellipsis (...) should be read as “instead of” and corresponds to the psychological opposite.
Chart 3. Examples of concepts (objectives)
95 – Having a process of preventive maintenance… expecting the equipment or machinery to break down and undermine
productivity
131 – Seeking to improve the company productivity … failing to meet the market demand
132 – Seeking to upgrade the manufacturing park with new technologies ... using outdated technologies 141 – Seeking to improve the internal processes to improve
plant productivity... having low productivity
180 – Ensuring improvement in productivity through production management... and reduce plant productivity
181 – Seeking to improve productivity through reduced time for each batch... and reduce plant productivity
182 – Improving the production system for application to improve productivity... keeping inventories increasing financial
costs
Source: Research data.
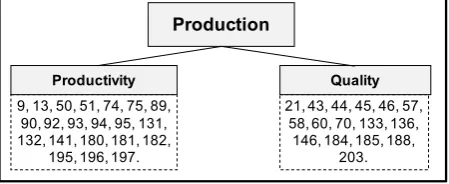
Each concept was built from a PEA and the speech of the decision-maker connecting the PEA to the Productive Opera
-tional Management. The examination of the set of concepts constructed allowed the decision-maker to group them into areas of concern in the production area, as shown in Figure 2:
9, 13, 50, 51, 74, 75, 89, 90, 92, 93, 94, 95, 131, 132, 141, 180, 181, 182,
195, 196, 197.
21, 43, 44, 45, 46, 57, 58, 60, 70, 133, 136,
146, 184, 185, 188, 203.
Production
Productivity Quality
Figure 2. Clusters of concepts in areas of concern in the production area FPV
Source: Research data.
It is noticeable that the scale “production” consists of two ar
-eas: productivity and quality. With the identification of Primary Elements of Evaluation, the preparation of the action-oriented concepts and the grouping of concepts, it is possible to start the next phase of the process of structuring the performance evaluation model, that is, the construction of cognitive maps and the tree of Fundamental Points of View (FPV).
This stage in the structuring phase consists of various steps, defined as: (i) the construction of the cognitive map; (ii) the construction of a family of Fundamental Points of View (FPVs); and (iii) the construction of descriptors (perfor
According to Bana e Costa et al. (1999), the first concern that the analyst is confronted with is to understand “what the problem is” from the perspective of the actors involved in a given situation. To aid this understanding, many tools have been developed by researchers in the field, which are able to represent schematically the construction of the problematic situation. In this study, the technique identified as the most appropriate was the cognitive map. There are many types of cognitive map (Fiol et Huff, 1992). This arti
-cle follows the cognitive mapping suggested by Eden et al., (1983) and Eden (1988) – depicting causal or influential re
-lations – for its adequacy in the structuring of multicriteria models.
Cognitive mapping involves several stages, the first being the establishment of a label for the problem. In the specific case of the present study, such a label is defined as “Perfor
-mance Evaluation of the Production Operation Management of Marel SA Co.”. The labelling of the problem is the start
-ing point of the mapp-ing. From this labell-ing, the technique
of brainstorming is utilized with a view to identifying those aspects felt to be relevant by the actors involved. The next stage is, then, the use of a question scheme (in this paper, Keeney’s (1992) scheme was used) through which a concept generates another concept, this new concept being the end concept. In the cognitive mapping, we assumed that the links between concepts only show an influence relationship (Cossette et Audet, 1992). This process continues until both those concepts found to be strategic and those concepts lia
-ble to be measured are identified.
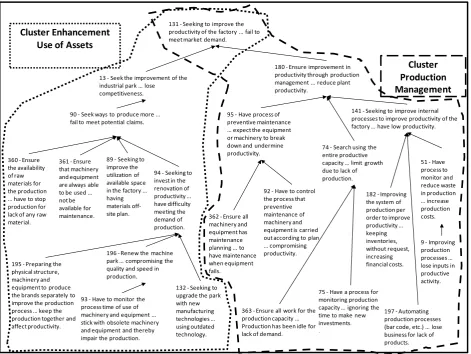
This procedure was used in this study, resulting in a map as presented for the dimension or area of concern “produc
-tivity”, as shown in Figure 3.
It is apparent that the “productivity” area map involves two clusters: the first related to aspects of “improvement of the assets’ use” and the second related to aspects of “pro
-duction management”.
Cluster Enhancement Use of Assets
Cluster Production Management 131 -Seeking to improve the
productivity of the factory ... fail to meet market demand.
13 -Seek the improvement of the industrial park ... lose competitiveness.
90 -Seek ways to produce more ... fail to meet potential claims.
89 -Seeking to improve the utilization of available space in the factory ... having materials off -site plan.
94 -Seeking to invest in the renovation of productivity ... have difficulty meeting the demand of production.
195 -Preparing the physical structure, machinery and equipment to produce the brands separately to improve the production process ... keep the production together and affect productivity.
196 -Renew the machine park ... compromising the quality and speed in production.
93 -Have to monitor the process time of use of machinery and equipment ... stick with obsolete machinery and equipment and thereby impair the production.
132 -Seeking to upgrade the park with new manufacturing technologies ... using outdated technology.
180 -Ensure improvement in productivity through production management ... reduce plant productivity.
95 -Have process of preventive maintenance ... expect the equipment or machinery to break down and undermine
productivity. 74 entire productive -Search using the capacity ... limit growth due to lack of production. 92 -Have to control
the process that preventive maintenance of machinery and equipment is carried out according to plan ... compromising productivity.
182 -Improving the system of production per order to improve productivity ... keeping inventories, without request, increasing financial costs.
75 -Have a process for monitoring production capacity ... ignoring the time to make new investments. .
141 -Seeking to improve internal processes to improve productivity of the factory ... have low productivity.
197 -Automating production processes (bar code, etc.) ... lose business for lack of products.
9 -Improving production processes ... lose inputs in productive activity. 51 -Have process to monitor and reduce waste in production ... increase production costs. 361 -Ensure
that machinery and equipment are always able to be used ... not be available for maintenance. 360 -Ensure
the availability of raw materials for the production ... have to stop production for lack of any raw material.
363 -Ensure all work for the production capacity ... Production has been idle for lack of demand.
362 -Ensure all machinery and equipment has maintenance planning ... to have maintenance when equipment fails.
Figure 3. Cognitive map of the productivity dimension
From the cognitive map it is possible to continue to the next structuring phase, that is, the building of the Hierarchi
-cal Structure of Value and also the construction of descrip
-tors.
In this stage of the structuring phase, the transition was made from the cognitive map to the Hierarchical Structure of Value and the construction of descriptors. An FPV is said to be operational when the impact of the “status quo” as well as every possible potential action can be measured in relation to it. Such an operational function is called a de
-scriptor of impact of the actions, according to Bana e Costa
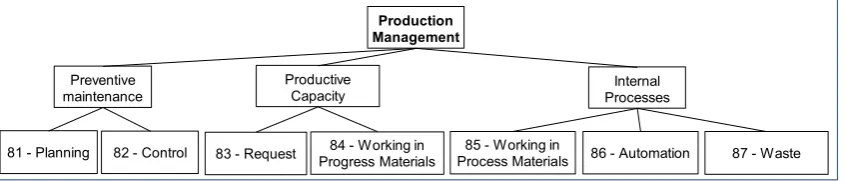
et al. (1999). On many occasions, for an FPV to become op
-erational, it is necessary to decompose it into Elementary Points of View (EPV); see Figure 4. These are merely the ex
-planation and detailing of the FPV with which they are asso
-ciated (Bana e Costa et al., 1999).
It is noteworthy that the descriptors and also the level of impact associated with them are built based on information in the cognitive maps. The opposite poles of the maps help us to define the lowest level of impact of a descriptor, and the present poles help us to define what the decision-mak
-er consid-ers to be the level of excellence. The Hi-erarchical Structure of Value and descriptors for the FPV “production management” are shown in Figure 4:
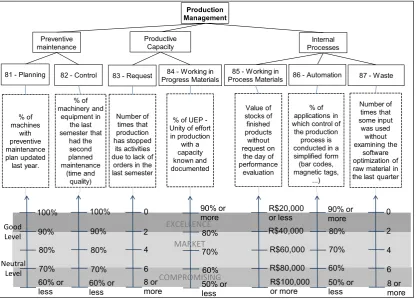
Step 3: Construction of Descriptors
Once the EPVs that comprise the FPV “production man
-agement” were explained, the construction of the de
-scriptors was initiated. To build the de-scriptors we sought information from the cognitive map in Figure 3, the cogni
-tive map of the productivity dimension. As a result the de
-scriptors presented in Figure 5 appeared. The Hierarchical Structure of Value of the FPV “production management” as presented in Figure 5 also shows the reference levels of each descriptor. The neutral and good levels have already been incorporated into this representation.
When a literature collation is carried out with the devel
-oped model, it is noticed that, in the structuring phase, the considerations of the manager and the operational proper
-ties are met. Value considerations explain the perception of the manager regarding how it contributes to the organiza
-tion’s strategic objectives, which are outside his control (Ka
-plan et Norton, 2000). Another element of the developed model, which can be checked at every structuring stage, is the consideration of the intangibles. The intangible aspects are deemed in the literature as essential in the current con
-text in which companies operate, since the only financial as
-pects are no longer responsive to the needs of the managers (Kaplan et Norton, 2000).
In addition to these elements, the developed model in
-cludes, in the construction of cognitive maps phase, the pos
-sibility of checking the alignment between the operational objectives and the goals considered as strategic by the orga
-nization. In the cognitive maps, it is possible to identify the cause and effect relationship between operational objectives and strategic goals. According to the papers that comprise the literature review, these aspects, which link strategy to operation and include the existing links, are of fundamental importance for the successful implementation of a system of performance evaluation (Kaplan et Norton, 2000).
In the context of the present study, given the character
-istics of the Production Operation Management (described above), the decision-maker was now interested in identify
-ing two basic additional issues: (i) the Production Operation Management’s individual profile, with the purpose of identi
-fying actions to improve the performance; and (ii) the global performance profile, to enable the ordering of the generat
-ed improvement actions. These can both be achiev-ed via an evaluation process, described below.
This step in the structuring also contributed to improving the communication among the decision-actors and it was fruitful for the later design of strategic actions.
Step 4: Independence Analysis
In order to achieve a cardinal local and global evaluation the qualitative scales of the descriptors must be transformed into cardinal scales and then integrated. The MCDA-C uses a compensatory model to build the global evaluation model.
Production Management
Preventive
maintenance Productive Capacity ProcessesInternal
85 - Working in
Process Materials 86 - Automation 87 - Waste 81 - Planning 82 - Control 83 - Request Progress Materials84 - Working in
Figure 4. Value Hierarchical Structure for the FPV “production management”
This model assumes that the conversion rates used in the in
-tegration are constant. To achieve this condition, the criteria must be independent (Ensslin et al., 2010).
All the criteria were analyzed to check whether preferen
-tial independence exists in the interval established by the neutral and good levels (Ensslin et al., 2001).
3.2. The Evaluation Phase
The evaluation phase is carried out by taking the follow
-ing steps: (i) the construction of value functions for each Elementary Point of View (EPV), (ii) the determination of re
-placement rates and (iii) the completion of the global evalu
-ation and impact profile of the status quo.
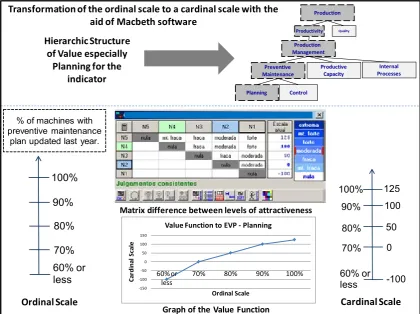
Step 5: Value Functions
This first step consists of transforming the ordinal scales into cardinal scales; this can be performed by identifying through the judgement of the decision-makers the differ
-ence terms of in attractiveness between all the levels of de
-scriptors. This step is performed with the help of the Mac
-beth software, which constructs a value function for each descriptor. We note that the value functions are based on
anchoring levels: 100 points (good level) and 0 points (neu
-tral level). This process is illustrated in Figure 6.
From the identification of cardinal scales, the deci
-sion-maker understands the difference in terms of attrac
-tiveness between moving from one impact level to anoth
-er for each p-erformance indicator. Howev-er, such a set of information alone is not sufficient to accomplish the global evaluation of performance. Thus, we sought to determine the compensation’s rates through the decision-maker’s per
-ception, as discussed below.
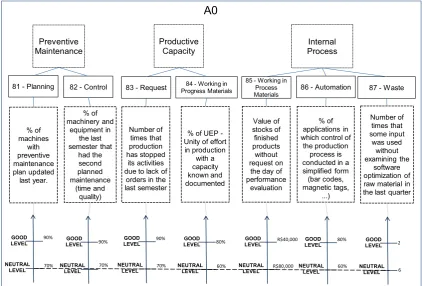
Step 6: Compensation Rates
Compensation rates will allow the additive aggregation of criteria, enabling the global evaluation of performance. To calculate the compensation rates, fictitious potential ac
-tions are created, which represent the contribution of the transition from the neutral level to the good level in each of the criteria as well as a reference action with neutral perfor
-mance for all the points of view, as shown in Figure 7:
Production Management
Preventive
maintenance Productive Capacity ProcessesInternal
85 - Working in
Process Materials 86 - Automation 87 - Waste 81 - Planning 82 - Control 83 - Request Progress Materials84 - Working in
% of machines
with preventive maintenance plan updated last year.
100% 90% 80% 70% 60% or less
% of machinery and
equipment in the last semester that
had the second planned maintenance
(time and quality)
100% 90% 80% 70% 60% or less
Number of times that production has stopped
its activities due to lack of
orders in the last semester
0 2 4 6 8 or more
% of UEP -Unity of effort in production
with a capacity known and documented
90% or more
80% 70% 60% 50% or less
Value of stocks of finished products
without request on
the day of performance
evaluation
R$20,000 or less R$40,000
R$60,000 R$80,000 R$100,000 or more
% of applications in which control of the production
process is conducted in a simplified form (bar codes, magnetic tags,
...)
90% or more
80% 70% 60% 50% or less
Number of times that some input
was used without examining the
software optimization of raw material in the last quarter
0 2 4 6 8 or more
Good Level
Neutral Level
EXCELLENCE MARKET
COMPROMISING
Figure 5: Value hierarchic structure and descriptors for the FPV “production management”
Transformationof the ordinal scale to a cardinal scale with the aid of Macbeth software
Graph of the Value Function
Ordinal Scale Cardinal Scale
Hierarchic Structure of Value especially
Planning for the indicator
% of machines with preventive maintenance
plan updated last year.
100%
90%
80%
70% 60% or less
100% 90% 80% 70%
60% or less
125 100 50 0
-100
Matrix difference between levels of attractiveness
Production
Productivity Quality
Preventive
Maintenance ProductiveCapacity Production Management
Internal Processes Planning Control
-150
-100
-50 0 50
100 150
60% or
less 70% 80% 90% 100%
Ca
rd
in
al
S
ca
le
Ordinal Scale Value Function to EVP - Planning
Figure 6: Illustration of the transformation of an ordinal scale to a cardinal scale (value function)
Source: Research data.
Preventive
Maintenance ProductiveCapacity ProcessInternal
A1
81 - Planning 82 - Control
% of machines
with preventive maintenance plan updated last year.
% of machinery and
equipment in the last semester that
had the second planned maintenance
(time and quality)
83 - Request Progress Materials84 - Working in
Number of times that production has stopped
its activities due to lack of
orders in the last semester
% of UEP -Unity of effort in production
with a capacity known and documented
85 - Working in
Process Materials 86 - Automation 87 - Waste
Value of stocks of finished products
without request on
the day of performance
evaluation
% of applications in which control of the production
process is conducted in a simplified form (bar codes, magnetic tags,
...)
Number of times that some input
was used without examining the
software optimization of raw material in the last quarter
GOOD LEVEL
NEUTRAL LEVEL
90%
70% GOOD LEVEL
NEUTRAL LEVEL
90%
70% GOOD LEVEL
NEUTRAL LEVEL
90%
70%
GOOD LEVEL
NEUTRAL LEVEL
80%
60%
GOOD LEVEL
NEUTRAL LEVEL
R$40,000
R$80,000 GOOD LEVEL
NEUTRAL LEVEL
80%
60%
GOOD LEVEL
NEUTRAL LEVEL
2
Preventive
Maintenance ProductiveCapacity ProcessInternal
A2
81 - Planning 82 - Control
% of machines with preventive maintenance plan updated last year. % of machinery and equipment in the last semester that had the second planned maintenance (time and quality)
83 - Request Progress Materials84 - Working in
Number of times that production has stopped
its activities due to lack of
orders in the last semester
% of UEP -Unity of effort in production
with a capacity known and documented
85 - Working in Process
Materials 86 - Automation 87 - Waste
Value of stocks of finished products without request on
the day of performance
evaluation
% of applications in which control of the production
process is conducted in a simplified form (bar codes, magnetic tags, ...) Number of times that some input was used without examining the software optimization of raw material in the last quarter
GOOD LEVEL NEUTRAL LEVEL 90% 70% GOOD LEVEL NEUTRAL LEVEL 90% 70% GOOD LEVEL NEUTRAL LEVEL 90% 70% GOOD LEVEL NEUTRAL LEVEL 80% 60% GOOD LEVEL NEUTRAL LEVEL R$40,000 R$80,000 GOOD LEVEL NEUTRAL LEVEL 80% 60% GOOD LEVEL NEUTRAL LEVEL 2 6 Preventive
Maintenance ProductiveCapacity ProcessInternal
A3
81 - Planning 82 - Control
% of machines with preventive maintenance plan updated last year. % of machinery and equipment in the last semester that had the second planned maintenance (time and quality)
83 - Request Progress Materials84 - Working in
Number of times that production has stopped
its activities due to lack of
orders in the last semester
% of UEP -Unity of effort in production
with a capacity known and documented
85 - Working in Process
Materials 86 - Automation 87 - Waste
Value of stocks of finished products without request on
the day of performance
evaluation
% of applications in which control of the production
process is conducted in a simplified form (bar codes, magnetic tags, ...) Number of times that some input was used without examining the software optimization of raw material in the last quarter
Preventive
Maintenance ProductiveCapacity ProcessInternal
A0
81 - Planning 82 - Control
% of machines
with preventive maintenance plan updated last year.
% of machinery and
equipment in the last semester that
had the second planned maintenance
(time and quality)
83 - Request Progress Materials84 - Working in
Number of times that production has stopped
its activities due to lack of
orders in the last semester
% of UEP -Unity of effort in production
with a capacity known and documented
85 - Working in Process
Materials 86 - Automation 87 - Waste
Value of stocks of finished products
without request on
the day of performance
evaluation
% of applications in which control of the production
process is conducted in a simplified form (bar codes, magnetic tags,
...)
Number of times that some input
was used without examining the
software optimization of raw material in the last quarter
GOOD LEVEL
NEUTRAL LEVEL
90%
70% GOOD LEVEL
NEUTRAL LEVEL
90%
70% GOOD LEVEL
NEUTRAL LEVEL
90%
70%
GOOD LEVEL
NEUTRAL LEVEL
80%
60%
GOOD LEVEL
NEUTRAL LEVEL
R$40,000
R$80,000 GOOD LEVEL
NEUTRAL LEVEL
80%
60%
GOOD LEVEL
NEUTRAL LEVEL
2
6
Figure 7. Potential alternatives for determining the compensation rates indicating the respective neutral and good levels
Source: Research data.
The first step in calculating the substitution rates con
-sists of ranking the alternatives through the array of Rob
-erts (1979), which consists of asking the decision-maker his or her preference between alternatives. This can be seen in Figure 8:
A1 A2 A3 A0 SOMA ORDEM
A1 0 0 1 1 3°
A2 1 1 1 3 1°
A3 1 0 1 2 2°
A0 0 0 0 0 4°
Figure 8: Roberts’s array representing the contribution of the alternatives to moving from the neutral level to the good in each
viewpoint considered
Source: Research data.
Subsequently, the information held in the hierarchy above is inserted and the decision-maker is asked to consider pairs of potential actions. This step can be seen in Figure 9:
This procedure was performed for every model of perfor
-mance evaluation and, as a result of these considerations, compensation rates that reflect the perceptions and values of the decision-maker were obtained. Figure 10 shows the eval
-uation model for the FPV “production management” with the compensation rates and the profile of the status quo.
A2 A3 A1 A0 CURRENT SCALE A2 no weak moderate very strong 50.00 A3 no weak moderate 33.00
A1 no weak 17.00
A0 no 0.00
Figure 9: Compensation rates generated by the M-MACBETH software comparing the difference in terms of attractiveness
between the alternatives
Source: Research data.
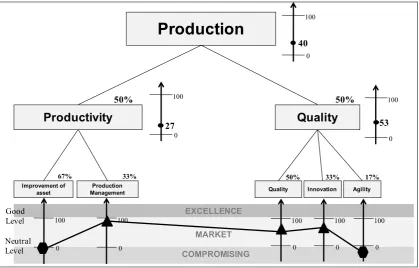
Step 7: Current Situation of the Status Quo (SQ)
Global Evaluation, Impact Profile and Assessment of the Status Quo
The current situation presented a performance of 40 points for the scale constructed, and therefore was regarded as competitive as perceived by the decision-maker. The eval
-uation and graphical representation are shown in Figure 11.
Figure 11 shows, in this way, the consequences of the current situation for those aspects deemed by the deci
Production Management
Preventive
maintenance Productive Capacity ProcessesInternal
85 - Working in Process
Materials 86 - Automation 87 - Waste 81 - Planning 82 - Control 83 - Request Progress Materials84 - Working in
% of machines
with preventive maintenance plan updated last year.
125 100 50 0 -100
% of machinery and
equipment in the last semester that
had the second planned maintenance
(time and quality)
125 100 50 0 -100
Number of times that production has stopped
its activities due to lack of
orders in the last semester
125 100 67 0 -133
% of UEP -Unity of effort
in production with a capacity known and documented
133 100 67 0 -133
Value of stocks of finished products without request on
the day of performance
evaluation
140 100 60 0 -60
% of applications in which control of the production process is conducted in a simplified form (bar codes, magnetic tags,
...)
112 100 62 0 -125
Number of times that some input was used
without examining the
software optimization of raw material in the last quarter
122 100 67 0 -133
Good Level
Neutral Level
17% 50% 33%
25% 75% 80% 20% 17% 50% 33%
EXCELLENCE
MARKET
COMPROMISING 92
100 120 45
Figure 10: Value hierarchic structure and status quo for the FPV “production management”
Source: Research data.
Production
Productivity
Quality
Improvement of
asset ManagementProduction Quality Innovation
50% 50%
67% 33% 50% 33% 17%
Good Level
Neutral Level
100
0
EXCELLENCE
MARKET COMPROMISING
100
0
100
0
100
0
100
0
Agility 27
100
0
100
0
40
53
100
0
Figure 11. Impact profile of the status quo and identifying strengths and weaknesses of the production
Source: Research data.
industry operating system. Additionally, it shows the points at the market level and the weak points.
Figure 11 presents the evaluation of the current perfor
-mance of the productive operations of Marel Furniture In
-dustry SA, as well as the impact profile of the status quo.
The overall evaluation of 40 points is formed by the sum of each FPV. Thus, the overall equation of the FPV model is shown below:
In the equation, the constants are the results of the prod
-uct of the rates in the rising chain, i.e. the first value 0.3350 corresponds to 0.67 * 0.50, and so on.
Thus, for each FPV, we will have a model in the form of Equation 5:
∑
=
•
=
kk
n
i ik ik
PVF
a
w
v
a
V
1 , ,
)
(
)
(
For the FPV2 used in the illustrations, we will have:
With the completion of the evaluation phase of the model, the decision-maker could evaluate in a graphical and numeric form the impact profile of the status quo and the proposed al
-ternatives to improve the overall performance. The conditions are perceived by him as essential to the Production Operation Management. The models constructed by the MCDA-C meth
-odology make possible an explicit evaluation in numerical and/ or graphic form, facilitating the identification and understand
-ing of the intensity of the strong as well as the weak points of the alternatives under evaluation. In the steps of the evaluation phase, the particularities of the productive operations of the company Marel Furniture Industry SA were taken into account through the decision-maker’s perception of the company.
4.3. Recommendation Phase
Step 8: Formulation of Recommendations
The recommendation phase allows strategies to be built that can improve the company performance, in accordance
with the decision-maker’s perception. Accordingly, through the interaction between the decision-maker and the facili
-tator, and by reading the status quo established in the eval
-uation phase, we decided to create strategies that facilitate the raising of performance of the productive operations of the company.
In this context, we identified the tactical objectives (man
-agement) and operational objectives that are performed below the neutral level and also those for which the perfor
-mance is at the market level, but for which the decision-mak
-er believes improvement strategies should be developed. Also, we sought to prioritize the goals with a greater con
-tribution to the overall performance through compensation rates.
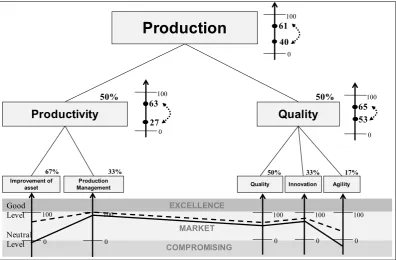
With the successful implementation of the strategy, the company Marel Furniture Industry SA would achieve better performance in terms of productive operations if the overall performance changed from 40 points to 61 points, as can be seen in Figure 12.
It uses the PE model to develop strategies to improve and develop recommendations for the company to achieve supe
-rior performance. This can be accomplished in several ways: (i) identifying the performance of each indicator to meet a specific performance for a given variable, (ii) establishing dif
-ferent strategies to identify the impact on the overall evalua
-tion of performance, (iii) analyzing the cost versus the bene
-fit of implementing a strategy, (iv) prioritizing the strategies and actions intended to be implemented by means of the goals with higher contribution rates (compensation) and (v) evaluating the performance at every level (strategic, tactical and operational).
It is noted that the recommendations phase is aligned with the theoretical affiliation of the evaluation of organi
-zational performance, because it can lead the performance management in the strategic, tactical and operational levels, based on the strengths and weaknesses, and suggests ac
-tions for improvement (Ensslin, et al., 2010).
4. CONCLUSIONS
The objective of this work was to construct a perfor
-mance evaluation model to support a production director in the management of the productive operations of a furni
-ture industry. The contribution of this work was to the Op
-eration Research field, not in the mathematical area but in its operational field named Decision Aid, putting science in the service of shedding light on managerial decisions and guiding the complex processes within organized systems. With these concepts in mind the research aimed at con
production director in the management of the productive operations of a furniture industry, through (i) the identifi
-cation of factors considered important by the production director for evaluating the performance of the productive operations, (ii) the measurement of each criterion for per
-formance evaluation, (iii) the integration of the criteria to enable performance evaluation at the tactical and strategic levels and (iv) the management of the improvement ac
-tions of productive opera-tions.
The results indicate that it was possible to develop a model of performance evaluation for the particular pro
-ductive operations of Marel Furniture Industry SA through the Multicriteria Methodology for Constructivist Decision Support (MCDA-C). The model identified 27 performance indicators (2 financial indicators and 25 non-financial in
-dicators) that allowed the performance evaluation of the productive operations of the industry. The constructed indicators evaluated the following fundamental points of view: productivity and quality. The main aspects evaluated in relation to productivity were the improvement of assets and production management. With regard to quality, the aspects evaluated were quality, innovation and agility. It is worth noting that these classifications are groups from concepts oriented differently to action, thereby achieving the first specific objective of this research.
Revisiting the specific objective (ii) – building ordinal and cardinal scales for the identified indicators – reference is made to Figures 5, 6 and 7, which allow the visualization of the scales. The scope of the specific objective (iii) – to trace the performance profile and evaluate the local and global performance – can be seen in Figure 11. From the constructed model, and illustrated by Figure 11, it was pos
-sible to identify the indicators that need improvement ac
-tions, thereby achieving the specific objective (iv). It is noted that, within the scope of specific objective (iv), developed in the recommendations phase, strategies were drawn up that might make the performance pass from the status quo to su
-perior performance after implementing the strategy. At this stage, we used the information and knowledge generated during the construction of the model to support the poli
-cy inherent in the productive operation of the organization. The illustration of this step can be seen in Figure 12.
In short, the research allowed the construction of a performance evaluation model to support the production director in the management of productive operations of Marel Furniture Industry SA, which was constructed show
-ing the particularities of the object of the studied company. With the model, the manager will be able to manage the productive operations at the strategic, tactical and opera
-tional levels.
Production
Productivity
Quality
Improvement of
asset ManagementProduction Quality Innovation
50% 50%
67% 33% 50% 33% 17%
Good Level
Neutral Level
100
0
EXCELLENCE
MARKET
COMPROMISING
100
0
100
0
100
0
100
0
Agility 27
100
0
63
100
0
40 61
53
100
0
65
Figure 12: Impact profile of the status quo of the area of products and the profile impact after strategy deployment
Source: Research data.
The constructed PE model permits the construction, es
-tablishment and dissemination of knowledge through the identification, organization, measurement and integration of the aspects of the productive context deemed relevant to measure and manage the performance of the organiza
-tion goals.
It is worth mentioning that the model has legitimacy for the studied company, because the values and pref
-erences of the director of the production company were considered and therefore the particular strategies of the organization.
We suggest for further research the application of the MCDA-C tool to other companies, in order to consolidate it as a viable PE methodology for productive operations.
REFERENCES
Atkinson, R., Crawford, L. and Ward, S. (2006), “Fundamen
-tal uncertainties in projects and the scope of project manage
-ment”, International Journal of Project Management, Vol. 24 No. 8, pp. 687-698.
Azevedo, R.C.; Ensslin, L; Lacerda, R.T.O.; França, L.A.; Gon
-zalez, C.J.I.; Jungles, A.E and Ensslin, S.R. (2011), “Avaliação de Desempenho no Processo de Orçamento de uma Obra de Construção Civil”, Ambiente Construído (Online), Vol. 11 No.1, pp. 85-104, 2011.
Baldwin, J.S., Allen, P.M. and Ridgway, K. (2010), “An evolu
-tionary complex systems decision-support tool for the mana
-gement of operations”, International Journal of Operations & Production Management, Vol. 30 No 7, pp. 700-720.
Bana e Costa, C.A., Ensslin, L., Correa, E.C. and Vansnick, J.-C. (1999), “Decision aiding systems in action: integrated application in a multicriteria decision aid process”, European Journal of Operational Research, Vol. 113 No. 2, pp. 315-335.
Bortoluzzi, S.C., Ensslin, S.R. and Ensslin, L. (2010), “Avalia
-ção de Desempenho dos Aspectos Tangíveis e Intangíveis da Área de Mercado: estudo de caso em uma média empresa in
-dustrial”, RBGN Revista Brasileira de Gestão de Negócios, Vol. 12 No. 37, pp. 425-446.
Bortoluzzi, S.C., Ensslin, S.R. and Ensslin, L. (2011), “Ava
-liação de Desempenho Multicritério com Apoio à Gestão de Empresas: aplicação em uma empresa de serviços”, Revista Gestão & Produção, Vol. 18 No. 3, pp. 633-650.
Cossette, P. and Audet, M. (1992), “Mapping of an idiosyn
-cratic schema”, Journal of Management Studies, Vol. 29 No. 3, pp. 325-348.
Da Rosa, F.S., Ensslin, S.R, Ensslin, L. and Lunkes, R.J. (2012), “Environmental disclosure management: a constructivist case”, Management Decision, Vol. 50 No. 6, pp. 1117-1136.
De Meyer, A., Loch, C.H. and Pich, M.T. (2002), “Managing project uncertainty: From variation to chaos”, MIT Sloan Ma
-nagement Review, Vol. 43 No. 2, pp. 60-67.
Dvir, D. and Lechler, T. (2004), “Plans are nothing, changing plans is everything: the impact of changes on project success”, Research Policy, Vol. 33 No. 1, pp. 1-15.
Eden, C. “1988”, “Cognitive mapping”, European Journal of Operational Research, Vol. 36 No. 1, pp. 1-13.
Eden, C., Jones, S. and Sims, D. (1983), Messing about in problems, Pergamon Press, New York, NY.
Ensslin, L., Dutra, A. and Ensslin, S.R. (2000), “MCDA: a construtivist approach to the management of human resour
-ces at a governmental agency”, International Transactions in Operational Research, Vol. 7 No. 1, pp. 79-100.
Ensslin, L., Giffhorn, E., Ensslin, S.R., Petri, S.M. and Vianna, W.B. (2010), “Avaliação do Desempenho de Empresas Tercei
-rizadas com o Uso da Metodologia Multicritério de Apoio à Decisão- Construtivista”, Revista Pesquisa Operacional, Vol. 30 No. 1, pp. 125-152.
Ensslin, L., Montibeller, G.N. and Noronha, S.M. (2001), Apoio à Decisão: Metodologias para Estruturação de Proble
-mas e Avaliação Multicritério de Alternativas, Ed. Insular, Flo
-rianópolis, SC.
Fiol, C.M. and Huff, A.S. (1992), “Maps for managers: whe
-re a-re we? Whe-re do we go from he-re?”, Journal of Manage
-ment Studies, Vol. 29 No. 3, pp. 267-286.
Frost, B. (1999), Performance Metrics: The New Strategic Discipline, Strategy & Leadership, Chicago.
Goodwin, P. and Wright, G. (1998), Decision Analysis for Management Judgment. John Wiley & Sons, Chichester.
Gupta, Y.P. and Somers, T.M. (1996), “Business strategy, manufacturing flexibility, and organizational performance re
-lationships: a path analysis approach”, Production and Opera
-tions Management, Vol. 5 No. 3, pp. 204-233.
Hopp, W.J., Iravani, S.M. and Shou, B. (2007), “A Diagnostic Tree for Improving Production Line Performance”, Production and Operations Management, Vol. 16 No. 1, pp. 77-92.
Kaplan, R.S. and Norton, D.P. (2000), “Having trouble with your strategy? Then map it”, Harvard Business Review, Vol. 78 No 5, pp. 167-176.
Keeney, R.L. (1992), Value Focused-Thinking: A Path to Creative Decision-making, Harvard Univ. Press, Cambridge.
Lacerda, R.T.O., Ensslin, L. and Ensslin, S.R. (2011), “A per
-formance measurement framework in portfolio manage
-ment: a constructivist case”, Management Decision, Vol. 49 No. 4, pp. 648-668.
-ticism and the Growth of Knowledge, Cambridge Uni versity Press. Cambridge.
Landry, M.A. (1995), “Note on the Concept of ‘Problem”, Organization Studies, Vol 16 No. 2, pp. 315-343.
Lima, E.P., Costa, S.E.G., and Angelis, J.J. (2008), “Framing Operations and Performance Strategic Management System Design Process”, Brazilian Journal of Operations & Production Management, Vol. 5 No. 1, pp. 23-46.
Pich, M.T., Loch, C.H. and Meyer, A.D. (2002), “On uncer
-tainty, ambiguity, and complexity in project management”, Management Science, Vol. 48 No. 8, pp. 1008-1023.
Quezada, L.E., Córdova, F., Palominos, P. and O’Brien, C. (2006), “Conceptual Model for the Generation of Perfor
-mance Measures in Manufacturing Firms”, Brazilian Jour
-nal of Operations & Production Management, Vol. 3 No. 2, pp. 21-34.
Roberts, F.S. (1979), Measurement Theory. In: ROTA, G. C. (Ed.) Encyclopedia of mathematics and its applications, v. 7, Addison-Wesley Publishing Company, London.
Roy, B. (1993), “Decision science or decision-aid science?” European Journal of Operational Research, Vol. 8 No. 1, pp. 184-203.
Roy, B. (1994), “On operational research and decision aid”, European Journal of Operational Research, Vol. 73 No. 1, pp. 23-26.
Roy, B. (1996), Multicriteria Methodology for Decision Ai
-ding. Kluwer Academic Pub, Dordrecht.
Thiry, M. (2002), Project Management Pathways; Univer
-sity of Technology Sidney.