Rani et al. World Journal of Pharmaceutical and Medical Research
ANALYTICAL METHOD DEVELOPMENT AND VALIDATION OF ZOFIRLUKAST IN
FORMULATION BY RP-HPLC
B. Roopa Rani*, Dr. Ch. M. M. Pradada Rao, D. Dhachinamoorthi
Department of Pharmaceutical analysis & Quality Assurance, QIS college of Pharmacy, Ongole-523272.
Article Received on 07/02/2018 Article Revised on 28/02/2018 Article Accepted on 21/03/2018
INTRODUCTION
Zafirlukast is an oral leukotriene receptor antagonist (LTRA) for the maintenance treatment of asthma, often used in conjunction with an inhaled steroid and/or long-acting bronchodilator. It is available as a tablet and is usually dosed twice daily. Another leukotriene receptor antagonist is montelukast (Singulair), which is usually taken just once daily. Zafirlukast blocks the action of the cysteinyl leukotrienes on the CysLT1 receptors, thus reducing constriction of the airways, build-up of mucus in the lungs and inflammation of the breathing passages. The chemical structures of the assayed compounds are given below.
Fig. 1: Chemical structures of Zofirlukast.
The proposed method was optimized and validated in accordance with International Conference on Hormonization (ICH) guidelines.[12,13,14] The aim of present work is to develop a simple, rapid, precise, accurate and selective reversed phase chromatographic method and to estimate the ZOFIRLUKAST in bulk and its solid dosage forms.
MATERIALS AND METHODS
Zafirlukast was procured from sipra laboratories limited, Hyderabad, India. For the mobile phase preparation and degradation studies, HPLC-grade of acetonitrile, methanol and AR grade of sodium hydroxide, hydrochloric acid, hydrogen peroxide and formic acid were purchased from Rankem (Mumbai, India). HPLC-grade of tetrahydro furan was procured from Qualigens (Germany). AR grade of ammonium formate was used from Sigma Aldrich (St Louis, USA). Millipore purified water (Milli Q plus purification -Bangalore, India) was used to prepare mobile phase and washing solvents.
Instrumentation
The method development attempts, forced degradation studies and the method validation were performed in Agilent 1100 series LC systems with a diode array and variable wave length detectors (Agilent Technologies, Waldbronn, Germany). The photolytic degradation was carried out using Binder KBS240 photolytic chamber (New York, USA). The peak homogeneity was studies in Agilent LCMS 6410 QqQ instrument (California, USA). The data were collected and processed using chemstation software.
5.2.3. Sample preparation
Zafirlukast solution was prepared at target analyte concentration (TAC) which is 250 μg mL-1 in the diluent for assay determination. A stock solution prepared in
ISSN 2455-3301
WJPMR
AND MEDICAL RESEARCH
www.wjpmr.com
*Corresponding Author: B. Roopa Rani
Department of Pharmaceutical analysis & Quality Assurance, QIS college of Pharmacy, Ongole-523272.
ABSTRACT
A new gradient reverse Phase High Performance Liquid chromatographic method development for the determination of Zofirlukast tablet dosage form. The chromatographic separation was achieved on a Thermo Zorbax SB C8,150×4.6mm,5µ, column within a runtime of 6.074 min under gradient elution by a mixture of buffer and acetonitrile and water at at 75:25 at flow rate of 0.8ml/min. A photodiode array (PDA) detector set at 238 nm was used for detection. The spectrophtometric method was developed for the Zofirlukast at uv cut of range of 200-400nm here the absorption max was shown at 238 nm. The method was validated according to the ICH guidelines with respect to specificity, precision, accuracy and linearity, and showing satisfactory data for all the method validation parameters tested. The % RSD for peak area response was found to be within the limit. The proposed method was found to be reproducible and convenient for the analysis of Zofirlukast, the method can be used for routine quality control analysis
diluent for the preparation of system suitability solution with 0.15 %w/w (specification level) of each impurity at TAC of zafirlukast.
Method development
The core objective of the current studies is to develop the chromatographic method with zafirlukast in short run time. There has been a huge interest recently on high throughput chromatographic separations for pharmaceutical applications using sub 2-micron with 50 or 30 mm columns (15). Considering the fact that there has not been any single LC method reported with short analysis time and LCMS compatibility for the separation and quantitation of zafirlukast, we have developed a reverse-phase LC method with 15 minutes analysis time.
Optimization of chromatographic conditions
The method was developed using Zorbax SB C8 which provides good selectivity over impurities with better peak shapes with 20 mM ammonium formate buffer adjusted the pH with formic acid. Zafirlukast is having good responses at 210 to 240 nm and then 280 to 320 nm. The detection wavelength (238 nm) was chosen considering the impurities peak-signal and non-drifting baseline as well. The relative response factor (RRF) of the potential impurities is close to unit. RRF of degradants were considered to be one, which was supported by the mass balance to a good extend. Initial effort for the method development was made in ammonium acetate and acetonitrile as a mobile phase in ODS column with 150 mm of length. Buffer concentration with 20 mM ammonium acetate gives better peak shapes than 10 mM ammonium acetate; however the run time was observed to be long. Less than 3 μm particle size columns - Shimpak XR, Zorbax SB C18 and C8 were used for screening so as to reduce the run time. Zorbax SB C8 with the dimension of 50 mm x 2.1 mm and 1.8 μm as particle size was chosen for its better peak shape and for the acceptable resolution of critical pairs. Addition of methanol in acetonitrile leads to reduction in the resolution of isomers. Different pH was screened by adjusting the pH of mobile phase A using acetic acid. Optimum resolution was observed at pH 4.4. Changing the mobile phase-A to 20 mM ammonium formate adjusted the pH to 4.4 with formic acid provided sharper peaks when compared with ammonium acetate. Other modification in mobile phase B, column temperature, and stationary phases did not show any improvement on the method. It is evident that the separation of positional isomers of zafirlukast was more dependent on pH.
Fig. 2: UV overlay spectra of Zofirlukast. Calibration Curves for Zofirlukast
A calibration curve was plotted as concentration Vs
absorbance and the corresponding linearity range was given for the selected absorption maxima. Zofirlukast was found to be linear in the concentration range of 50-150 μg/ml at 238 nm The data for the absorbance of Zofirlukast drugs are given in Tabulated and figured
Table 1: Linearity of Zofirlukast. S.
No.
Concentration in µg/ml
Zofirlukast Absorbance at 238nm
1. 0 0
2. 2 0.146
3. 4 0.292
4. 6 0.438
5. 8 0.584
6. 10 0.734
Slope: 0.0732 Intercept: -0.000762
Correlation Coefficient:0.999
METHODOLOGY Method Validation System Suitability
The method was validated for parameters such as linearity, precision, accuracy, specificity and robustness. In the optimized conditions it was observed that the zafirlukast, were well separated with a resolution greater than 1.8. Also the capacity factor, theoretical plates on tangent method and the USP tailing of each peak were recorded. The results of system suitability test performed for each parameter was well within the acceptance values.
Table 2: System suitability.
Parameter Result Acceptance
criteria Theoretical plate count 83821 NLT 2000 Tailing factor 1.1 NMT 2.0
% RSD 1.9 NMT 10.0
System performance 0.7 NMT 10.0%
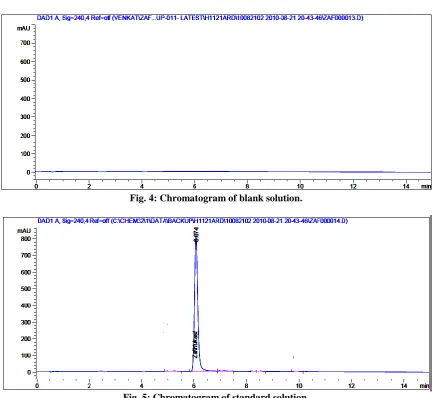
Fig. 4: Chromatogram of blank solution.
Fig. 5: Chromatogram of standard solution. Analysis of tablet formulation
Table 3: Assay values for the marketed formulation. S.
No. Drugs
Brand name
Concentration in(µg/ml)
Label claim (mg)
Amount Found (mg)
% of
Assay SD Mean % of RSD 1
Zofirlukast Accolate
10 10 9.98 99.8
0.231 99.88 0.23
2 10 10 9.97 99.7
3 10 10 10.01 100.1
4 10 10 9.96 99.6
5 10 10 9.99 99.9
6 10 10 10.02 100.2
Fig. 6: Assay of Nifidipine tablets. Evaluation of analytical method (method validation)
The proposed method has been validated for the simultaneous determination Zorfirlukast in tablet dosage form. Calibration curves were constructed by plotting peak areas versus concentrations of ZORFIRLUKAST, and the regression equations were calculated. The calibration curves were plotted over the concentration range 50-150 μg/ml μg/ml for ZORFIRLUKAST. Aliquots (20μl) of each solution were injected under the operating chromatographic conditions described as above.
I) Linearity
Several aliquots of standard stock solution (0.5, 1, 1.5, 2, 2.5 ml) of Accolate were taken in different 10 ml volumetric flask and diluted up to the mark with Diluents. Evaluation was performed with UV detector at 238 nm and Peak area was recorded for all the peaks and a calibration graph was obtained by plotting peak area versus concentration of Accolate The plot of peak area of each sample against respective concentration was found to be linear in the range of 50-150 μg/ml with correlation coefficient of 0.999 and linear regression equation being y = 51038x - 1081
Table 4: Linearity of Zofirlukast.
Level (%) Concentration (µg/mL) Peak Area
20 0.2069 9526
50 0.5174 24587
70 0.8278 40092
100 1.0347 51420
125 1.3037 65294
150 1.5521 79289
Linearity results for Zafirlikast
Figure 7: linearity graph for zorfilukast.
II. Precision
Were prepared. All the solutions were analyzed thrice, in order to record any intra- day variation in the result. The result obtained for intra-day variations are shown in the table 7 and 8. For inter-day variation study, three different concentrations of the combined standards were analyzed for three days. The result obtained for inter-day variations are shown in the table 5 and 6.
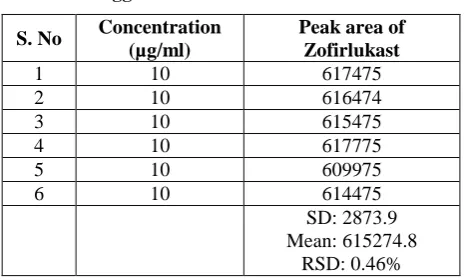
Table 5: Intra-day variability of Zofirlukast. S.
No. Concentration in µg/ml
Peak Area of Zofirlukast
1 10 617475
2 10 622775
3 10 615775
4 10 614775
5 10 617335
6 10 617329
SD:2765.7 Mean: 617577.33
Table 6: Inter-day variability of Zofirlukast.
S. No. Concentration in µg/ml
Peak Area of zofirlukast
1 10 617375
2 10 612775
3 10 605775
4 10 614775
5 10 604536
6 10 613544
SD:5144.11 Mean: 611463.3
RSD:0.841 %
III. Accuracy
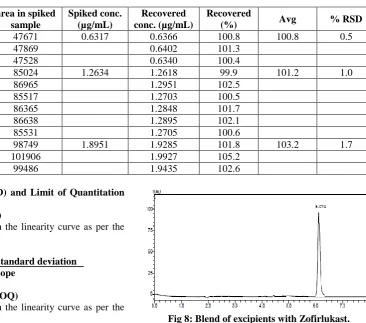
To check the accuracy of proposed method, level of recovery carried out at 80, 100 and 120 % of the concentration as per standard addition method. To perform recovery studies of the test concentration, a powder of preanalysed capsule sample containing 10 mg of ZOFIRLUKAST was weighed such that it should contain 10mg of ZOFIRLUKAST then transferred into 100 ml volumetric flask, add about 50 ml of methanol and sonicated for 20 min with intermediate shaking and volume make up to the mark. 40µg/ml ZOFIRLUKAST pure drugs were used as standard concentrations, finally % recovery was calculated and results and statistical validation are shown in table 7.
Table 7: Recovery studies. Level
(%)
Preparation No.
area in spiked sample
Spiked conc. (µg/mL)
Recovered conc. (µg/mL)
Recovered
(%) Avg % RSD
50 1 47671 0.6317 0.6366 100.8 100.8 0.5
2 47869 0.6402 101.3
3 47528 0.6340 100.4
100 1 85024 1.2634 1.2618 99.9 101.2 1.0
2 86965 1.2951 102.5
3 85517 1.2703 100.5
4 86365 1.2848 101.7
5 86638 1.2895 102.1
6 85531 1.2705 100.6
150 1 98749 1.8951 1.9285 101.8 103.2 1.7
2 101906 1.9927 105.2
3 99486 1.9435 102.6
Limit of Detection (LOD) and Limit of Quantitation (LOQ)
Limit of detection (LOD)
LOD was calculated from the linearity curve as per the below formula:
3.3 x residual standard deviation LOD = Slope
Limit of Quantitation (LOQ)
LOQ was calculated from the linearity curve as per the below formula:
10 x residual standard deviation LOQ = Slope
Table 8: LOD & LOQ.
S. No. LOD LOQ
Zafarlukast 0.014`` 0.041
IV. Specificity
A blend of commonly used excipients was treated as per developed procedure and the chromatogram showed no inferring peaks at retention time of the both drugs and internal standard.
Fig 8: Blend of excipients with Zofirlukast.
V) Robustness
Table 9: Robustness.
S. No. Condition Mean area of Zofirlukast %difference
1 Standard 617656 0.000
2 Mp-changes-1 616656 0.998
3 Mp changes-2 609656 0.989
4 Temp changes-1 619656 1.016 5 Tempchanges-2 614656 0.992 6 Flow chasnges-1 617556 1.005 7 Flow changes-2 619256 1.003
Ruggedness
Table 10: Ruggedness.
S. No Concentration (µg/ml)
Peak area of Zofirlukast
1 10 617475
2 10 616474
3 10 615475
4 10 617775
5 10 609975
6 10 614475
SD: 2873.9 Mean: 615274.8
RSD: 0.46%
Table 11: Summary for Validation Parameters.
Parameters Zofirlukast
Linearity range 50-150 μg/ml Correlation Coefficient 0.999
Slope (m) 51038
Intercept 1081
Specificity No Interference at Rt of the analyte peak Method Precision (%Rsd) 0.0
Accuracy (%Rsd) 0.5 Robustness (%Rsd) 0.46
LOD 0.014 μg/ml
LOQ 0.041 μg/ml
RESULTS AND DISCUSSION
A RP-HPLC method was developed and validated for the determination of ZORFIRLUKAST in tablet dosage forms on a Intersil C18-column (4.6×250mm, 5µm) with mobile phase water& Acetonitrile 25:75 (v/v) at a flow rate of 0.8 mL/min and eluents were monitored at 238 nm. The retention times for ZOFIRLUKAST 6.074 min. The LOD and the LOQ for ZOFIRLUKAST were found to be 0.014 and 0.041 μg/ml, respectively. These data show that method is sensitive for the determination of ZOFIRLUKAST .The recovery experiment was performed by the standard addition method The Percentage recovery for ZOFIRLUKAST are ranged between 99.7–100.27 respectively. The results of recovery studies indicate that the proposed method is highly accurate. The proposed validated method was successfully applied to determine ZOFIRLUKAST in their tablet dosage form. The results obtained for ZOFIRLUKAST comparable with the corresponding
labeled amounts. No interference of the excipients with the absorbance of interest appeared; hence, the proposed method is applicable for the routine simultaneous estimation of ZOFIRLUKAST in pharmaceutical dosage forms. A simple, linear, accurate, specific and selective RP-HPLC method was developed and validated for estimation of ZOFIRLUKAST in their combined dosage form. In this proposed method the linearity range for both ZOFIRLUKAST was found to be 50-150 μg/ml with coefficient of correlation, (r2)=0.999 for ZOFIRLUKAST at 238 nm. The result of the analysis of pharmaceutical formulation by the proposed method is highly reproducible and reliable and it is in good agreement with the label claim of the drug. The method can be used for the routine analysis of the ZOFIRLUKAST dosage form without any interference of excipients.
CONCLUSION
In the present investigation, we have developed a simple, sensitive, precise, and accurate RP- HPLC method for the quantitative estimation of ZOFIRLUKAST in bulk drug and pharmaceutical formulations and a simple, sensitive, precise, and accurate RP-HPLC method for the simultaneous estimation of ZOFIRLUKAST in bulk drug and pharmaceutical formulations. These methods can be used for the routine determination of ZOFIRLUKAST bulk drug and in pharmaceutical formulations.
REFERENCES
1. Willard, H.H., Merritt, y L.L. (Jr), Dean, J.A., Settle, F.A.(Jr)., In; Instrumental Methods of Analysis, 6th Edn., CBS Publishers, Year 82,83; 169-172.
2. Sharma, Y.R., In; Introduction of Organic Spectroscopy, 4th Edn, CBS Publishers and Distributors, New Delhi, 1991; 22.
3. Beckett, A.H. and Stenlake, J.B., In; Practical Pharmaceutical Chemistry, 4th Edn., Part 2, CBS Publishers and Distributors, 2002; 290- 300.
4. Skoog, D.A., Holler, F.J., Timothy, A. and Nieman, N.W., In; Principle of Instrumental Analysis, 3rd Edn., Stanford University, Saunders College Publications, London, 1985; 1-4.
5. ICH, Q2A, Text on Validation of Analytical Procedures, International Conference on Harmonization, Geneva, 1-5.
Harmonization, Geneva, 1-8.
7. Sethi, P.D., In; Quantitative Analysis of Drugs in Pharmaceutical Formulations, 3rd Edn., CBS Publishers and Distributors, New Delhi, 1997; 64. 8. Sethi, P.D., In; HPLC‘High Performance Liquid
Chromatography’, Quantitative Analysis of Pharmaceutical Formulations, 1st Edn., CBS Publishers and. Distributors, New Delhi, 2001; 3-72: 116-120.
9. Jeffery, G.H., Bassette, J., Mendham, J. and Denney, R.C., In; Vogel’s Textbook of Quantitative Chemical Analysis, 5 th Edn., Longman Publication, 1998; 668.
10. Chatwal. G., Anand. K.S., Hi Himalaya Publishing House, 1.1-1.24, 2.566-2.586, 2.624-2.639.
11. www.\An Introduction To Analytical Method Development For Pharmaceutical Formulations Pharmainfo_net.htm
12. www.\Analytical Method Development and Validation.htm.
13. www.\Reverse Phase HPLC Basics for LC-MS-IMP.htm.