Students' Computing Use and Study: When More is Less
Christine A. McLachlan
Deakin University, Geelong, Australia.
Annemieke Craig
Deakin University, Geelong, Australia.Jo Coldwell-Neilson
Deakin University, Geelong, Australia.Abstract
Since the turn of the century there has been a steady decline in enrolments of students in senior secondary computing classes in Australia. A flow on effect has seen reduced enrolments in tertiary computing courses and the subsequent predictions of shortages in skilled computing professionals. This paper investigates the relationship between students’ computing literacy levels, their use and access to computing tools, and students’ interest in and attitudes to formal computing study. Through the use of secondary data obtained from Australian and international reports, a reverse effect was discovered indicating that the more students used computing tools, the less interested they become in computing studies.
Keywords: Computing literacy, computing enrolment, computing education, computer use,
computer access, computing interest, secondary data.
1
Introduction
In the 21st century the use of computers has become an expected and integral component of education for all school students in Australia. In the thirty or so years since computers were introduced into secondary schools there have been dramatic changes with access increasing from, in many instances, one or no computer per school to one device per student. Computing studies have also moved from a specific learning area/subject to an integrated component across the curriculum.
Currently there is a concern that there are insufficient students at all stages of the computing education pipeline to satisfy the future needs of the industry. Sterling (2012) argues that one of the great challenges that currently exists for the Australian industry is having enough sufficiently skilled computer professionals, as there is a growing need for people with ICT skills in all occupational sectors (Australian Workforce and Productivity Agency [AWPA], 2013). This study provides an investigation into Victorian students’ computer use and access, computing attitude and proficiency, and their enrolment in formal computing education. Data from studies conducted over the last fifteen years from multiple large scale public secondary resources has been obtained and re-analysed. This work was motivated by recent trends of declining enrolments in both senior secondary and tertiary computing courses despite the increased accessibility and usage of computing devices within schools and homes. This paper argues that the widespread use of computers has not resulted in an increase in students studying computing, nor even an increase in their proficiency with computers; rather it has had the reverse effect.
2
Background
(IS) and Information Communication Technology (ICT) are used where more appropriate. An interesting observation, adding to the overall confusion, is that in industry the common nomenclature appears to be ICT, in secondary schools it is computing and in post-secondary education it is more frequently IT when associated with the science domain and IS within the business domain.
Koppi and Naghdy (2009) report that there are multiple stakeholders in post-secondary computing education beyond the students who are undertaking formal courses. At one end of the computing pipeline is the industry which reports a lack of skilled Australian workers and increasing reliance on foreign workers. At the other end is the education system, where students in primary and secondary schools use computing devices as tools, and computing skills and knowledge are regarded as a general capability in the curriculum.
A career in the ICT industry has many positive aspects to offer tertiary graduates including a diverse range of roles and strong employment prospects (Australian Government 2011). However with less young people completing relevant degrees (Lynch 2007; McLachlan, Craig & Coldwell 2010) the industry is suffering through a shortage of suitably trained and skilled personnel resulting in 'a labour shortage' that impacts on the management and potential failure of major projects (Australian Government 2007, p. 21).
Last century, Pearcey (1988, p. 125) argued that the 'demand for people with computing expertise has always outstripped the capacity of the tertiary sector to supply it' and now with fewer students undertaking such studies the situation seems to be worsening and unlikely to change.
While the extent of the skill shortages in the ICT industry in Australia is inconclusive, the Department of Immigration has advertised for computer related professionals on its Skills Australia Needs skilled occupation list, enabling the migration to Australia of both temporary and permanent ICT skilled workers (Australian Government & Department of Immigration and Border Protection n.d.-a). The list details a four-digit level Australian and New Zealand Standard Classification of Occupations (ANZSCO) unit group number and brief occupation description, followed by the set ceiling value of applications and the number of requests issued to date. The Australian Computer Society (ACS) has authorised the assessment of ICT occupations for the ANZSCO (Australian Computer Society n.d.). Consequently there has been an increase in the migration of skilled ICT professionals over the last decade (ACS 2013; AWPA 2013).
Recent media reports suggest that ICT employees on 457 visas are replacing Australian workers, as they cost less to employ (Australian Government 2013; Pennington 2013). Whether employees are foreign workers or Australian nationals, Multimedia Victoria (2012) argues that the supply of qualified ICT professionals is decreasing while the demand continues to increase. Therefore, there is still a shortage of, and a need for, more ICT workers in Australia (Australian Government & Department of Immigration and Border Protection n.d.-b).
3
Research Method
This study undertook an examination of school students computing education over the last fifteen years in Victoria, Australia. Secondary data was obtained from key international, national, and state-based studies.
The international studies comprised the International Computer and Information Literacy Study (ICILS) conducted in 2013 and secondly the OECD’s Programme for International Student Assessment (PISA) 2000 through to 2012:
• PISA includes an ICT familiarity questionnaire which examines student access to, how they use, and what they feel when using computing devices (Thomson & De Bortoli 2007). PISA began triennial student assessments in 2000; by 2012, approximately 510,000 15 year old students from 65 countries participated (Australian Council for Educational Research [ACER], 2014).
National data was sourced from ACER as well as the Australian Curriculum, Assessment and Reporting Authority (ACARA). ACER has a long history of providing evidenced-based research to improve learning across students’ ‘lifespan’ from all levels of schooling through to vocational and workplace education. ACARA, a newer body formed in 2009, is responsible for the governance of the national curriculum, the National Assessment Program (NAP) as well as national data collection and reporting (ACARA 2013).
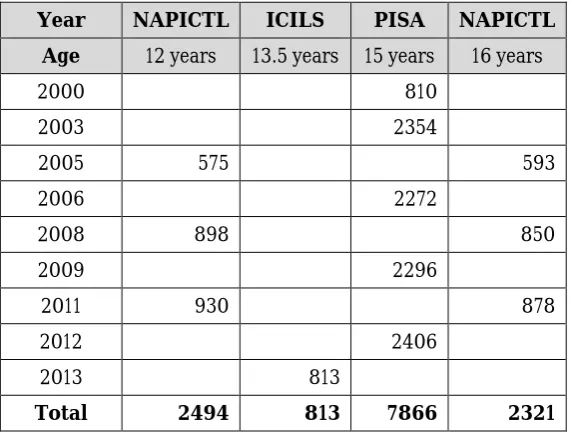
The Victorian data used in this study was obtained from the Victorian Curriculum and Assessment Authority (VCAA), an organisation which aims to provide quality curriculum, assessment and reporting for all of the state’s school students (VCAA 2013). The VCAA is involved in administering the NAP, including tri-annual tests for ICT literacy known as the NAPICTL. In 2011 over 11,000 Australian students aged approximately 12 and 16 years took this test which focused on computer use, skill development, creativity, and confidence (ACARA 2012b). A total of 13,494 Victorian students have participated in either the NAPICTL, PISA or ICILS from 2000 to 2013 (see Table 1).
Year NAPICTL ICILS PISA NAPICTL Age 12 years 13.5 years 15 years 16 years
2000 810
2003 2354
2005 575 593
2006 2272
2008 898 850
2009 2296
2011 930 878
2012 2406
2013 813
Total 2494 813 7866 2321
Table 1: Victorian students surveyed for NAPICTL, PISA, and ICILS.
The VCAA is also responsible for the Victorian Certificate of Education (VCE), which is a qualification spanning the final two years of secondary school for students aged 17 to 18. Approximately 50,000 senior Victorian students complete their VCE each year (VCAA 2013). A VCE ‘study’ consists of 4 units per subject. During their first year students normally study units 1 and 2, with units 3 and 4 in their second year (VCAA 2011).
VCE, VETiS and NAPLAN data in this paper only includes those students who achieved the minimum standard or greater. Combining data from the above sources forms a picture of Victorian students’ interests and interactions with computing from the ages of 12 to 18. The data collected therefore is all secondary data which is publically available. This provides both advantages and disadvantages for research. Obtaining data through secondary sources grants the researcher access to a variety of current and historical information, procures information previously collected, saves researchers time and money, eliminates the need for ethical approval, and provides 'rich potential' (Cowton 1998, p. 427) and 'valuable insights' for researchers (Oakshott 2012, p. 431). Data collected in large amounts reduces the likelihood of bias and overcomes low response rates (Cowton 1998). The use of on-line government and public sector produced information provides researchers with confidence that the data is trustworthy, valid, reliable and non-identifiable (Oakshott 2012). However, utilizing data from secondary sources may provide an incomplete picture, display unneeded data, be time-consuming, and may cause the researcher to feel that they lack control of data collection and presentation (Cowton 1998). The data quality may be questionable, yet when using official sources this is less of a problem (Oakshott 2012). Further issues with secondary data is that it may be duplicated in other databases, or be presented in different formats, contributing to the problem of data inconsistency (Atkinson & Brandolini 2001). To overcome any perceived shortcomings in the use of secondary data, this research has used data that is available from Australian government sources and large international organisations only, therefore increasing data validity and reliability and reducing possible inconsistencies.
Analysing or re-analysing multiple secondary data sources can be achieved in a number of ways. Cowton (1998, p. 426) suggests that 'reanalysis can involve more than one set of research results. One of the benefits of this is that it generates a larger effective sample than an individual study in isolation'. This paper uses descriptive statistical techniques for data analysis, the aims of which are 'to provide images and/or summaries that can help the reader understand the nature of the variables and their relationship' by making predictions that lead to inferences about the population studied (Tashakkori & Teddlie 1998, p. 113).
The following sections present and examine statistics on student computing studies throughout school education in Victoria focussing on students’ computing literacy outcomes, senior secondary students’ computing studies, computer use and access, and attitudes towards computers and computing.
4
Computing Education
Courses on programming and the application of computers were first introduced at several universities in the late 1950s (Sale 1994), although it was not until the 1970’s and 1980’s that computers began to seep into Australian secondary schools (Larkin & Finger 2011; Tatnall & Davey 2006). In Victoria in 1985 the State Board of Education (1985) directed all schools to provide students with opportunities to develop their computing confidence. However, when computing instruction began in schools, access was often restricted to students in particular subjects with the technology being isolated in one room (State Board of Education 1985). Until the mid-1980s many schools were not able to provide computers for student use; or if they did, one computer was often shared by many, if not all, students in the school (Tatnall & Davey 2006).
Attempts continue to be made by the industry, government departments and researchers to encourage greater numbers of students to take up computing studies.
Computing curricula in secondary schools have been described as irrelevant, mundane, uninteresting, and repetitive (Craig 2006; Genrich, Toleman & Roberts 2014; Lynch 2007). Students report that they continue to work on the same software year after year doing presentations, essays, and worksheets (Fraillon et al. 2014), and when students do learn exciting and fun content they find that there is no continuing course (Genrich, Toleman & Roberts 2014). Younger secondary students have a narrow understanding of what senior computing education entails and have formed their perception of the discipline based on their junior years’ experiences and hearsay, although the subject content is different in the senior years (Lynch 2007). Genrich, Toleman and Roberts (2014) report that some middle year teachers tend to teach computing out of a book as it is not one of their specialisations, leaving students with incorrect opinions of computing studies and the ICT work environment. Further, in Australia secondary school computing subjects are not designed as a pathway into university and are often not required as prerequisite subjects for entry into tertiary computing courses (Lynch 2007).
Aligned with reducing interest in computing studies, enrolments in tertiary computing courses are also decreasing at a time when there are increasing numbers of students attending tertiary institutions. The phenomenon of declining secondary and tertiary enrolments is not a local problem; the issue is evident nationally and internationally (Downes & Kleydish 2007; Genrich, Toleman & Roberts 2014; Koppi et al. 2008; Lomerson & Pollacia 2006).
5
Students Computing Decision Influences
Students consider computing subjects to be 'irrelevant to their aspirations' and view computing as a 'bad strategic choice' for 'long-term career prospects' (Lynch 2007, p. 10), despite technology becoming part of everyday life (George, Valacich & Valor 2005). Genrich, Toleman and Roberts (2014) assert that there is little encouragement from parents and insufficient incentives from teachers for students to seriously consider computing careers.
Students rely on information from others as well as the image of an industry when making decisions about career choices. The computing industry has been stereotypically portrayed as nerdy, blokey, geeky, boring, too technical, working long hours and in isolation for too long, as well as there being significant confusion about what computing workers really do, resulting in shying away from the industry (see for example Harris & Wilkinson 2004; Lynch 2007; Rommes et al. 2007). The reality is that working in computing is nothing like these stereotypes, it involves working a 'rewarding career' in a dynamic environment (Tate 2012). Employers look for people with a broad range of skills in the so-called soft areas such as communication and teamwork, as well as the required qualifications and technical skills (Australian Government 2011, 2013).
Teachers are crucial to student learning and the quality of education provided is dependent on quality and inspirational teachers and their schools (Sterling 2012). Teachers’ enthusiasm, computer knowledge, expectations, pedagogical practices, and attitudes toward computing can significantly affect students learning abilities and use of technology (Lynch 2007) and change their perceptions of computing (George, Valacich & Valor 2005). According to Hattie (2003, pp. 2-3) 'the answer lies … in the person who gently closes the classroom door and performs the teaching'.
6
Victorian Schooling
State-wide, Victorian students typically begin school in the year they turn 6 years old (ACARA 2010) and by the end of their primary education are around 12 years old. In most cases students then enter secondary school and by the end of their compulsory learning years they are around 16. Most students continue into post-compulsory learning, also referred to as their senior years, until they are around 18 years old when they commence work or tertiary studies. Students in Victoria are legally required to undertake school studies until they turn 17 (State Government of Victoria 2009).
Nationally, until 2011, all states and territories operated their own educational systems, mostly independently of each other, although from the mid 1990’s they have been working towards common goals (National Curriculum Board 2009). In 2009 all Australian States, Territories, and the Commonwealth agreed upon a national education system (Drabsch 2013) which Victorian schools began to implement from 2013 (VCAA 2012). All students in Australian schools will eventually be taught using this common curriculum base (National Curriculum Board 2009).
The placement of computing in the Victorian curriculum has altered over time. Initially it was placed under Commerce (Curriculum Branch 1985; Ministry of Education (Schools Division) 1988) and then moved to Technology (Board of Studies 1995). The concept of embedding computing emerged (Board of Studies 2000), followed by its integration into other subjects (Curriculum Corporation 2006). Computing then moved to Interdisciplinary Learning (VCAA 2008) where it remains to the present day. In the very near future, with the implementation of the national curriculum, computing will become multidisciplinary (ACARA 2012a). Students at all year levels are expected to learn aspects of computing as a general competency.
The availability of computing studies for senior students is determined by individual schools, and would be based on school council approval, equipment, teacher availability, timetabling, and student interest. Senior computing studies began in the 1980’s with Secretarial Studies and Electronic Typewriting (Christophersen 2001), moving onto HSC Computer Science, Computers in Science and Engineering, and Computers in Business and Government by 1990 (Tatnall & Davey 2008). The introduction of the two year Victorian Certificate of Education (VCE) program in 1990 introduced 2 units each of Information Technology (first year studies),
Information Processing and Management, Information Systems, and Information Technology in Society (second year studies) (Victorian Curriculum and Assessment Board
1990), however the last subject was dropped due to low enrolment numbers in 1998 (Christophersen 2001). The current VCE Information Technology curriculum comprises at unit 1 IT in action, unit 2 IT pathways and at units 3 & 4 Information Technology
Applications, and Software Development (VCAA 2006).
7
Student Computing Literacy
Computing literacy provides students with the skills and abilities to interact with and operate computing devices effectively. The definition of computing literacy adopted for use in Victorian Schools is:
The ability of individuals to use ICT appropriately to access, manage and evaluate information, develop new understandings, and communicate with others in order to participate effectively in society (Ministerial Council on
Education Employment Training and Youth Affairs [MCEETYA] & Performance Measurement and Reporting Taskforce 2008, p. 2).
The definition of computing literacy as used by the ICILS is 'an individual’s ability to use computers to investigate, create, and communicate in order to participate effectively at home, at school, in the workplace, and in society' (Fraillon et al. 2014, p. 17).
increase in proficiency occurred between 2005 and 2008, although this was followed by a decrease in 2011. This situation was not repeated with 16 year old middle secondary students; they remained relatively stable in proficiency throughout the three assessment cycles (Table 2) (ACARA 2012b; MCEETYA 2007; 2010).
Age 2005 2008 2011
12 year olds 57.9% 66.1% 64.0% 16 year olds 66.5% 69.8% 68.0%
Table 2: Percentage of Victorian students at or above NAPICTL proficiency level
Students who are 13.5 year olds would be expected to achieve the second level of computing literacy on the ICILS standard. Extracted data shows that 19% of Victorian students were at or below level 1, 42% level 2, 35% level 3, and 4% level 4; 81% of students met the minimum level for their age. Victorian students self-reported that they were very confident at accomplishing basic computing tasks, but less confident when it came to advanced skills. (De Bortoli et al. 2014)
8
Senior Secondary Computing Studies Involvement
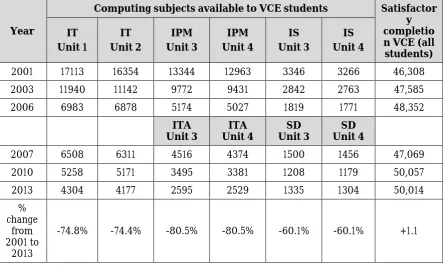
Data about senior secondary students who successfully completed VCE computing education studies are presented in Table 3 (VCAA 2013). While the number of students undertaking the VCE has increased slightly from 46,000 to 50,000 between 2001 and 2013, there has been a significant decline in students undertaking VCE computing studies. These include Information Technology (IT); Information Processing and Management (IPM) prior to 2006, and Information Technology Applications (ITA) from 2006; and Information Systems (IS) prior to 2006 and System Development (SD) from 2006.
Year
Computing subjects available to VCE students Satisfactor y completio n VCE (all
students) IT
Unit 1
IT Unit 2
IPM Unit 3
IPM Unit 4
IS Unit 3
IS Unit 4
2001 17113 16354 13344 12963 3346 3266 46,308 2003 11940 11142 9772 9431 2842 2763 47,585 2006 6983 6878 5174 5027 1819 1771 48,352
ITA
Unit 3 Unit 4 ITA Unit 3 SD Unit 4 SD
2007 6508 6311 4516 4374 1500 1456 47,069 2010 5258 5171 3495 3381 1208 1179 50,057 2013 4304 4177 2595 2529 1335 1304 50,014
% change
from 2001 to
2013
-74.8% -74.4% -80.5% -80.5% -60.1% -60.1% +1.1
Table 3: VCE and VCE IT satisfactory completions
type and number of IT certificates on offer have increased and changed focus over the years, for example in 2001 five certificates were available which increased to 11 by 2013 (VCAA 2013). In 2013 there was almost a three-fold increase in the number of students enrolled in VETiS certificates compared to 2001, although the number of enrolments in VETiS IT studies had decreased during this time (Table 4).
Year certificate VETiS IT enrolments
All VETiS certificate enrolments
% IT of All VETiS enrolments
2001 3692 24,685 14.9% 2013 2328 68,463 3.4% % change
from 2001 to
2013 -36.9% +277.3%
Table 4: VETiS IT and all VETiS certificate enrolments
9
Student Use Of and Access to Computing Devices
In addition to testing students on their computing knowledge, NAPICTL testing also included a section on student use of and access to ICT. Student frequency of computer usage has increased for both 12 and 16 year olds over the past three testing cycles (Table 5) (ACARA 2012b; MCEETYA 2007; 2010).
Age Year used > than Computer 5 years
Frequency of computer use Usage
(Mean days pm) Used daily At
Home At School Home At School At
12 years
2005 60.4% 13.4 10.4 - - 2008 64.4% 18.7 14.3 54.3% 21.4% 2011 70.0% - - 63.0% 39.0%
16 years
2005 69.9% 15.6 11.6 - - 2008 70.6% 23.0 13.7 73.4% 31.7% 2011 79.0% - - 83.0% 50.0%
Table 5: (NAPICTL) Computer usage by 12 and 16 year old students
In 2013, students who completed the ICILS indicated how long they had been exposed to computing devices. Victorian students who had used a computer for more than 5 years accounted for 80%, 89% used a computer at least once a week at home and similarly, 89% used computers at school more than weekly. Almost all students had internet access at home (99%), while every student had internet access at school. Computer access was high, 94 % of students reported having access to two or more computers at home, all students had access to computer devices at school, with 66 % indicating they had access to their own device (De Bortoli et al. 2014).
number of Victorian homes with more than one computer has increased slightly, from an already high rate (93.1%) in 2000. Daily internet use at school has increased significantly, as has home internet connections and home computer use. The number of students who have used a computer for more than 5 years has also increased since 2003.
Year 2000 2003 2006 2009 2012
Have at least one computer at home 93.1% 95.1% 96.4% 96.7% 97.8% Have an internet connection at home 68.6% 86.2% 90.6% 94.9% 96.3% Use the internet at school more than once a week 67.8% 71.4% 70.4% 92.2% 95.8% Used computers for more than 5 years 69.5% 81.9% 87.8% Used a computer at home almost every day 50.9% 53.7% 75.5%
Used a computer at school almost every day 17.2% 14.1% 23.9%
Table 6: PISA 15 year old computer access and use
10
Attitudes and interests toward computing
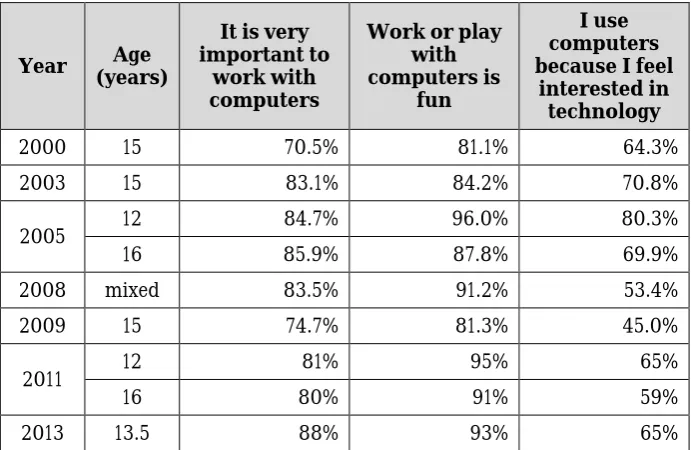
Students from all data sources were asked the same computing attitude questions as those used in the PISA questionnaire. This provides good consistency of results over the three sources. Data adjustments have been made for three particular years so a comparison can be made over the years and age groups. Data for 2005 and 2008 were presented differently in NAPICTL reports; for 2005 an average was calculated by gender, and for 2008 findings were given as an average over both age groups (12 and 16 year olds). The ICILS in 2013 did not provide Victorian percentage results, although those from Australia have been provided, these were the same in scale scores as Victoria. In addition to these data changes, two years have been omitted. PISA 2006 did not include computer attitude questions, and 2012 PISA questions were not comparable with those listed and were therefore not included. Table 7 provides the percentage of students who replied as agreeing to and strongly agreeing to the computer attitude statements. It can be seen that students generally have positive attitudes towards using
computers whether for work or play. However, their interest in technology generally has
remained relatively static, although with some significant fluctuations over the 14 year period.
Year (years) Age
It is very important to
work with computers
Work or play with computers is
fun
I use computers because I feel
interested in technology
2000 15 70.5% 81.1% 64.3% 2003 15 83.1% 84.2% 70.8%
2005 12 84.7% 96.0% 80.3% 16 85.9% 87.8% 69.9% 2008 mixed 83.5% 91.2% 53.4% 2009 15 74.7% 81.3% 45.0%
2011 12 81% 95% 65%
16 80% 91% 59%
2013 13.5 88% 93% 65%
11
Discussion
Computing literacy levels for 12 and 16 year old students provide a somewhat depressing result. Today’s society and education systems have an expectation that students are able to operate computing devices effectively. The NAPICTL findings indicate that many students are still not competent in computing literacy; less than two thirds of Victorian 12 year old students and only a slightly higher proportion of 16 year olds have been able to meet computing literacy expectations in 2011. The findings also suggest that students in 2011 had computing literacy skills at a similar level as students in 2005, despite increased access to computing devices. The NAPICTL results back-up what was reported by the ACS (2009) in reference to students’ inadequate preparation with computing skills, which seems to be impacting on choices in study prior to entering into senior years. Details of NAPICTL computing literacy in Victoria predict that this is an area of educational concern and needs to be addressed, possibly by increasing the emphasis on student computing literacy learning by providing adequate training for teachers.
ICILS results for 13.5 year olds provide a different and encouraging picture; just over 80% of students met their age level computing literacy requirements. Positioning these students onto a computing literacy continuum for 12 to 16 years olds tested under NAPICTL, indicates that they are performing better than expected. This surprising result from the same cohort of students, although at a different age, may be due to a number of factors such as the testing mechanism used, the items tested, question format, presentation and wording, and testing environment.
Despite a substantial increase in students completing VCE, there has been a massive downturn in those completing computing studies at this level (see Table 3), despite a steady increase in the number of senior computing students before 2001 (Christophersen 2001). Students are 75% less likely to undertake Information Technology units in 2013 than they were in 2001, 80% less likely to study Information Technology Applications, and 60% less likely to study Information Systems. In the few instances where there were slight increases, these were very short lived with little indication of students continuing on with further computing studies. Students are decreasingly less interested in studying senior computing, despite an increase in the number of senior secondary students. Does this reflect the perceived relevance, amongst students, of the computing curricula in secondary schools?
The dramatic decrease in VCE computing completions occurred despite computing being taught to all students during their first ten compulsory learning years at schooling. The significant drop in enrolment numbers at senior levels will ultimately contribute to VCE computing units being removed from the curriculum in the future, aggravating the skill shortages problem. The decrease in student numbers at senior levels has already been reflected in fewer students undertaking computing studies in higher education, contributing to a lack of qualified graduates entering the work force (Christophersen 2001). Anecdotal evidence from the authors' own experiences suggest that schools are already removing senior computing studies from their portfolio of offerings. The question has to be asked, but cannot yet be answered, will the new IT curriculum that is being deployed nationwide make a difference to students’ perceptions of computing and the ICT industry, increasing student engagement with the discipline?
A similar situation exists in the VETiS sector; the increasing number of students studying a variety of certificates has tripled yet over a third fewer are venturing into computing related certificates (Table 4). There seems to be an ongoing issue in attracting students into computing courses at both the senior secondary and post-secondary levels, with the situation seemingly worsening every year (Australian Government n.d.; VCAA 2013).
school. Similarly almost 80 % of 16 year olds reported using computers for longer than five years, and accessing them regularly at home and school. Continual growth has occurred in these students using computers for more than five years, and older students are more habitual users than younger ones both at school and at home. NAPICTL students experience in, and frequency of, computer usage has increased dramatically, although this is not reflected in proficiency results; higher usage does not seem to impact computing literacy levels. One has to ask if the definition of computing literacy is appropriate in this day and age.
Computer access and use for 13.5 year olds showed similar results. Most students had access to at least two computers at home that were connected to the internet that were used frequently; all students had computer and internet access at school through a range of computing devices. Most of these students (80%) had used a computer for more than five years.
According to the PISA data, the number of Victorian homes that have more than one computer at home has increased slightly since 2000 but, not surprisingly, Internet connectivity has increased significantly; nearly every household has a computing device. Daily use of computers and the internet at home and at school is now a regular occurrence. Computer use at school in the years 2000, 2003 and 2006 was about a third as often than use at home. The number of 15 year olds with at least 5 years of computer use under their belt has also increased.
Combining data from all four sources clearly shows a steady increase in computer use and access over the last fifteen years. The computing situation in schools and homes in Victoria has certainly changed, considering that thirty-five years ago most schools did not have any computers (Tatnall & Davey 2006); in 2013 almost every student has access to and use of a computing device for educational, leisure and personal use.
The findings related to student interest and attitude to computing highlight some quite remarkable details. A high percentage of students felt it is important to know how to use computers and regarded computers fun to work with; there were only small differences between the ages and years that data was presented for. Younger students enjoyed computing more than older students and most students could see the importance of computers for work. Interest in technology varied however; overall interest in using computers and technology was significantly lower than the recognition of the importance of working with computers or the entertainment (fun) value that the technology could afford. Despite technology interest by 12 year olds being high in 2005, in 2009 it was the lowest recorded for 15 year olds. Overall technology interest by students is positive, yet despite these encouraging findings, the disheartening result is that students are still not interested in undertaking further computing study. This suggests that there are other factors influencing student career choices.
12
Conclusion
assume that students' computer literacy levels are influenced by what they are taught by their teachers. The integration of computing has brought about the situation where almost all teachers teach computing concepts, although only a small number are qualified to do so (Tate 2012).
The presented data shows a clear drop in interest and future research is required to find ways in which to engage students in computing studies. The research reported here suggests that school computing subject offerings, the delivery of the computing curriculum, availability of suitably qualified and enthusiastic teachers, minimal computing career encouragement from teachers, and the lack of computing knowledge in non-specialised teachers are ultimately contributing to the lack of interest in senior secondary students. These issues should be considered for future research to investigate how they impact on students’ decisions to undertake further studies in the area. Change is certainly needed in the teaching of computing at secondary schools, only time will tell if the new national curriculum digital technology content will solve any of these problems.
The differences in outcomes of the various standard measures of computing literacy suggests that maybe what is being measured is not within the skill set that students are developing through their computing activities. Young students are using a range of mobile devices to access services and information, are engaging with social media for fun and entertainment and use assorted software to support their educational needs. Are the standards of computing literacy an accurate measure of their skills with using technology? Do we need to reconsider what this literacy is purporting to measure? Do we need to update current perceptions of what computing literacy is (under all its pseudonyms) and construct one or more technology related literacies such as social media literacy, digital literacy, information literacy and so on?
Enjoying using computers and recognising their potential for work and play is seemingly not sufficient to translate into a career in the ICT industry. Maybe students’ perception of the ICT industry is sufficiently off putting? Popular media portrayal of ICT professionals and the industry, through programs such as the IT Crowd and Big Bang Theory reinforce the ongoing perception that ICT is for geeks and nerds and not for the everyday student. Students career choices are strongly influenced by their parents, amongst others, and their perceptions of the ICT industry would have been influenced by the Dotcom crash in 2000, the more recent global financial crisis and the ongoing debate regarding outsourcing and offshoring of ICT work, all providing strong negative drivers to avoid ICT.
This study has shown that the widespread access to and use of computers and positive computing attitudes does not result in students increasing their computer study options or their level of computer literacy, rather the reverse is evident. It seems that students may still be carrying stereotypical perceptions about computing, or that frequent use has provided students with an unrealistic perception of their computer abilities. Alternatively the pervasiveness and ubiquity of computing technologies may be encouraging a view that there is nothing new or engaging behind the screens that is worthy of their attention. Future research needs to address these misconceptions.
References
Atkinson, AB & Brandolini, A 2001, 'Promise and Pitfalls in the Use of "Secondary" Data-Sets: Income Inequality in OECD Countries as a Case Study', Journal of Economic Literature, vol. 39, no. 3, pp. 771-99, retrieved 19/10/2012, http://www.jstor.org/stable/10.2307/2698313
Australian Computer Society 2013, Australian ICT Statistical Compendium 2013: Inspiring
Success, Sydney, NSW, retrieved 25/7/2014,
http://acs.org.au/__data/assets/pdf_file/0004/28570/Australian-ICT-Statistical-Compendium-2013.pdf
Australian Council for Educational Research 2014, Programme for International Student
Assessment (PISA) Australia, Australian Council for Educational Research, retrieved
2/10/2014, http://www.acer.edu.au/ozpisa/
Australian Curriculum, Assessment and Reporting Authority 2010, National Report on
Schooling in Australia 2009, retrieved 9/4/2013,
http://www.acara.edu.au/reporting/national_report_on_schooling/schools_and_sch ooling/school_structures.html
Australian Curriculum, Assessment and Reporting Authority 2012a, Draft Shape of the
Australian Curriculum: Technologies, Australian Curriculum, Assessment and
Reporting Authority, Sydney, NSW, retrieved 15/5/2012,
http://www.acara.edu.au/curriculum/technologies.html
Australian Curriculum, Assessment and Reporting Authority 2012b, National Assessment
Program: ICT Literacy Years 6 & 10 Report 2011, Sydney, NSW, retrieved 28/2/2013,
http://www.nap.edu.au/verve/_resources/NAP_ICTL_2011_Public_Report_Final.pdf Australian Curriculum, Assessment and Reporting Authority 2013, About Us, Australian
Curriculum, Assessment and Reporting Authority, retrieved 7/1/2015, http://www.acara.edu.au/about_us/about_us.html
Australian Curriculum, Assessment and Reporting Authority, 2015a, 2014 NAP - ICT literacy
report shows a decline in ICT literacy, 10/12/2015,
http://www.acara.edu.au/news_media/acara_news/acara_news_2015_11.html#20151 117
Australian Curriculum, Assessment and Reporting Authority 2015b, National Assessment
Program - ICT Literacy Years 6 & 10 Report 2014, by Australian Curriculum,
Assessment and Reporting Authority, retrieved 17/11/2015,
http://www.nap.edu.au/verve/_resources/D15_8761__NAP-ICT_2014_Public_Report_Final.pdf
Department of Finance and Administration & Australian Government Information Management Office 2007, Meeting the Demand for ICT Skills in the Australian Public
Service - Today and for the Future: Report of the ICT Professional and Skills Development Taskforce, by Australian Government, Commonwealth of Australia,
retrieved 12/10/2008, http://www.amigo.gov.au/
Department of Education, Employment and Workplace Relations 2011, Australian Jobs 2011,
by Australian Government, retrieved May 2012, http://www.deewr.gov.au/Employment/ResearchStatistics/Pages/AustralianJobs.aspx
Department of Education, Employment and Workplace Relations 2013, Labour Market
Research - Information and Telecommunications (ICT) Professions, by Australian
Government, retrieved 6/9/2013, http://foi.deewr.gov.au/system/files/doc/other/ictprofessions.pdf
Department of Industry, Innovation Science Research and Tertiary Education n.d., Higher
Education Statistics Data Cube (uCube), by Australian Government, retrieved
11/9/2013, http://www.highereducationstatistics.deewr.gov.au/
Australian Government & Department of Immigration and Border Protection n.d.-a,
SkillSelect, Australian Government, retrieved 9/12/2015,
http://www.border.gov.au/Trav/Work/Skil
Australian Government & Department of Immigration and Border Protection n.d.-b, Subclass
457 - Temporary Work (Skilled) Visa Statistics, retrieved 14/1/2015,
Australian Workforce and Productivity Agency 2013, ICT Workforce Study, Australian Workforce and Productivity Agency, retrieved 10/7/2013,
http://www.awpa.gov.au/publications/Documents/ICT-STUDY-FINAL-28-JUNE-2013.pdf
Board of Studies 1995, Curriculum and Standards Framework: Technology, Board of Studies, Carlton, VIC.
Board of Studies 2000, Curriculum and Standards Framework II: Technology, Board of
Studies, Carlton, VIC, retrieved 8/3/2013,
http://pandora.nla.gov.au/pan/99103/20090505-1614/csf.vcaa.vic.edu.au/te/kote.html
Christoph, G, Goldhammer, F, Zylka, J & Hartig, J 2015, 'Adolescents' computer performance: The role of self-concept and motivational aspects', Computers & Education, vol. 81, no. 0, pp. 1-12, retrieved 1/12/2014, DOI http://dx.doi.org/10.1016/j.compedu.2014.09.004 Christophersen, P 2001, 'Computer Studies in Victoria', Australian Educational Computing,
vol. 16, no. 1, pp. 42-7, retrieved 27/2/2014, http://acce.edu.au/sites/acce.edu.au/files/pj/journal/AEC_vol16_1_2001%20Comput
er%20Studies%20in%20Victoria.pdf
Cowton, CJ 1998, 'The Use of Secondary Data in Business Ethics Research', Journal of
Business Ethics, vol. 17, pp. 423-4, retrieved 19/10/2012,
http://link.springer.com/article/10.1023%2FA%3A1005730825103?LI=true
Craig, A 2006, Young Girls ICT Into Computing Too, Australian Women in Information Technology and Science Entity.
Curriculum Branch, Education Department of Victoria, 1985, Curriculum Frameworks P-12:
An Introduction, Education Department of Victoria, Melbourne.
Curriculum Corporation 2006, Statements of Learning for Information and Communication
Technologies (ICT), DOI ISBN-13: 978-1-86366-633-6, ISBN-10: 1 86366 633 8,
<http://www.curriculum.edu.au/verve/_resources/StmntLearning_ICT_2008.pdf De Bortoli, L, Buckley, S, Underwood, C, O'Grady, E & Gebhardt, E 2014, ICILS 2013:
Australian students' readiness for study, work and life in the digital age, Australian
Council for Educational Reasearch Ltd, Camberwell, Victoria, retrieved 25/11/2014, http://research.acer.edu.au/ict_literacy/6/
Downes, T & Kleydish, F 2007, GaIT Working Paper: Curriculum, Participation and
Performance in Senior Secondary Computing and IT Subjects in New South Wales, Victoria and South Australia, Charles Sturt University, Australia, retrieved 27/2/2014,
http://www.csu.edu.au/__data/assets/pdf_file/0020/205139/CurriculumAnalysisWo rkingPaper.pdf
Drabsch, T 2013, The Australian Curriculum: Briefing Paper No. 1/2013, NSW Parliamentary Research Services, February, ISSN: 1325-5142, ISBN: 978-0-7313-1897-1, Briefing
Paper, retrieved 8/3/2013, http://www.parliament.nsw.gov.au/prod/parlment/publications.nsf/0/B18363C26EC
0F93ACA257B1800144FDE/$File/The%20Australian%20Curriculum.pdf
Ford, M 2015, School students' digital skills in decline despite prolific use: report, 17/11/2015, retrieved 17/11/2015, http://www.abc.net.au/news/2015-11-17/school-students-digital-skills-in-decline-despite-prolific-use/6945672
Fraillon, J, Ainley, J, Schultz, W, Friedman, T & Gebhardt, E 2014, Preparing for Life in a
Digital Age: the IEA International Computer and Information Literacy Study International Report, SpringerLink.com, Melbourne, retrieved 25/11/2014,
Genrich, R, Toleman, M & Roberts, D 2014, 'Impacting IT Enrolments: What Factors Most Influence Student Career Decisions', paper presented to 25th Australasian Conference on Information systems, Auckland, New Zealand, 8-10 December, retrieved 9/12/2014, http://aut.researchgateway.ac.nz/bitstream/handle/10292/8144/acis20140_submissi on_134.pdf?sequence=1&isAllowed=y
George, JF, Valacich, JS & Valor, J 2005, 'Does Information Systems Still Matter? Lessons for a Maturing Discipline', Communications of the Association for Information Systems, vol. 16, no. 1, p. Article 8, retrieved 28/3/2008, http://aisel.aisnet.org/cais/vol16/iss1/8/
Harris, R & Wilkinson, MA 2004, 'Situating gender: students' perceptions of information work', Information Technology & People, vol. 17, no. 1, pp. 71-86, retrieved 31/3/2008, http://www.emeraldinsight.com/Insight/ViewContentServlet;jsessionid=2B7111AF416 FDA543395F0290B0EB3B0?Filename=Published/EmeraldFullTextArticle/Articles/16 10170104.html
Hattie, J 2003, 'Teachers Make A Difference: What is the research evidence?', paper presented to Building Teacher Quality: What does research tell us?, Melbourne, VIC, October,
retrieved 22/5/2014, http://www.acer.edu.au/documents/RC2003_Hattie_TeachersMakeADifference.pdf
Koppi, T & Naghdy, F 2009, Managing educational change in the ICT discipline at the tertiary
educational level, University of Wollongong, Strawberry Hills, NSW, retrieved
25/3/2010, http://acdict.edu.au/userDocs/Koppi_NaghdyExecutiveSummaryFinal.pdf Koppi, T, Naghdy, F, Chicharo, J, Sheard, J, Edwards, S & Wilson, D 2008, 'The crisis in ICT education: An academic perspective', in Hello! Where are you in the landscape of
educational technology? Melbourne 2008, pp. 505-8, retrieved 25/5/09,
http://www.ascilite.org.au/conferences/melbourne08/procs/koppi-poster.pdf
Larkin, K & Finger, G 2011, 'Informing one-to-one computing in primary schools: Student use of netbooks', Australasian Journal of Educational Technology, vol. 27, no. 3, pp. 514-30, retrieved 11/4/2012, http://ajet.org.au/index.php/AJET/article/view/958/234 Lomerson, WL & Pollacia, L 2006, 'Declining CIS Enrollment: An Examination of Pre-College
Factors', Information Systems Education Journal, vol. 4, no. 35, pp. 1-13, retrieved 8/2/2010, http://isedj.org/4/35/ISEDJ.4(35).Lomerson.pdf
Lynch, J 2007, 'Introduction: Exploring the gender and IT problem and possible ways forward', in J Lynch (ed.), Gender and IT: On going challenges for Computing and
Information Technology education in Australian secondary schools, Common Ground
Publishing, Altona, VIC, pp. 1-26.
McLachlan, C, Craig, A & Coldwell, J 2010, 'Student Perceptions of ICT: A Gendered Analysis', in T Clear & J Hamer (eds), Twelfth Australasian Computing Education Conference
(ACE2010), Brisbane, Australia, vol. 103, pp. 127-36.
Ministerial Council on Education, Employment Training and Youth Affairs 2007, National
Assessment Program: ICT Literacy, Years 6 and 10, Report 2005, Carlton South, VIC,
retrieved 11/06/09, http://www.mceetya.edu.au/verve/_resources/NAP_ICTL_2005_Years_6_and_10_R
eport.pdf
Ministerial Council on Education, Employment Training and Youth Affairs 2010, National
Assessment Program: ICT Literacy, Years 6 and 10, Report 2008, Carlton South, VIC,
retrieved 3/9/2013, http://www.nap.edu.au/verve/_resources/2008_NAP_ICTL_Public_Report.pdf
Ministerial Council on Education Employment Training and Youth Affairs [MCEETYA] & Performance Measurement and Reporting Taskforce 2008, National Assessment
Assessment Domain for ICT Literacy, Ministerial Council on Education, Employment,
Training and Youth Affairs, Melbourne, retrieved 3/7/09, http://www.mceetya.edu.au/verve/_resources/NAP_ICTL_2008_Assessment_Domai n.pdf
Ministry of Education (Schools Division), Victoria, 1988, The School Curriculum and
Organisation Framework, P-12: A Curriculum for All, Ministry of Education (Schools
Division), Victoria, Melbourne, VIC.
National Curriculum Board 2009, The Shape of the Australian Curriculum, by National
Curriculum Board, retrieved 21/4/2010, http://www.acara.edu.au/verve/_resources/Shape_of_the_Australian_Curriculum.pd
f
Oakshott, L 2012, Essential Quantitative Methods for business, management and finance, 5th edn, Palgrave Macmillan, New York, NY.
Pearcey, T 1988, A History of Australian Computing, Chisholm Institute of Technology, Caulfield, VIC.
Pennington, S 2013, 'Employers want a 'cheapie, just arrived off the boat', Aussie IT workers told', The Sydney Morning Herald, 15/3/2013, IT Pro, retrieved 22/3/2013,
http://www.smh.com.au/it-pro/government-it/employers-want-a-cheapie-just-arrived-off-the-boat-aussie-it-workers-told-20130315-2g515.html
Rommes, E, Overbeek, G, Scholte, R, Engles, R & De Kemp, R 2007, ''I'M NOT INTERESTED IN COMPUTERS': Gender-based occupational choices of adolescents', Information,
Communication & Society, vol. 10, no. 3, pp. 299-319, retrieved 25/1/2013, DOI
10.1080/13691180701409838, <http://dx.doi.org/10.1080/13691180701409838
Sale, A 1994, 'Computer Science Teaching in Australia', in JM Bennet, R Broomhan, PM Murton, T Pearcey & RW Rutledge (eds), Computing in Australia: The Development of
a Profession, Hale and Iremonger Pty Limited, Sydney, NSW, pp. 151-4.
State Board of Education 1985, Technology in Education, Information Paper No. 1: An
Introduction to Computers in Learning, State Board of Education, Melbourne, VIC.
State Government of Victoria 2009, Education and Training Reform Amendment (School
Age) Act 2009 17 November 2009, retrieved 10/4/2013,
http://www.austlii.edu.au/au/legis/vic/num_act/eatraaa200962o2009475/
Sterling, L 2012, How can schools get kids engaged in IT, retrieved 13/7/2012,
http://www.swinburne.edu.au/chancellery/mediacentre/media-centre/news/2012/07/how-can-schools-get-kids-engaged-in-it
Tashakkori, A & Teddlie, C 1998, Mixed Methodology: Combining Qualitative and
Quantitative Approaches, vol. 46, Applied social research methods series, Sage
Publications Inc, Thousand Oaks, CA.
Tate, N 2012, 'Let's learn from the British ICT overhaul', The Australian, 31 January,
Business/Technology, retrieved 10/4/2015,
http://www.theaustralian.com.au/business/technology/lets-learn-from-the-british-ict-overhaul/story-e6frgb0o-1226257642933
Tatnall, A & Davey, B 2006, 'Early Computer Awareness Courses in Australian Secondary Schools - Curricula from the Late 1970s and Early 1980s', in J Impagliazzo (ed.), IFIP
19th World Computer Congress, WG 9.7, TC9: History of Computing, Proceedings of the Second Conference on the History of Computing and Education, Santiago, Chile, vol.
215, pp. 107-16.
Tatnall, A & Davey, B 2008, 'Computer Education Support Structures in Victorian Schools in the 1980's', in J Impagliazzo (ed.), IFIP International Federation for Information
on the History of Computing and Education WG9.7/TC9, History of Computing 3,
Milano, Italy, vol. 269, pp. 1-22, retrieved 24/1/2013,
http://download.springer.com/static/pdf/58/chp%253A10.1007%252F978-0-387-09657-5_1.pdf?auth66=1380245576_db2fcdaebc1a8eb7ca29948a3b138a0b&ext=.pdf Thomson, S & De Bortoli, L 2007, PISA 2003 Australia: ICT Use and Familiarity at School
and Home, vol. ACER Research Monoghraph No 62, Australian Council for Educational
Research, Camberwell, VIC, retrieved 1/10/2014, https://www.acer.edu.au/files/Mono_62_PISA-ICT_Report.pdf
Victorian Curriculum and Assessment Authority 2006, Information Technology: Victorian
Certificate of Education Study Design, Victorian Curriculum and Assessment Authority,
East Melbourne, VIC.
Victorian Curriculum and Assessment Authority 2008, Interdisciplinary Learning Strand:
Information and Communications Technology, retrieved 14/5/09,
http://vels.vcaa.vic.edu.au/downloads/vels_standards/velsrevisedict.pdf
Victorian Curriculum and Assessment Authority 2010, An Overview of VET in the VCE and
VCAL 2011, East Melbourne, VIC, retrieved 27/2/2013,
http://www.vcaa.vic.edu.au/documents/vet/publications/vetoverview.pdf
Victorian Curriculum and Assessment Authority 2011, VCE and VCAL Administrative
Handbook 2012, ISSN: 1448-4552, East Melbourne, VIC.
Victorian Curriculum and Assessment Authority 2012, Introducing AusVELS, Victorian Curriculum and Assessment Authority, retrieved 3/5/2013, http://www.vcaa.vic.edu.au/Pages/foundation10/curriculum/intro.aspx
Victorian Curriculum and Assessment Authority 2013, Senior Secondary Certificate
Statistical Information, State Government of Victoria, retrieved 5/8/2013,
http://www.vcaa.vic.edu.au/Pages/vce/statistics/subjectstats.aspx
Victorian Curriculum and Assessment Board 1990, Information Technology Study Design, Victorian Curriculum and Assessment Board, Carlton, VIC.
Working Group on Education for Science and Technology to the Victorian Government through the Hon. Ian Cathie, Minister of Education, 1987, Improving the Science,
Mathematics and Technology Education Base in Victoria. Part 1: An Overview and Recommendations, Melbourne, VIC.
Copyright: © 2016 McLachlan, Craig, Coldwell-Neilson. This is an open-access article