Reliable Power System Operation Plan: Steady State
Contingency Analysis
Hui Hwang Goh
1,*, Kai Chen Goh
2, Rina Rashid
1, Syyi Sim
3, Qing Shi Chua
1,
Sze Sing Lee
4, Ruzairi Abdul Rahim
1,51Department of Electrical Engineering, Faculty of Electrical and Electronic Engineering, Universiti Tun Hussein Onn Malaysia, 86400 Parit Raja, Batu Pahat, Johor, Malaysia. 2Department of Construction Management, Faculty of Technology Management and Business, Universiti Tun Hussein Onn Malaysia, 86400 Parit Raja, Batu Pahat, Johor, Malaysia. 3Department of Electrical Engineering Technology, Faculty of Engineering Technology, Universiti Tun Hussein Onn Malaysia, 86400 Parit Raja, Batu Pahat, Johor, Malaysia.
4University of Southampton (USMC), No. 3, Jalan Canselor 1 Kota Ilmu Educity, 79200 Nusajaya, Johor, Malaysia 5Faculty of Electrical Engineering, Universiti Teknologi Malaysia.
1. Introduction
A dependable and sustains endow of electrical energy is important part of today’s complicated societies [1]. In recent years, the power systems are forced to operate closer to their limits due to the combination of increased energy consumption and various kinds of obstructions to the extension of the existing transmission system [2]. A power system is said to be secured when it is free from danger or risk [3], [4].
The shortage of planning and understanding of the influence of a crucial attack on the electric grid is itself a threat to the grid. There is no understandable perception of the worst case scenario could be occurred. Therefore, contingency analysis is prepared with the intent to identify the next worst case contingency [5].
In order to ensure Sabah, Malaysia grid transmission system is always at the optimum condition, therefore economically and reliably, steady state contingency analysis must be performed. This analysis is performed to ensure that the system always meets all requirements according to grid code standards under normal operations
and given a variety of contingencies which are applicable [6].
Steady state contingency analysis is implemented to examine the outage of elements such as transmission lines, transformers and generators [7]. Besides that, this analysis also being used to investigate the resulting effects on line power flows and bus voltages in the remaining system [8]. The task of steady state contingency analysis is to calculate power flows in outage states in which one or more system components are out of service. A transmission system must satisfy security criteria in both normal and outage states [9].
Steady state contingency analysis for transmission system includes the network expansion program with forecasted load demand; operation scenarios were divided into four base cases to reflect the staging of several major projects planned for the system as well as to capture the highest load demand for the study scenario. The steady state contingency analysis was conducted on system peak load and system trough load conditions for year 2015. This study is conducted to provide monitoring on the system condition especially in the event of forced transmission equipment or generator outages.
Abstract: Steady state contingency analysis focuses at the evaluation of the risk certain contingency possibly causes to an electrical network. This analysis is used to review the outage of elements such as transmission lines, transformers and generators, and investigation of the resulting effects on line power flows and bus voltages in Sabah, Malaysia grid transmission system. This is an extremely significant duty for network operators since network stability issues become essentially critical in electricity deregulation. In this paper, the analysis is performed to ensure the system meets grid code standards during normal operations and variety of contingencies condition. Therefore, this paper intended to put forward issues and recommendations towards attaining a steady power system operation plan. Steady state contingency analysis is to calculate power flows in outage states in which one or more system components are out of service. A transmission system must satisfy security criteria in both normal and outage states. This paper presented the steady state contingency analysis for the period of year 2015. The contingency analysis are performed by using the Siemens PTI software, Power System Simulator for Engineering (PSS/E).
The interconnected electric power system is designed to deliver power safety and reliable wherever it is needed, every second of every day. In Sabah Grid, the transmission system consists of lines rated at 66kV, 132kV and 275kV. The distribution system comprises all lines at voltage lower than 66kV which links up all major towns in Sabah and Federal Territory of Labuan.
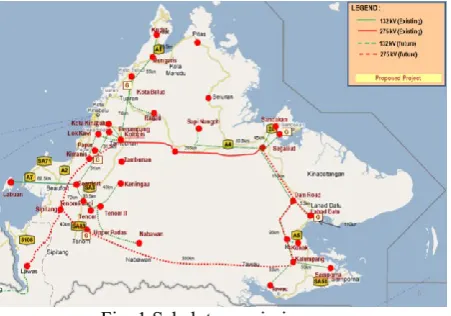
Sabah and Labuan Grid network consists of a network with about 492.0km of 275kV lines, 1596.5km of 132kV lines and 100.34km of 66kV lines. Sabah Grid is essentially divided into two; west coast grid and east coast grid, with the bulk of the generation and load in the west coast grid. Currently, these two areas are linked via a double-circuit 275kV overhead line crossing the Crocker mountain range from Kolopis in the west coast to Segaliud in the east coast. The interconnection helps to transfer some available generation capacity in west coast Region to the east coast Region. Power transfer quantum from west coast to east coast will depend on the availability of generation in west coast, usually during early morning trough period, or during weekend. A map of Sabah Transmission Network System shown in Fig. 1.
Fig. 1 Sabah transmission map
Hence, this study is conducted to address potential issues and recommendations towards achieving a more reliable power system operation plan. From this, Sabah grid is able to meet system demand while maintaining the reliability within acceptable standards by maximizing the use of available and existing generation and transmission resources for system operation [10]. This study therefore provides inputs in identifying the most appropriate solution to ensure supply reliability to the customers accompanied with continuing strong growth in electricity demand in Sabah.
2. Steady State Analysis
Generally, steady state contingency analysis is used to assess the performance of a power system under different equipment outage conditions by comparing it against predefined criteria, such as acceptable bus voltage limits and branch loading limits.
Normal condition or n-0 is the system that operates without any tripped transmission equipment or power plant. A single contingency condition or n-1 is the loss of any power system element that has only one of the
transmission equipment or power plant tripped but not include the busbar. While, two simultaneous events as known as n-2 contingency.
Power systems are affected by events that depend on the state of the power system. For instance, as load increase, the flows on transmission line increase. The transmission networks are design under normal operating conditions to operate within specific ranges. However, under some stress conditions in the system, the voltage range will exceed from the nominal range. The details for those conditions are summarized in Table 1.
Table 1 Voltage excursion
Under normal
operating condition ± 5% at 275kV, 132kV, 33kV
Under system stress conditions following a
system fault
± 10% at all power system voltages, however
in the case of the transmission network, this condition should not
occur for more than 30 minutes
Power system simulator for engineering (PSS/E) software is used to perform steady state contingency analysis in this paper. This paper will focus on the power flow and the way it behaves in normal conditions, n-1 contingencies. Power flow analysis has a great importance in future expansion planning in stability studies and in determining the best economical operation for existing systems. Besides, load flow results are valuable for setting the proper protection devices to ensure the security of the system.
3. Methodologies 3.1 Study Approach
The studies carried out at the year of 2015 to determine the adequacy and reliability of the transmission systems are power flow analysis and stability analysis. The study also caters peak demand and trough demand for each year studied. The trough demand is assumed to 50% of peak demand loading. The analysis was performed using the AC Contingency Analysis Tool in the PSS/E software. In each year, the base cases carried two scenarios which are; 1. System peak load scenario and 2. System trough load scenario and the details for the base cases are shown in Table 2.
Table 2 Cases considered during system peak and system trough
Case Year Forecasted system demand (MW) System Peak Load 2015 1150
System Trough
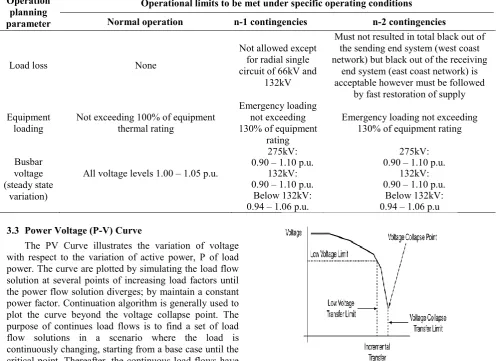
3.2 Operation Planning Criteria
Operation planning criteria is to verify that the operation of the grid network always within the specified level of supply reliability and security in accordance with and not less than its obligations under the Sabah and Labuan Grid Code and Energy Commission’s License Conditions. The operation planning criteria used in studies are shown in Table 3. In transmission development planning, (N-1) is adopted as the main
transmission criterion. N-1 single element outage should not resulted in instability or loss of load. It should also not resulted in overload on any other part of the network.
The voltage levels for normal steady-state conditions are maintained within 1.00 – 1.05 per-units and the system frequency will be nominally 50 Hz and shall be controlled within the limits of 49.75 – 50.25 Hz.
Table 3 Operation planning criteria used in this paper
Operation planning parameter
Operational limits to be met under specific operating conditions Normal operation n-1 contingencies n-2 contingencies
Load loss None
Not allowed except for radial single circuit of 66kV and
132kV
Must not resulted in total black out of the sending end system (west coast network) but black out of the receiving
end system (east coast network) is acceptable however must be followed
by fast restoration of supply
Equipment
loading Not exceeding 100% of equipment thermal rating
Emergency loading not exceeding 130% of equipment
rating
Emergency loading not exceeding 130% of equipment rating
Busbar voltage (steady state
variation)
All voltage levels 1.00 – 1.05 p.u.
275kV: 0.90 – 1.10 p.u.
132kV: 0.90 – 1.10 p.u.
Below 132kV: 0.94 – 1.06 p.u.
275kV: 0.90 – 1.10 p.u.
132kV: 0.90 – 1.10 p.u.
Below 132kV: 0.94 – 1.06 p.u
3.3 Power Voltage (P-V) Curve
The PV Curve illustrates the variation of voltage with respect to the variation of active power, P of load power. The curve are plotted by simulating the load flow solution at several points of increasing load factors until the power flow solution diverges; by maintain a constant power factor. Continuation algorithm is generally used to plot the curve beyond the voltage collapse point. The purpose of continues load flows is to find a set of load flow solutions in a scenario where the load is continuously changing, starting from a base case until the critical point. Thereafter, the continuous load flows have been applied to understand and evaluate the problem of voltage stability and those areas that are likely to the voltage collapse [11]. P-V curve in Fig. 2 shows the “knee of the curve” indicates critical transfer level beyond which voltage falls rapidly with the increasing of power transfer. Voltage drop in transmission line is caused by flows of active and reactive power. A different critical point will be obtained at each power factor. The maximum point to transfer power is at the knee point of the PV curve, which is also referred to as the nose of the PV curve. Therefore, the power system will develop a voltage collapse when operated in this position.
Fig. 2 P-V curve
4. Results and Analysis 4.1 Load Flow Analysis
4.1.1 Peak Load in Year 2015 (1150MW)
Steady state analysis bus voltage result for peak load in year 2015 is shown in Fig. 3. From the observation for peak load in year 2015, there is no buses with voltage greater than 1.05p.u. and also no buses with voltage less than 1.00p.u. Therefore, busbar voltages for peak load in year 2015 still within the acceptable range. For transmission line that exceed 50% of rating capacity the simulation result is shown in Fig. 4. Besides that, there is no transformer branches that exceed 50% of rating capacity from Fig. 5.
Fig. 3 Out of bus voltage result for peak load in year 2015
Fig. 4 Transmission line that exceed 50% of rating capacity for peak load in year 2015
Fig. 5 Transmission transformer branches that exceed 50% of rating capacity for peak load in year 2015.
4.1.2 Trough Load in Year 2015 (575MW)
Steady state analysis bus voltage result for trough load in year 2015 is shown in Fig. 6. Observation form from the figure, there is no buses with voltage greater than 1.05p.u. and there is no buses with voltage less than 1.00p.u. Therefore, busbar voltages for trough load 2015 still within the acceptable range. For transmission line that exceed 50% of rating capacity the simulation result is as shown in Fig. 7. Besides that, there is no transformer branches that exceed 50% of rating capacity from Fig. 8.
Fig. 6 Out of bus voltage result for trough load in year 2015
Fig. 7 Transmission line that exceed 50% of rating capacity for trough load in year 2015
Fig. 8 Transmission transformer branches that exceed 50% of rating capacity for trough load in year 2015
4.2 Power Voltage (PV) Analysis
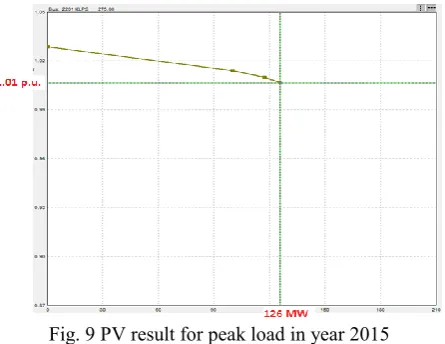
In this paper, PV analysis is conducted to identify the maximum power can be transferred from west (source) to east (sink) at 275kV Kolopis – Segaliud line when there is a single outage without violating the voltage criteria. PV curve is derive for year 2015 to access power grid voltage stability.
Fig. 9 PV result for peak load in year 2015
For trough load in year 2015, the maximum power transfer is 137MW as shown in Fig. 10. Due to new plants coming on stream at the west Coast. More power transferred to east to cater for the load demand. The summary for the peak and trough load in year 2015 is provided in Table 4.
Fig. 10 PV result for trough load in year 2015
Table 4 Maximum power transfer from west to east
Year Case load Contingency
Maximum transfer
(MW)
2015
Peak Single line 275kV Kolopis
to 275kV Segaliud
126
Trough 137
5. Conclusion and Recommendation
The main task in the power system is to ensure the reliability, stability and safety in the operation. Steady state analysis can be used within preparation of the power system operation as another tools for safety and reliability control of transmission system. Meanwhile, it also can be
implement in development study of the transmission system.
For steady state contingency analysis, for non-contingency (n-0) conditions, whereby all transmission circuits are available and in operation, there are no thermal rating violations. Under N-1 contingency, there is no violation on 275kV Kolopis - Segaliud lines.
In view of lack of ring network in current system, therefore in future it is recommended that the existing defence scheme such as under frequency load shedding to be maintained and updated from time to time to cater for increasing system load demand.
For future work, dynamic analysis for the same period of study can be performed. By the year 2016, it is expected that more power plant with larger capacity will be commissioned to stabilize the grid system. The future Sabah grid system will be more robust and stable with the upgrading of some older and aging generation plants. With this updates, the dynamic study will be more interesting as various cases can be conducted to ensure that Sabah grid transmission system is planned and operated safely.
Acknowledgement
The authors would like to thank the Ministry of Science, Technology and Innovation, Malaysia (MOSTI), and the Office for Research, Innovation, Commercialization, Consultancy Management (ORICC), Universiti Tun Hussein Onn Malaysia (UTHM) for financially supporting this research under the Science Fund grant No.S023 and IGSP Vot. U667.
References
[1] N. Safari and A. Jalili. Day-Ahead Price Forecasting Based On Hybrid Fuzzy Neural Network And Suport Vector Machine. Trends in Life Sciences, vol. 3, (2014).
[2] R. Rashid. Reliable power system operation plan-steady state contingency analysis. Universiti Tun Hussein Onn Malaysia, (2014).
[3] S. Shaikh and V. Lingaraddi. Contingency Ranking and Analysis Using Mipower. International Journal of Engineering Trends and Technology (IJETT), vol. 10, p. 5, (2014).
[4] S. Shahnawaaz, L. Vijayalaxmi. Contingency Ranking and Analysis Using Mipower. International Journal of Engineering Trends and Technology, (2014), pp. 418-422.
[5] T. Mandloi and A. K. Jain. A Study of Power System Security And Contingency Analysis. International Journal of Scientific Research Engineering & Technology (IJSRET), vol. 3, p. 4, (2014).
[7] T. L. Baldwin, M. S. Tawfik, and M. McQueen. Contingency Analysis of Cascading Line Outage Events. Power Systems Conference, (2011), pp. 1-8. [8] M. Anthony, R. Arno, P. S. Saba, R. Schuerger, and
M. Beirne. Reliability Engineering Applied to Critical Operations Power Systems (COPS). Industrial and Commercial Power Systems Technical Conference (I&CPS), (2011), pp. 1-8.
[9] W. Li, W. System Analysis Techniques. Probabilistic Transmission System Planning, John Wiley & Sons, (2011).
[10]J. Marti, L. Marti, and H. W. Dommel. Transmission line models for steady-state and transients analysis. Athens Power Tech, Proceedings. Joint International Power Conference, (1993), pp. 744-750.