© Universiti Tun Hussein Onn Malaysia Publisher’s Office
IJIE
Journal homepage: http://penerbit.uthm.edu.my/ojs/index.php/ijie
The International
Journal of
Integrated
Engineering
ISSN : 2229-838X e-ISSN : 2600-7916
Comprehensive Comparisons of Two- and Three-Dimensional
Numerical Estimation of Stress Intensity Factors and Crack
P
ropagation in Linear Elastic Analysis
Abdulnaser M. Alshoaibi
Department of Mechanical Engineering, Jazan University, P. O. Box 706, Jazan 45142, Kingdom of Saudi Arabia
DOI: https://doi.org/10.30880/ijie.2019.11.06.006
Received 12 May 2019; Accepted 31 August 2019; Available online 06 September 2019
1. Introduction
Reliable structural integrity and reliability assessment of the critical structural components remain an essential process for the safety of engineering structures including crack initiation and propagation. Stress intensity factors are important parameters for failure analysis of cracked structures because it has been used for the prediction of crack initiation and cracks propagation path. Stress intensity factors (SIFs) defines the amplitude of the crack tip singularity. These stresses near the crack tip increase in proportion to SIFs. Moreover, the stress intensity factor completely defines the crack tip conditions; if SIFs are known, it is possible to solve for all components of stress, strain, and displacement. Numerous handbooks of stress intensity factors calculation are available [1,2] for specific geometries and loading. Due to the limitation of the analytical solution of stress intensity factors, the vast majority of fracture problems encountered in engineering practice should be resolved with a numerical analysis method [2]. Stress intensity factors can be computed by various methods, such as the boundary element method (BEM), finite element method (FEM) by[4], both FEM and BEM by[5]. The basic practical problem facing a designer is to make a decision as to the method for determining stress intensities.
There exist two categories of commercial FEM programs, finite element programs such as ANSYS [6,7], ABAQUS, NASTRAN, etc. can be used to add elements manually and perform analysis on complex structures. The
Abstract: This paper presents a comprehensive comparison of two finite element software in two and three dimensions. The first is a two-dimensional crack growth simulation program developed as source code by using Visual Fortran Language whereas the second is ANSYS mechanical program (3D structural analysis for fracture mechanic analysis). The procedure consists of computing stress intensity factors (SIFs), the crack growth path and the stresses and strain distributions via an incremental analysis of the crack extension, considering two and three-dimensional analysis. Comparisons between this two software were performed for different case studies for stress intensity factors as well as crack growth trajectory. This source code includes the mesh generator based on the advancing front method as well as all the pre and post process for the crack growth simulation under linear elastic fracture mechanics theory with a user-friendly interface. The maximum circumferential stress criterion was used for prediction of the crack growth in isotropic materials under mixed-mode loading. Furthermore, the equivalent domain integral method has been used for calculating the stress intensity factors values during crack growth. Verification of the predicted crack path and stress intensity factors values were validated with relevant experimental data and numerical results obtained by other researchers with a good agreement.
Keywords: Finite element method, advancing front method, ANSYS Mechanical, Stress Intensity Factors, Linear
loading conditions. This is due to the density of the generated mesh as well as the element type used. Other researchers developed their own two-dimensional source code program to predict the fatigue crack growth and crack propagation under static loading as well as the prediction of stress intensity factors using adaptive mesh strategy [9,10,11]. It is not easy to strike a balance between the accuracy of the method, the time required to get a solution, and cost. Numerous equations for stress intensity factors are available in the literature [12, 13]. These factors represent various geometries and loading conditions of fundamental importance in the prediction of structural failure of cracked bodies. In all, there are probably more than 600 formulas for calculating K values for different crack configurations, body geometries, and loading situations. However, it appears that the bulk of fracture mechanics work to date has been limited to a single-mode loading largely because little is known about mixed-single-mode phenomena [14]. For these reasons, the evaluation of stress intensity factors for non-standard geometries are required by using numerical methods like finite element methods.
Many studies have been performed to predict the stress intensity factors as well as the crack growth path like [15,16,17]. This study presents a comprehensive comparison study for crack growth between the developed source code two dimensional and three-dimensional FEM (ANSYS Mechanical). The fracture parameters such as stress intensity factors and crack growth trajectory were compared on different types of geometries under specified loading condition. The predicted results were validated by the corresponding experimental values for the crack growth trajectory.
2.
Developed Program Criteria and Mesh Refinements
In this work, the unstructured triangle mesh is automatically generated by using the advancing front method [18]. For more accurate control for the geometrical characteristics such as the element size, element stretching and stretching directions for the new mesh, the background mesh should be generated. Here the strategy taken to generate the background mesh is to utilize all the initial boundary nodes of geometry and construct the boundary triangles as the background mesh by the dichotomy technique [19, 9]. Adaptive subdomain remeshing techniques add each crack advance segment by modifying the current finite element mesh. This is done by removing elements and nodes in a region ahead of the current crack tip and replacing them with smaller elements along the crack faces to be added. These additional elements typically include a small structured rosette of elements at the new crack tip location. The remaining space between is filled with additional elements Insufficiently robust mesh modification algorithms can cause premature termination of a progressive fracture simulation.[20]. Merely a geometric updating of a crack path during each simulation step because cracks are not represented explicitly in an adaptive mesh. This direct method has been extended to represent multiple cracks without the need for mesh refinement between crack tips [21]. Namely, there are three criteria used for prediction of the crack path, the maximum circumferential stress criterion, the maximum energy release rate criterion and the minimum strain energy density criterion [22]. In the present study, the maximum circumferential stress criterion is exploited for isotropic materials under mixed-mode loading [9,11]. In the maximum circumferential stress criterion, crack propagation is observed in the normal direction of maximum tangential tensile stress given by:
2
1
3
cos
cos
sin
2
2
2
2
r
K
IK
II
=
−
(1)The normal direction to the maximum tangential stress can be obtained by solving d/d=0 for
. The nontrivialsolution is expressed as:
(
)
sin
3cos
1
0
I II
K
+
K
− =
(2) Where the crack growth angle
is given by:
2 2 2
1
2 2
3
8
cos
9
II I I II
I II
K
K
K
K
K
K
=
−
+
+
+
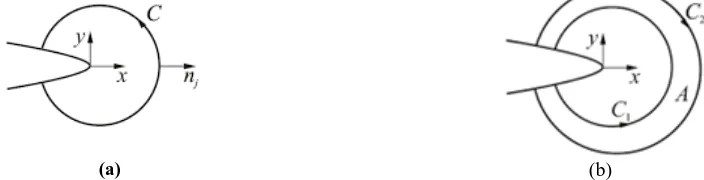
(3)In 1968 Rice introduced J-integral to study non-linear material behavior in small scale yielding. It is a path independent contour integral defined as:
1
i ij j c
u
J
W n
n
ds
where strain-energy density is denoted by W; stresses by ij; the displacements corresponding to local i-axis
u
i; arclength of the contour is expressed as s ; nj is the unit outward normal to the contour C, surrounding the crack tip
(Figure 1a).
(a) (b)
Figure 1: (a) Arbitrary contour containing the crack tip; (b) Area to calculate the J-integral
The Equivalent Domain Integral Method being more convenient for finite element analyses replaces finite size domain by the divergence theorem by the integration along the contour. For two-dimensional problems area integral replaces the contour integral i (Figure 2b). Then, equation (4) is rewritten as:
ij
i i i
k ij i
A A s
W
q
u
q
W
u
u
J
dA
qdA
t
qds
x
x
x
x
x
x
x
= −
−
−
−
−
(5)In linear elastic analysis, the J-integral by definition take account of translational mechanical energy balance in front of the crack along the x-axis. In either cases of pure Mode I and Mode II, equation (5) facilitate the calculation of the stress intensity factors KI or KII but fails for mixed mode condition to calculate KI and KII separately. For such case
invariant integrals are used as defined by Knowles and Sternberg [23] as:
ij ij
i i i
k i
k k j k j k k
A A s
W
q
u
q
Wq
u
u
J
dA
qdA
t
qds
x
x
x
x
x
x
x
= −
−
−
−
−
(6)where k is an index for local crack tip axis (x, y). These integrals were introduced initially for small deformation and were extended by Atluri [24] for finite deformation. The stress intensity factors can be obtained by two possible ways. The first approach is through relationships between the J-integral and the stress intensity factors. These relations are:
2 2 1 2
1
(
)
8
1
4
I II I IIJ
K
K
J
K K
+
=
+
+
= −
(7)The second approach is through the relations between the stress intensity factors and J J1, 2 as:
1 2 1 2
1 2 1 2
8
0.5
(
)
1
8
0.5
(
)
1
I
II
K
J
J
J
J
K
J
J
J
J
=
−
+
+
+
=
−
−
+
+
(8)3.
Simulation Results and Discussion
In this section, the crack path and other fracture parameters will be computed for seven modified compact tension specimens with different geometrical parameters based on the hole position as shown in table 1. The simulation for each geometry is performed in both developed source code and ANSYS Mechanical. In this study, the tested material is 7075-T6 aluminum alloy, which is widely used in the manufacturing of structural components in the aerospace industry. The material Young’s modulus is 72 GPa, and its Poisson’s ratio is 0.3, as well as a material fracture toughness KC of 29.66 MPa m1/2. The graphical representation of the specimen is shown in Figure 2, and the thickness
and the shortest distance from its edge to the symmetrical axis of specimen equals v1. For the hole with d2 diameter, its
corresponding values are h2 and v2, respectively [24].
Table 1: Geometrical parameters for specimens.
Specimen Hole parameters (Zhang, Zhang et al. 2016)[24]
d1 h1 v1 d2 h2 v2
G1 … … … …
G2 8 6.5 3 … … …
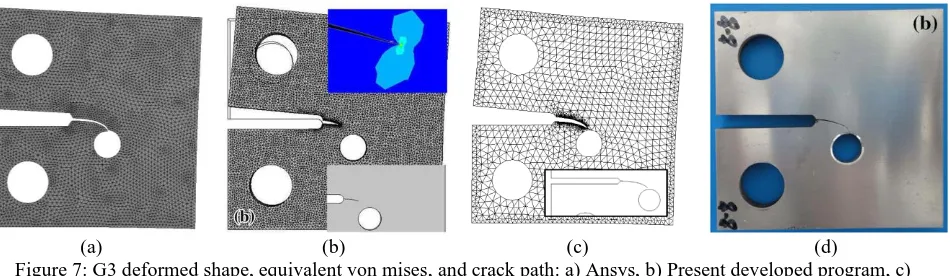
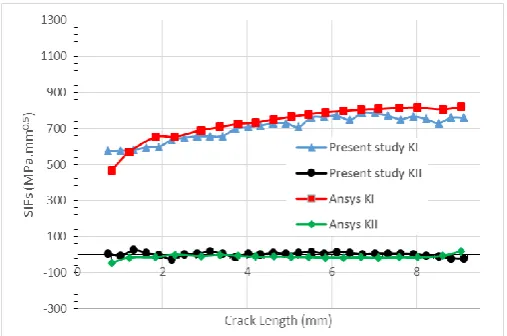
G3 8 10.5 3 … … …
G4 8 14.5 3 … … …
G5 2 6.5 3 … … …
G6 4 6.5 3 … … …
G7 5 6.5 3 5 6.5 3
Figure 2: Schematic of the specimen
To evaluate the effect of holes on the fatigue crack growth path, a series of specimens with different holes are obtained with altering its sizes and locations, which are shown in Table 1 in details. In the first set in Table 1, two specimens are utilized. One specimen without any hole is referred to as G1, and the other with a drilling hole is denoted as G2. For specimen G2, the hole diameter d1 is 8 mm. Its horizontal distance h1 and vertical distance v1 are 6.5 mm and 3 mm, respectively. In the top 12.3 mm hole of each geometry a constant amplitude loading of 3 KN with cyclic load ratio R=0 is applied, whereas the structure is clamped at the bottom 12.3 mm hole and the displacements and rotations of all nodes along its boundary were fully constrained. The fatigue crack growth path predicted by Ansys Workbench and the developed source code program for G1is depicted in Figure (3) and compared with the experimental and numerical results using Franc3D software performed by [24] which almost identical. The number of cycles computed by the Ansys Program for G1 was 44803 with a crack length of 18.14 mm while in Franc3D ((Zhang, Zhang et al. 2016 [24])) it was 11765 cycles and a crack path length of 11.9 mm.
The quality of the mesh plays a significant role in the accuracy and stability of the numerical computation. Regardless of the type of mesh used in your domain, checking the quality of your mesh is essential. One important indicator of mesh quality that ANSYS allows you to check is a quantity referred to as the orthogonal quality. The mesh quality is always dependent on the aspect ratio. The aspect ratio is a measure of the stretching of a cell. It is computed as the ratio of the maximum value to the minimum value of any of the following distances: the normal distances between the cell centroid and face centroids (computed as a dot product of the distance vector and the face normal), and the distances between the cell centroid and nodes. The aspect ratio is differed based on the mesh density which will be higher in the area around the crack tip for accurate prediction of stress intensity factors and other stresses distribution. The mesh generated for the G1 in Present developed program is 4968 nodes with 2341 elements while for Ansys it is 160678 nodes and 112090 elements. Figure 4 shows the calculated values of stress intensity factors for mode I and mode II (KI and KII) with respect to the crack length. There is approximately 3% difference between the mode values
computed for both programs. The range of KI in Present developed program is 624 to 1068 MPa.mm0.5 while in Ansys
it ranges between 587 to 998 MPa.mm0.5.
In the G2 geometry a hole 8 mm in diameter is introduced. It is placed at h1= 6.5 mm away from the crack tip, and
from the center line v1= 3 mm, figure 4.30. The K1 of all nodal points along the crack front goes beyond the KC mentioned,
moves through, the crack will propagate towards to the hole and so the fatigue crack path deviates due to the attraction of the hole as shown in Figure 5.
(a) (b) (c) (d)
Figure 3: G1 deformed shape and crack path: a) Ansys WB., b) Present developed program, c) Franc3D [24], d) Experimental Work [24]
Figure 4: SIFs relation with the crack length, specimen G1.
(a) (b) (c) (d)
Figure 5: G2 deformed shape, equivalent von mises, crack path: a) Ansys, b) Present developed program, c) Franc3D [24], d) Experimental work [24].
For the simulation of specimen G2, there is a 0.57% difference in the stress intensity factors computed between the Ansys program and the developed program as shown in Figure 6. The mesh density in the present developed program is 4955 nodes and 2327 elements while in Ansys, 176831 nodes and 120910 elements. To further evaluate the effect of a small holes on the crack growth direction, G3 specimen has an 8 mm diameter hole at position h1 = 10.5 and v1 is the
Figure 9 shows the effect of the crack path when the hole becomes further away from the crack front. In specimen G4, the 8 mm diameter is positioned at a distance, h1 = 14.5 mm. It can be noticed for the G4 specimen that the crack
path started straight and since the hole is in the path of the crack, the path deviated towards the hole. The predicted paths in both Ansys and Present developed program is almost a replica of the experimental and Franc3D work done by respectively [24]. The Ansys predicted values are 46314 cycles and a crack length of 14.618 mm while Franc3D values were 4716 cycles and a 6.7 mm crack length obtained by [24]. The KI range in Present developed program for
specimen G4 is from 607 to 1072 MPa.mm0.5, for Ansys it ranges between 478 to 1196 MPa.mm0.5 (Figure 10). This
differnce is not an error difference but rather the KI at the initial crack length and the crack tip at the end of the crack
length. There is a 1.19 % difference between the mode 1 values at the same crack length. The mesh generated for the G4 specimen in Present developed program is 4943 nodes and 2321 elements while in Ansys a mesh with element size 2 mm, 166881 nodes, and 114429 elements.
Figure 6: G2, stress intensity factors relationship with the crack length.
(a) (b) (c) (d)
Figure 7: G3 deformed shape, equivalent von mises, and crack path: a) Ansys, b) Present developed program, c) Franc3D [24], d) Experimental work [24].
In order to see the effect of the hole size, the size of d1 was reduced to 2 mm in diameter for the G5 specimen. The
h1 and v1 is identical to that of G2. The fatigue crack growth can be seen to be almost straight but when it comes in the
range of the 2 mm hole, it deviates slightly and then returns to its original path as shown in Figure 11. The programs show a good agreement with the experimental work of [24]. Number of cycles computed in Ansys was 52116 with a crack length of 8.8 mm while in Franc3D it was 6018 cycles and 9.1 mm [24].
For specimen G5, in Present developed program the number of nodes and elements are 5448 and 2566, respectivily. While in Ansys it is 175255 nodes and 120570 elements. The range of KI in Present developed program is
between 577 and 880 MPa.mm0.5, Ansys has a range from 544 to 857 MPa.mm0.5 .as shown in Figure 12. The
difference in the SIF values is 3.2 %.
For the specimen G6, the size of d1 is 4 mm and has h1 of 6.5 mm. From Figure 13 it can be noticed that the fatigue
crack path as in G5 is influenced slightly by the hole but continues back in an approximately straight line. All three programs predicted the right crack path as shown in comparison with the experimental work. The graphical results for Franc3D displayed in Figure 13(c) show that the number cycles come to 5519 cycles and the stable crack length of the path is 9.8 mm while for Ansys it was 44968 cycles and a crack length of 9.0427 mm. Figure 14 shows the predicted stress intensity factor modes one and two obtained in both Present developed program and Ansys. The KI range in
Present developed program is from 575 to 760 MPa.mm0.5 while for Ansys it is from 467 to 821 MPa.mm0.5.
mesh density. For Ansys the geometry has a generated mesh of 170240 nodes and 116364 elements. While in Present developed program, 5137 nodes and 2411 elements.
Figure 8: Specimen G3 simulation, SIFs vs crack length.
(a) (b) (c) (d)
Figure 9: G4 deformed shape, equivalent von mises and crack path: a) Ansys, b) Present developed program, c) Franc3D [24], d) Experimental work [24].
Figure 10: Mode I and II relation with crack length in specimen G4.
(a) (b) (c) (d)
Figure 12: SIFs relation with the crack length in specimen G5.
(a) (b) (c) (d)
Figure 13: G6 deformed mesh, equivalent von mises, and crack path: a) Ansys, b) Present developed program, c) Franc3D [24], d) Experimental work [24]
Figure 14: The computed KI and KII relationship with the crack length in specimen G6
To get a better picture on the effects of the hole on the crack path, two holes are introduced in specimen G7. The holes are of 5 mm in diameter and at equal spacings from each other and the crack front. In the following condition, the number of cycles obtained in Ansys is 57762 and a crack length of 19.638 mm while for Franc3D it was 7211 cycles and a crack growth of 10 mm. Figure 15 shows that the crack path for in this specimen is almost straight just like in G1, but what changed is the number of cycles and fatigue life of the specimen which increased drastically.
G7, a geometry with two 5 mm diameter holes at equal distances from other and along the crack path has a K1
range from 640 to 898 MPa.mm0.5 computed in Present developed program while in Ansys the mode 1 ranged from 526
to 898 MPa.mm0.5 as shown in Figure 16. The crack length obtained in Present developed program was 10.37 mm and
(a) (b) (c) (d)
Figure 15: G7 deformed shape, equivalent von mises, crack path: a) Ansys, b) Present developed program, c) Franc3D [24], d) Experimental work [24]
Figure 16: G7, KI and KII with crack length.
Conclusion
It can be concluded that there is almost slightly difference in performing a fracture mehcanics simulation for crack growth in both two- or three- dimensions. Sometimes it wouldn’t be ideal to perform a simulation on a complex geometry in 2D and hence the need for 3D. Two dimensional analysis provides a better computational time than 3D as well as giving the ablity to generate a more finer mesh on the geometry due to avaliable computational power. The predicted values of stress intensity factors in both 2D and 3D are almost the same with a slight percentage of error which can eliminated by using higher mesh density in the two-dimensional program. The holes size and position are affected the crack trajectory as well as the values of stress intensity factors.
References
[1] Tada, P. (2001). Paris, and GR Irwin. The Stress Analysis of Cracks Handbook: 2.25.
[2] Al Laham, S. and S. I. Branch (1998). Stress intensity factor and limit load handbook, British Energy Generation Limited.
[3] Infante, V. and J. Silva (2011). Case studies of computational simulations of fatigue crack propagation using finite elements analysis tools. Engineering Failure Analysis 18(2): 616-624.
[4] Zaidi A.M.A, Asif, M.M.Md, Abdulraman I, Mohiden S.R., Zaidi A.F., Azidi, N.H.A, (2009), Finite element simulation on crack analysis of a thick-tube. International Journal of Integrated Engineering, 1 (1):67-71.
[5] Mobasher, M. E. and H. Waisman (2016). Adaptive modeling of damage growth using a coupled FEM/BEM approach. International Journal for Numerical Methods in Engineering 105(8): 599-619.
[6] Ismail AE, Saifulnizan Jamian, KamarulAzhar Kamarudin, Mohd Khir Mohd Nor, Mohd Norihan Ibrahim, Moch. Agus Choiron (2018). An Overview of Fracture Mechanics with ANSYS, International Journal of Integrated Engineering, Mechanical Engineering, 10 (5 ): 59-67.
[7] Ismail, A.E., Ariffin, A.K., Abdullah, S., and Ghazali, M.J. (2017). Finite element analysis of J-integral for surface cracks in round bars under combined mode I loading. Int. Journal of Integrated Engineering, 9: 1-8. [8] Ren, D. L., S. Wan and Z. P. Zhong (2012). K Value Calculation of Central Crack Plane Using FRANC2D, Trans
[10] Alshoaibi, A. M. (2015). "An Adaptive Finite Element Framework for Fatigue Crack Propagation under Constant Amplitude Loading." International Journal of Applied Science and Engineering 13(3): 261-270.
[11] Alshoaibi, A. M. (2018). "A Two Dimensional Simulation of Crack Propagation using Adaptive Finite Element Analysis." Journal of Computational Applied Mechanics 49(2): 335.
[12] Rooke, D. P. and D. J. Cartwright (1976). Compendium of stress intensity factors. Procurement Executive, Ministry of Defence. H. M. S. O. 1976,
[13] Sih, G. C. (1973). Handbook of stress-intensity factors: Stress-intensity factor solutions and formulas for reference. Bethlehem, Pa., Lehigh University,
[14] Broek, D. (2012). The practical use of fracture mechanics, Springer Science & Business Media.
[15] Benamara, N., et al. (2017). "On the mixed-mode crack propagation in FGMs plates: Comparison of different criteria." Structural Engineering and Mechanics 615(3): 371-379.
[16] Soman, S., et al. (2018). A simple technique for estimation of mixed mode (I/II) stress intensity factors. Journal of Mechanics of Materials and Structures 13(2): 141-154.
[17] Yaylaci, M. (2016). The investigation crack problem through numerical analysis. Structural Engineering and Mechanics 57(6): 1143-1156.
[18] Löhner, R. (1997). Automatic unstructured grid generators. Finite Elements in Anal and Design 25(1-2): 111-134. [19] Alshoaibi, A. M., M. Hadi and A. Ariffin (2007). Two-dimensional numerical estimation of stress intensity
factors and crack propagation in linear elastic Analysis. Journal of Structural Durability and Health Monitoring (SDHM) 3(1): 15-27.
[20] Miller, E., M. Sutton, X. Deng, H. Watts, A. Reynolds, X. Ke and H. Schreier (2015). Experimental and predicted crack paths for Al-2024-T351 under mixed-mode I/II fatigue. Fracture, Fatigue, Failure, and Damage Evolution, Volume 5, Springer: 11-20.
[21] Lan, M., H. Waisman and I. Harari (2013). A High‐order extended finite element method for extraction of mixed‐mode strain energy release rates in arbitrary crack settings based on Irwin's integral. International Journal for Numerical Methods in Engineering 96(12): 787-812.
[22] Belytschko, T. and T. Black (1999). Elastic crack growth in finite elements with minimal remeshing. International journal for numerical methods in engineering 45(5): 601-620.
[23] Knowles, J. K. and E. Sternberg (1972). On a class of conservation laws in linearized and finite elastostatics. Archive for rational mechanics and analysis 44(3): 187-211.
[24] Atluri, S. N. (1982). Path-independent integrals in finite elasticity and inelasticity, with body forces, inertia, and arbitrary crack-face conditions. Engineering Fracture Mechanics 16(3): 341-364.
![Table 1: Geometrical parameters for specimens. Hole parameters (Zhang, Zhang et al. 2016)[24]](https://thumb-us.123doks.com/thumbv2/123dok_us/8434665.1699042/4.595.167.430.117.379/table-geometrical-parameters-specimens-hole-parameters-zhang-zhang.webp)
![Figure 3: G1 deformed shape and crack path: a) Ansys WB., b) Present developed program, c) Franc3D [24], d) Experimental Work [24]](https://thumb-us.123doks.com/thumbv2/123dok_us/8434665.1699042/5.595.67.544.240.602/figure-deformed-ansys-present-developed-program-franc-experimental.webp)
![Figure 11: G5 deformed shape, equivalent von mises, and crack path: a) Ansys, b) Present developed program, c) Franc3D [24], d) Experimental work respectively [24]](https://thumb-us.123doks.com/thumbv2/123dok_us/8434665.1699042/7.595.62.546.102.404/figure-deformed-equivalent-present-developed-program-experimental-respectively.webp)
![Figure 15: G7 deformed shape, equivalent von mises, crack path: a) Ansys, b) Present developed program, c) Franc3D [24], d) Experimental work [24]](https://thumb-us.123doks.com/thumbv2/123dok_us/8434665.1699042/9.595.169.429.245.408/figure-deformed-equivalent-present-developed-program-franc-experimental.webp)
