Network Security Risk Assessment Based on Item
Response Theory
Fangwei Li
Chongqing Key Lab of Mobile Communications Technology Chongqing University of Posts
Telecommunications Chongqing, China
[email protected]
Qing Huang
Chongqing Key Lab of Mobile Communications Technology Chongqing University of Posts
Telecommunications Chongqing, China
[email protected]
Jiang Zhu
Chongqing Key Lab of Mobile Communications Technology Chongqing University of Posts
Telecommunications Chongqing, China
[email protected]
Zhuxun Peng
Chongqing Key Lab of Mobile Communications Technology Chongqing University of Posts
Telecommunications Chongqing, China
[email protected]
ABSTRACT
Owing to the traditional risk assessment method has one-sidedness and is difficult to reflect the real network situ-ation, a risk assessment method based on Item Response Theory (IRT) is put forward in network security. First of all, the novel algorithms of calculating the threat of attack and the successful probability of attack are proposed by the combination of IRT model and Service Security Level. Sec-ondly, the service weight of importance is calculated by the three-demarcation analytic hierarchy process. Finally, the risk situation graph of service, host and network logic layer could be generated by the improved method. The simulation results show that this method can be more comprehensive consideration of factors which are affecting network security, and a more realistic network risk situation graph in real-time will be obtained.
Categories and Subject Descriptors
D.4.6 [Operating Systems]: Security and Protection; C.2.3
[Computer-Communication Networks]: Network
Op-erations—Network monitoring
General Terms
SecurityKeywords
IRT, hierarchical model, risk assessment, network security
.
1.
INTRODUCTION
Network security situation awareness [7] is a new security technology which is based on the analysis of historical data and the detection of current network security status. Net-work security situation assessment is the important bond between the obtainment of situation elements and the pre-diction of trend in network security situation awareness. To solve wireless network risk evaluation problems, a four-layer of wireless network risk assessment mechanism was proposed by the characteristics of different configuration [10]. Concur-rently, some traditional assessment methods only considered the influence of vulnerability by scanning in the network but not safety measures [1, 13]. In fact, the threat of network is the inherent vulnerability threat after taking safety mea-sures. Moreover, the threat of attack is defined too broad in most methods of risk assessment [9, 5].
This paper puts forward a method of combining item re-sponse theory with the hierarchical network risk assessment model. It will solve some problems. Firstly, the lack of objectivity in the successful probability of attack will be improved by the system information, Common Vulnerabil-ity Scoring System (CVSS) [2, 8] and the safety measures. Next, the concept of attack ability is proposed by item re-sponse theory and the discrimination of threat of attack is improved. Following this, with the three-demarcation ana-lytic hierarchy process [12] to calculate the service weight of importance, the accuracy will be improved. The last, the risk situation graph of service, host, and network logic layer are draw by analyzing each layer of the risk situation.
2.
NETWORK SECURITY RISK
ASSESSMEN-T BASED ON IASSESSMEN-TEM RESPONSE ASSESSMEN-
THEO-RY
Item response theory [4, 3, 11] is also called the latent trait theory, widely used in pedagogy and originated by the American psychological statistician Frederic M. Lord. It is a kind of method by estimating the tester ability and linking
MOBIMEDIA 2015, May 25-27, Chengdu, People's Republic of China Copyright © 2015 ICST
CVSS vulnerability
dataset
Attack Successful Probability (AP)
Risk of service (SR)
The threat of attack
(TV) Risk of host
(HR) Risk of network
(NR)
Service Security Level
(SL)
Attack ability (Ĭ)
Defensive intensity
Threat factor
(TD) Attack ability (Ĭ)
The weight of importance of host
(HW)
The degree of importance
in the host The weight of importance of service
(SW)
The access frequency the average
number of visits
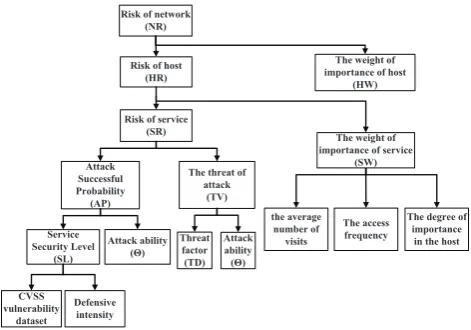
Figure 1: The Real-time Network Security Risk As-sessment Framework
the reaction probability of tester for each project.
2.1
The Real-time Network Security Risk
As-sessment Framework
In order to scientifically evaluate the network security and effectively manage risk accident, some measures should be taken. Network security situation risk is displayed by risk situation graph, and then we can focus on protecting high risk of service or host. As the size of network expands in real life constantly, the network system(System), from the bot-tom to up, is divided into vulnerability logic layer (Vulner-ability), service logic layer (Service), host logic layer (Host) and network logic layer (Network), and is given as follows:
System=RV∪RS∪RH∪RN (1)
whereRV =∪Rviis a set of vulnerability logic layer
prop-erties which reflects the degree of difficulty to attack service by the existing vulnerabilities in the services the complexity of attack and the conditions of attack.
whereRS=∪Rsi is a set of service logic layer properties
which reflects the risk situation of attacked service by service category, quantity and degree of importance in the hosts.
where RH =∪Rhi is a set of host logic layer properties
which reflects the risk situation of working host by host cat-egory, quantity and degree of importance in the network.
whereRN is a set of network logic layer properties which
represents the polymerization of logical layer.
The real-time network security risk assessment framework is shown in Figure 1.
Based on the alarm information of IDS, target network topology and vulnerability information, combining with the rule base, the risk situation is evaluated from service logic layer to network logic layer.
The following are four basic definitions in the process of assessing.
Definition 1. Attack alarm (A): The behaviors which can trigger IDS alarm information are called attack alarm. It can be expressed as A ={ID, Time, Type, SIP, DIP, SP, DP}, where ID is serial number of attack event, Time is its time occurring, Type is the type of attack activity, SIP and SP are IP address and port number of attack source respectively, DIP and DP are IP address and port number
of attack destination respectively.
Definition 2. The service weight of importance (SW): SW reflects the degree of important service in the host, which depends on effect from the average number of visits, access frequency and degree of importance in the host. SWiis the iservice weight of importance and is expressed as follows:
SWi=
SIi
n
∑
k=1
SIk
(2)
where SIi is the importance of iservice, n is the total
number of running services in the host.
Definition 3. Attack Successful Probability (AP): Attack Successful Probability is the successful possibility of attack which utilizes service vulnerabilities and performs dangerous activities.
Definition 4. Defensive intensity (I): Defensive intensity is the degree of obstruction to the security protection mea-sures taken on attack.
2.2
The Threat of Attack Algorithm Based on
Item Response Theory
The threat of network attack is mainly divided into two parts: the one is for the user permissions, including fake user identity legitimacy and illegally elevate permissions to steal or distort the information of server; the other is a malicious traffic shock for the network function, which uses a large number of service requests to consume service resources, as a result, the server is difficult or impossible to handle the le-gitimate user requests. The threat of network attack adopts the algorithms of [9] and [5], which uses the threat factor to define the threat of attack on service, by distinguishing port scan attack, denial of service, elevated privileges and the remote user attack to define all kinds of attack. Then the threat factor is regarded as a major factor in judging the threat of attack.
However, we consider the different behaviors of attack in the same type of attack, they may be different in the threat of attack. In order to improve the discrimination of the traditional threat of attack, the concept of attack ability is proposed by item response theory and a new threat of attack formula is redefined as formula (4).
T Vi= 10T Fi
θi+ 4
7 (3)
where θi is the ability of i attack which is determined
by the parameter estimation from single parameter logistic function and attack response matrix;T Fiis the threat factor
ofiattack which is separately quantized as digits 1∼3.
2.3
Attack Successful Probability Algorithms
Based on Item Response Theory
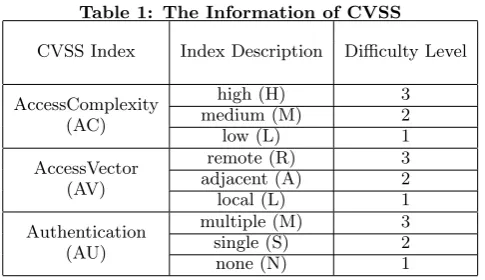
Definition 5. Service Security Level (SL): the degree of obstruction which is appeared after attacking is referred to Service Security Level. It is constituted by the vulnerability information (C) and Defensive intensity (I). The vulnerabil-ity information is determined by CVSS, as shown in Table 1, and the formula is defined asC= AC+AV3 +AU . Defensive intensity is listed in Table 2.
According to the above analysis, Service Security Level is defined as formula (5), at the same time, combined with a single parameter Logistic model of item response theory, Attack Successful Probability is put forward as formula (6).
SLj= 3(λ1Cj+λ2Ij−2) (4)
APij={1 + exp[−D(θi−SLj)]}−1 (5)
where λ1 and λ2 show that the vulnerability and secu-rity measures accounts for the proportion in service safe-ty respectively, through the past experience,λ1 = 0.4 and
λ2= 0.6;θiindicates that the ability ofiattack;D=1.702 is
a constant. With the passage of time, new attacks will be de-tected, the original attack response matrix will be changed and the attack ability will be updated. Thus, the threat of attack and Attack Successful Probability can realize the real-time updating.
Table 1: The Information of CVSS
CVSS Index Index Description Difficulty Level
AccessComplexity (AC)
high (H) 3
medium (M) 2
low (L) 1
AccessVector (AV)
remote (R) 3
adjacent (A) 2
local (L) 1
Authentication (AU)
multiple (M) 3
single (S) 2
none (N) 1
3.
HIERARCHICAL NETWORK RISK
AS-SESSMENT MODEL
3.1
The Factor of Risk Weight
According to the factors that affect the service perfor-mance, the importance of service is mainly decided by the average number of visits, access frequency, degree of im-portance in the host and is calculated by the algorithm of three-demarcation analytic hierarchy process. We establish a process of calculating weight step by step from index layer to target layer.
Table 2: The Information of Defensive Intensity
Defend Defensive Measures Description Intensity
Low No measure 1
Medium Defensive measures is not obvious 2 High Targeted defense measures 3
a) Establish comparison matrix
zij=
2 when zi is more important than zj
1 when zi is the same important as zj
0 when zi is less important than zj
(6)
where zi is the index layer or criterion layer evaluation,
and zi ∈ Z(i = 1,2, ..., n) , zij indicates the relative
importance betweenzi andzj.
b) Establish judgment matrix
qij=
{
ei(
ri−rj
rmax−rmin) (ri≥rj)
1/[ei( rj−ri
rmax−rmin)] (ri< rj)
(7)
whereriis represented as the sum of comparison matrix
element in each row, rmax, rmin signify the maximum value and the minimum value ofri; The judgment matrix
Q=∪qij(i, j= 1,2, ..., n),ei is a constant that reflects
the relative importance in a certain standard. ei= 9 is
often taken in practical application.
c) Calculate weight of importance
wi= n
v u u t∏n
j=1
qij (8)
¯
wi=
wi
n
∑
i=1
wi
(9)
By formula (9), (10), and the test of consistency, we get ¯
w= ( ¯w1,w2¯ ...w¯n)T.
¯
wsrv=
3
∑
s=1 n
∑
p=1
¯
wsw¯p (10)
¯
whost=
n
∑
i=1
¯
wsrvi (11)
Design ¯ws, ¯wpas index and criterion layer weight
respec-tively. ¯wsrv is the weight of service in target layer. ¯whost
is the weight of host.
3.2
The Value of Risk Situation
Risk situation represents the extent of harm caused by attack in the network, it can be assessed by the threat fac-tor, the attack ability, the Attack Successful Probability, the weight of importance and other factors. As the value of risk situation increases, the danger of network also increases.
Definition 6. Risk of service (SR): within the time (t, t+ ∆t), the number of attack in serviceSi(0 ≤i≤m) isNi.
Attack Successful Probability is APi. The number of type
k(0≤ k ≤n) attack is Nik, and it satisfies Ni = n
∑
k=0
Nik.
Threat factor and the attack ability of typek areT Fk and θk. The risk situation of service Si is defined as formula
(13).
SRSi=
n
∑
k=1
(Nik10T Fik
θik+ 4
Definition 7. Risk of host (HS): within the time (t, t+∆t),
ukinds of services run in the hostHg(1 ≤g≤v) and the
weight of service isSi(0≤i≤u). The risk situation of host Hg is defined as formula (14).
HRHg =
u
∑
i=1
(SRSiw¯srvi) (13)
Definition 8. Risk of network (NS): within the time (t, t+ ∆t), v kinds of hosts are running in the network and the weight of host is Hg(1 ≤ g ≤ v). The risk situation of
network is defined as formula (15).
N R=
v
∑
g=1
(HRHgw¯hostg) (14)
4.
EXPERIMENT RESULTS ANALYSIS AND
COMPARISON
In order to verify scientific and comprehensive of the pro-posed method, the simulation platform of laboratory is used to collect network data in two months from July 1, 2013 to August 31, 2013 and dynamically analyze the risk of vulner-able host.
4.1
The Three-demarcation Analytic
Hierar-chy Process to Calculate the Weight of
Im-portance
Service information and vulnerability information are used to our experiment data. The target layer expresses the im-portance of service; the criterion layer represents the value of the average number of visits, access frequency and de-gree of importance in the host; the index layer signifies the service whose importance will be calculated. By the expe-rience, we respectively define the degree of importance, the access frequency and the average number of visits in the host for the [0.6 0.2 0.2]. The host whose IP is 192.168.0.1 and exits vulnerability is taken as an example to analyze. There are four kinds of service in the host such as DNS, WWW, FTP, SMTP. The weights of criterion layers are respectively listed asB1 = [0.1376 0.5132 0.2751 0.0741],B2 = [0.0989 0.5183 0.2839 0.0989],B3 = [0.0989 0.2839 0.5183 0.0989]. Based on this method, we can calculate the service and host weight of importance as shown in Table 3.
Through the data analysis, the three-demarcation ana-lytic hierarchy process is not only reduces the complexity of the nine-demarcation analytic hierarchy process [6], but also avoids the fuzzy of weight when constructing the judgment matrix.
4.2
The Threat of Attack and Attack
Success-ful Probability
By the above definition on the threat of attack and Attack Successful Probability algorithms, we take the information from service, vulnerability and attack alarm in July as the basic of data. After statistical analysis, there are 7 kinds of service in the network attacked by 12 kinds of attacks. We use the parameter estimation method in item response the-ory to get the attack ability and calculate Attack Successful Probability as shown in formula (4). The proposed method and the conventional methods of the threat of attack are indicated in curves of Figure 2.
In order to achieve the real-time risk situation, we count the number of attack for August each day. If there is a new
The behavior of attack
T
h
e
t
h
r
e
a
t o
f a
tt
a
c
k
the Ref.[9] method the proposed method
Figure 2: Comparison of the Threat of Attack with Two Methods
attack which has not been appeared last month, it will be added to the original attack response matrix. At the same time, the probability matrix and the threat of attack will be updated.
4.3
Network Risk Assessment in Real Time
With the data of network in August 2013, the improved risk assessment algorithm is used to calculate the risk of whole network every other day. Then, we can draw a one-month trend curve of risk and make a decision.Time(day)
Ri
sk
s
it
u
a
ti
o
n
WWW FTP Telnet
Figure 3: Risk of Services in Real Time
Time(day)
Ri
sk
s
it
u
a
ti
o
n
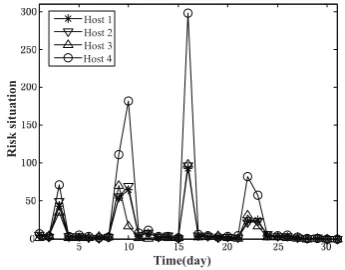
Host 1 Host 2 Host 3 Host 4
Table 3: Network Configuration and the Distribution of the Weight
Host IP (192.168.) Operating System Running Service Service Importance Weight Host Importance Weight
0.1 Windows XP
DNS 0.10664
0.2604
WWW 0.37664
FTP 0.42278
SMTP 0.09394
1.4 Windows XP
WWW 0.40570
0.2339
FTP 0.18288
ORACLE 0.41142
2.5 Red Hat Linux
DNS 0.32572
0.2228
POP3 0.42858
SMTP 0.42572
2.7 Windows 2000
WWW 0.31074
0.2829
TELNET 0.43302
DNS 0.10734
FTP 0.08344
ORACLE 0.06543
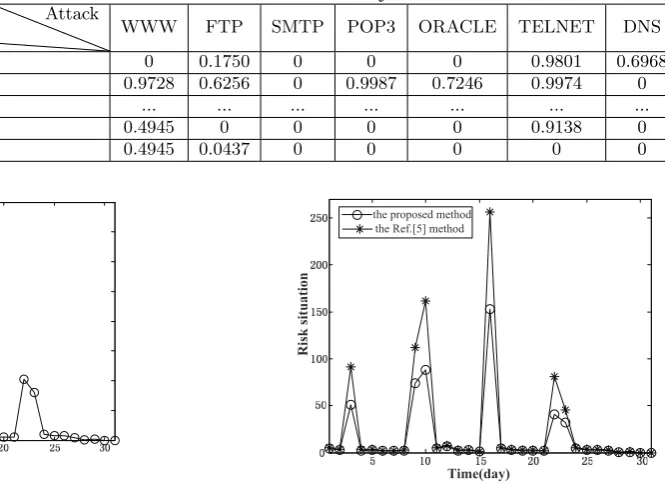
Table 4: Attack Successful Probability
Service
Attack Successful Probability Attack
WWW FTP SMTP POP3 ORACLE TELNET DNS
Ipsweep(1) 0 0.1750 0 0 0 0.9801 0.6968
Nmap(2) 0.9728 0.6256 0 0.9987 0.7246 0.9974 0
... ... ... ... ... ... ... ...
Guess passwd(11) 0.4945 0 0 0 0 0.9138 0
Warezmaster(12) 0.4945 0.0437 0 0 0 0 0
Time(day)
R
is
k
s
it
u
a
tio
n
Network risk
Figure 5: Risk of Network in Real Time
Figures 3, 4, 5 respectively show the variation of risk sit-uation in service logic layer, host logical layer and network logical layer in August. The risk situation of WWW, FTP and TELNET are indicated in Figure 3. We can see the ser-vice of TELNET is the most serious attack on the month, the service of WWW Secondly and the lowest risk of attack is the service of FTP. There are four hosts which have some vulnerability in the network and the risk situation of them is exhibited in Figure 4. We know that the risk of host 4 is the largest, and the risk of the remaining three hosts is similar. The risk situation of whole network is shown in Figure 5. Through the analysis of the above three figures, network attacks are occurred, for the most part, focusing on the weekend, so we believe that the attackers are likely have
Time(day)
Ri
sk
s
it
u
a
ti
o
n
the proposed method the Ref.[5] method
Figure 6: Comparison of Network Risk Assessment with Two Methods
legitimate careers, such as on-the-job workers or students.
4.4
The Comparison of Network Risk
situation in method [5] is higher than that of the proposed method. In fact, some attacks do not successfully harm to the network and the calculation of the threat of attack is imprecise. For example, a few days with high differenti-ation in security could have used several different decisions on network protection, but the gap between the results from conventional methods may not be obvious and use the same decision. So we can reduce the waste of resources by the proposed method. These issues will be easy to cause the phenomenon that the conventional methods can not reflec-t reflec-the real sreflec-tareflec-tus of nereflec-twork securireflec-ty, reflec-thus misleading reflec-the network security administrator, or even making the wrong decision. Accordingly with the method for risk assessment in this paper, quantitative risk situation is not only obtained, but also comprehensive and directive.
5.
CONCLUSION
In this paper, we have quantitatively analyzed the risk situation in service, host and network logic layer, and pro-posed a novel risk assessment method for network security based on item response theory. Compared with traditional methods, the advantages are exhibited as follow:
1) In contrast with the risk assessment by vulnerability com-ing from security detectcom-ing and scanncom-ing facilities, we have defined an assessment of security parameter by the combination of CVSS with Defensive intensity, so we can get more comprehensive and reasonable results.
2) Through the three-demarcation analytic hierarchy pro-cess to improve the accuracy of the importance weight.
3) Combining with item response theory, we propose a high-er degree of discrimination in the threat of attack algo-rithm and a more realistic Attack Successful Probability algorithm.
4) With the Attack Successful Probability and the threat of attack to update dynamically, we realize the real-time assessment of risk situation.
Due to the affected by the accuracy of the dataset, this method has certain limitations. The next work will be de-voted to improving the accuracy of the dataset in the large-scale network. We would like to obtain more comprehensive and more precise quantitative risk situation analysis.
6.
ACKNOWLEDGMENTS
This work was partially supported by the National Natu-ral Science Foundation of China (NO.61271260, NO.61301122) and the Science and Technology Research Project of Chongqing Education Commission (NO.KJ120530).
7.
REFERENCES
[1] M. Abedin, S. Nessa, and E. Al-Shaer. Vulnerability analysis for evaluating quality of protection of security policies. InProceedings of the 2nd ACM workshop on Quality of protection, pages 49–52, 2006.
[2] A. Ali, P. Zavarsky, D. Lindskog, and R. Ruhl. A soft-ware application to analyze the effects of temporal and environmental metrics on overall cvss v2 score. In In-ternet Security (WorldCIS), 2011 World Congress on, pages 109–113, 2011.
[3] F. Arnold, W. Pieters, and M. Stoelinga. Quantita-tive penetration testing with item response theory. In Information Assurance and Security (IAS), 2013 9th International Conference on, pages 49–54, 2013.
[4] S. Baldiris, R. Fabregat, and S. Graf. Learning object recommendations based on quality and item response theory. In Advanced Learning Technologies (ICALT), 2014 IEEE 14th International Conference on, pages 34– 36, 2014.
[5] X. Z. Chen, Q. H. Zheng, and X. H. Guan. Quanti-tative hierarchical threat evaluation model for network security. Journal of Software, 17(4):885–897, 2006.
[6] S. Fu and H. J. Zhou. The information security risk assessment based on ahp and fuzzy comprehensive e-valuation. In Communication Software and Networks (ICCSN), 2011 IEEE 3rd International Conference on, pages 124–128, 2011.
[7] Z. H. Gong and Y. Zhou. Research on cyberspace situa-tional awareness.Journal of Software, 21(7):1605–1619, 2010.
[8] M. Keramati, A. Akbari, and M. Keramati. Cvss-based security metrics for quantitative analysis of at-tack graphs. In Computer and Knowledge Engineer-ing (ICCKE), 2013 3th International eConference on, pages 178–183, 2013.
[9] G. Liu, Q. M. Li, and H. Zhang. Reliability vector or-thogonal projection decomposition method of network security risk assessment.Journal of Electronics and In-formation Technology, 34(8):1934–1938, 2012.
[10] H. Tsai and Y. L. Huang. An analytic hierarchy process-based risk assessment method for wireless networks. Re-liability, IEEE Transactions on, 60(4):801–816, 2011.
[11] H. Wang, J. Chen, and C. Q. Ma. Research on the improvement of irt item parameter estimation algo-rithm. In Computational Intelligence and Design (IS-CID), 2012 Fifth International Symposium on, vol-ume 1, pages 160–163, 2012.
[12] X. H. Wang and L. P. Zou. A decision model for ag-ile software release. InReliability, Maintainability and Safety (ICRMS), 2011 9th International Conference on, pages 766–770, 2011.