[Anastasiu * et al., 5(2): February, 2018]
ISSN: 2349-5197
Impact Factor: 3.765
I
NTERNATIONAL
J
OURNAL OF
R
ESEARCH
S
CIENCE &
M
ANAGEMENT
THE DECISION MAKING PROCESS IN CONSTRUCTION PROJECT
MANAGEMENT BY USING THE ELECTRE I METHOD
Livia Anastasiu*
*Civil Engineering and Management Department, Technical University of Cluj-Napoca, Romania
DOI: 10.5281/zenodo.1168806
Keywords: project management, outranking, Electre, decision making.
Abstract
The decision making process is essential in managing successful organizations. In conditions of certainty, the Electre I method is a tool which provides accurate resultsif an opportunity occurs. The construction sector in Romania is in real expansion, therefore the civil engineering companies face a real problem: many possible contracts, but not enough resources for all. The present paper aims to demonstrate the fact that, using historical data, an organization may decide from some variants, by outranking the possible portfolio projects. The main hypothesis is that Electre Iwill help the construction companies` managers to make proper decisions. We surveyed 20 companies specialized in civil engineering, asking them to choose between 4 projects, only by analyzing data. 85% of them have chosen the wrong variants. For ranking the same criteria for all projects, the Analytic Hierarchy Process was used. After computing the data using the Electre I algorithm, we could outrank the projects correctly. Therefore the hypothesis was validated. The limitation of the study is the number of subjects and the reference to Transylvania region, a part of Romanian territory.
Introduction
The civil engineering domain plays an important role in the global economy, representing an average of 6% of the world GDP [1]. It is a horizontal industry, the backbone for the existence of all the other vertical ones, like agriculture, manufacturing, commerce, or finance.
Figure 1. Construction industry GDP rate in Europe
Modern technologies are influencing the development of this specializations, since in the future they will rely on drones, BIM, GIS, 3D printing, robots, or non-polluting materials.
[Anastasiu * et al., 5(2): February, 2018]
ISSN: 2349-5197
Impact Factor: 3.765
I
NTERNATIONAL
J
OURNAL OF
R
ESEARCH
S
CIENCE &
M
ANAGEMENT
million people were hired in 2016. The main reason is that the number of employees over 60 years old is increasing, while the number of workers under 30 is decreasing dramatically. Therefore, there are some actions that may improve the actual situation [2]:
Attracting and retaining talents: the strategically planning`s priority should be the long term estimation of the number of employees on specialization, followed by recruiting, selection, retention and motivation.
Investment in technology and innovation: most of the construction companies keep using traditional methods. However, because this area is a strong polluting factor, the future trends, as well as the international regulations, will force for setting modern actions, like robotization, prefabricates, or flexible structures (exo-skeletons).
Cooperation between universities and the business environment for practice-oriented learning.
The care for the environment and for the people`s safety are issues that will transform the mindset of the decidents in civil engineering area, regarding technology, materials, procurement, innovation, people, marketing, and regulations [3].
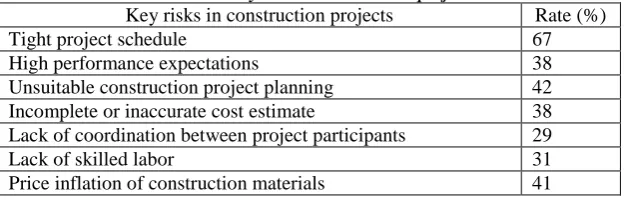
Risk management is an important issue in construction projects, since it deals with very diverse inputs (materials, human capital, equipment, technology, or money). The frequency and strengths of the risks may affect the organization`s performance and its position on the market. There are some key risks which have to be considered [4]:
Table 1: Key risks in construction projects
Key risks in construction projects Rate (%)
Tight project schedule 67
High performance expectations 38
Unsuitable construction project planning 42 Incomplete or inaccurate cost estimate 38 Lack of coordination between project participants 29
Lack of skilled labor 31
Price inflation of construction materials 41
The business environment is in continuous change, therefore, if a management decision has to be made, one criterion is not enough, and most of the time the criteria are contradictory [5]. The management team should set as many criteria as possible, by analyzing all the alternatives, in order to choose the best option [6].
The multi-criteria methods have finite number of criteria, even if the business environment provides infinite combinations [7]. Each organization will have constrains because of the limited level of resources available at a certain time in its life cycle. The decision making process is developed by setting the number of real-based alternatives related to relevant selected criteria [8], [9].
The construction projects are planned by the same principles as other projects, based on efficiency in terms of cost, schedule, quality, and risks [10]. Historical data may represent a source for the decision making process in a stable environment, but in a competitive economy they have to be adapted according to the limited resources of the organization [11].
The decision-making process is a team effort, involving the organization`s management, each of the participants having their own outranking criteria. The importance given to the criteria that will lead to alternatives is a difficult process, therefore the risk should be evaluated [12].
The Multi Criteria Decision Making (MCDM) issuitable when the decision makers have to choose between a package of criteria [13]. That`s why it is widely used in business strategy, at all departments` levels [14]:
[Anastasiu * et al., 5(2): February, 2018]
ISSN: 2349-5197
Impact Factor: 3.765
I
NTERNATIONAL
J
OURNAL OF
R
ESEARCH
S
CIENCE &
M
ANAGEMENT
Manufacturing: choosing the technology for providing the products/services.
Human resources: ranking the criteria for selecting the personnel.
Marketing: deciding on the methods to promote the company`s outputs.
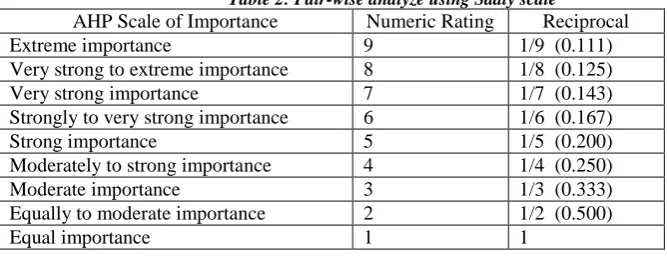
However, deciding on the importance and the ranks of the criteria is the base for the method`s success. Consequently, ELECTRE I (Elimination Et Choix Traduisant la Realite) have to be combined with other decision-making methods, such as AHP (Analytic Hierarchy Process), in order to analyze the criteria and give them scores according to the organization`s capabilities [15]. This is a pair wise comparison of the attributes of each criteria, using Saaty scale [16]. AHP allows the managers to organize the criteria based on their importance and significance given by the decision makers, and then to rank them on a scale from 1 to 9, by analyzing the pair wise ranking [17].
MCDM is widely used in civil engineering companies, where the cost of the works is far more expensive than in other industry sectors. The level of resources impose the decision of choosing between more projects that are using the same inputs [18]. The criteria are influenced by the stakeholders, the competition, the environment, or the organization`s capabilities [19].
Most of the time, the managers are making decisions by using few criteria (or maybe one, most often the cost criteria [20]), without ranking them according to existing data, or even make common sense decisions. However, the strategy is a long term development of a company, so a wrong decision may jeopardize the future of the business [21].
Methodology
The decision-making process is based on analyzing the company`s data and setting criteria for selecting the best option. In order to be accurate, one method is not enough, so we combined two methods in conditions of certainty: the Analytic Hierarchy Process (AHP) for ranking the criteria, and ELECTRE I for choosing the best option.
AHP model involves three levels: the objective, the criteria and the alternatives. Because the criteria may be both quantitative and qualitative, they have to be pair-wise analyzed on a scale from 1 to 9, and by fractions, if relevant.
Table 2: Pair-wise analyze using Saaty scale
AHP Scale of Importance Numeric Rating Reciprocal
Extreme importance 9 1/9 (0.111)
Very strong to extreme importance 8 1/8 (0.125)
Very strong importance 7 1/7 (0.143)
Strongly to very strong importance 6 1/6 (0.167)
Strong importance 5 1/5 (0.200)
Moderately to strong importance 4 1/4 (0.250)
Moderate importance 3 1/3 (0.333)
Equally to moderate importance 2 1/2 (0.500)
Equal importance 1 1
[Anastasiu * et al., 5(2): February, 2018]
ISSN: 2349-5197
Impact Factor: 3.765
I
NTERNATIONAL
J
OURNAL OF
R
ESEARCH
S
CIENCE &
M
ANAGEMENT
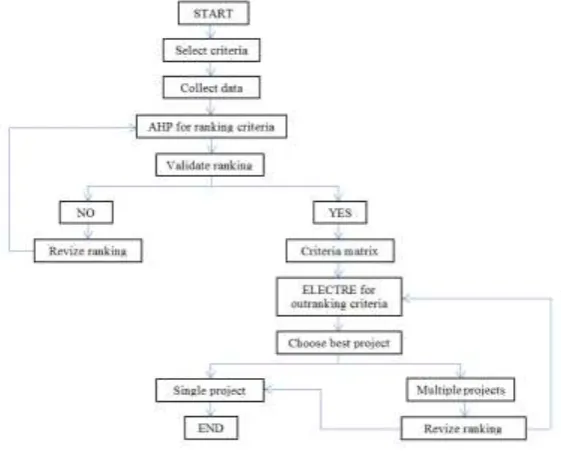
Figure 2. Decision making algorithm
The main hypothesis of this research is that the mix of decision-making methods (AHP and ELECTRE I) may help the managers to make the best decision when they have to choose between more alternatives [22]. Therefore, each alternative is outranked based on the same criteria, both quantitative and qualitative ones.
The present study aims to prove that the decision-making methods are suitable for the civil engineering projects, when an organization has limited resources and may perform only one contract out of four. In order to find the best option, the managers have analyzed the four projects by using the same criteria.
For this purpose, we have chosen four construction projects, each of them deferring in some criteria:
Table 3: Projects and criteria for decision making process
Pj/Cj C1 C2 C3 C4 C5 C6
P1 260.000 30 1 3 2 2
P2 220.000 26 2 2 3 1
P3 180.000 20 2 3 1 3
P4 200.000 18 4 2 2 2
C1: Profit of the project.
It`s a quantitative criteria, measured in EURO.
C2: Project schedule.
It`s a quantitative criteria, measured in months.
C3: Pollution.
It`s a qualitative criteria, measured on a scale from 1 to 5, where 5 is for the highest level of pollution.
C4: Technology investment.
It`s a qualitative criteria, measured on a scale from 1 to 5, where 5 is for the highest level of technology.
C5: Workers skills.
It`s a qualitative criteria, measured on a scale from 1 to 5, where 5 is for the highest level of skills.
C6: Risk.
[Anastasiu * et al., 5(2): February, 2018]
ISSN: 2349-5197
Impact Factor: 3.765
I
NTERNATIONAL
J
OURNAL OF
R
ESEARCH
S
CIENCE &
M
ANAGEMENT
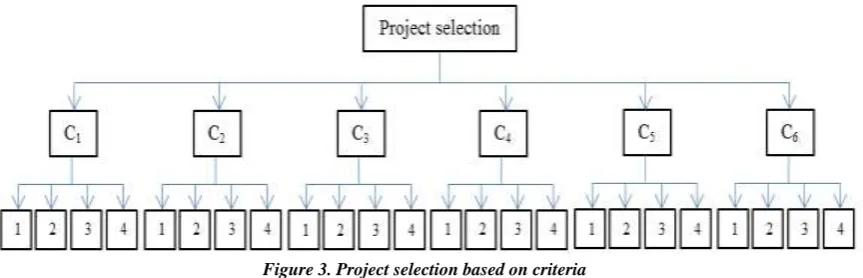
Based on historical data and experience of at least five years in civil engineering area, the management team had to decide on a single project, because of the limited resources.
Figure 3. Project selection based on criteria
We surveyed 20 construction companies from Transylvania region, Romania, giving them the criteria and the existing data. The companies` managers were asked to decide for the best project, and also to rank the importance of the criteria, using the Saaty scale. We gathered the answers and compiled them.
The pair wise ranking was computed and the results provided the score of each criteria in the AHP analyze.
The ELECTRE I method was developed for all projects with identical criteria scores, the results were interpreted and, based on the results, the optimum project was chosen.
We divided the study in 4 phases:
Phase 1: Setting the quantitative and qualitative criteria;
Phase 2: Survey of 20 civil engineering companies;
Phase 3: ELECTRE I analyze for outranking the projects;
Phase 4: Results and recommendations.
Phase 1: Setting the quantitative and qualitative criteria.
As showed above, there are some key factors for successful civil engineering projects. They were the main criteria in this research, because of their importance in a risk assessment.
The projects have been analyzed according to the criteria, as follows:
C1 – Profit: for each project, an average profit was estimated. The relevance of this criteria was the profit/month: 8.667 EURO/month for P1, 8.462 EURO/month for P2, 9.000 EURO/month for P3, and 11.111 EURO/month for P4.
C2 – Schedule: the number of months required for performing each project. For the case study, the months needed were: 30 months for P1, 26 months for P2, 20 months for P3, and 18 months for P4.
C3 – Level of pollution: it is measured on a scale from 1 to 5, where 5 represents the maximum effect of pollution on the environment. In our case study, it is 1 for P1, 2 for P2, 2 for P3, and 4 for P4.
C4 – Investments in technology: it is measured on a scale from 1 to 5, where 5 represents the maximum investment for modern technology. It will be used in future projects and represents tangible asset of the organization. In our case study, it is 3 for P1, 2 for P2, 3for P3, and 2 for P4.
C5 – Specialization of the workers: it is measured on a scale from 1 to 5, where 5 represents the maximum skills of the site workers. It will be used in future projects and represents a target in people`s development. In our case study, it is 2 for P1, 3 for P2, 1 for P3, and 2 for P4.
[Anastasiu * et al., 5(2): February, 2018]
ISSN: 2349-5197
Impact Factor: 3.765
I
NTERNATIONAL
J
OURNAL OF
R
ESEARCH
S
CIENCE &
M
ANAGEMENT
Phase 2: Survey of 20 civil engineering companies.
We conceived a questionnaire for asking the managers to rank the importance of the criteria and their choice on the best project, considering the data in Table 3.
The companies are specialized in execution of residential, commercial and industrial buildings, 82% of them are small enterprises, and 18% are medium ones, all with the headquarters in Transylvania, Romania.
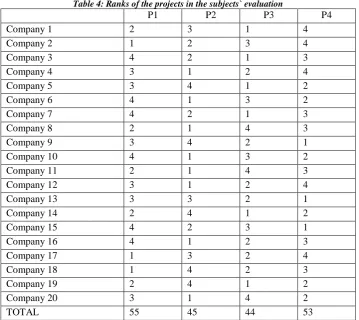
The managers gave scores for each project, 1 point for the best, and 5 points for the worse. The projects were ranked as follows:
Table 4: Ranks of the projects in the subjects` evaluation
P1 P2 P3 P4
Company 1 2 3 1 4
Company 2 1 2 3 4
Company 3 4 2 1 3
Company 4 3 1 2 4
Company 5 3 4 1 2
Company 6 4 1 3 2
Company 7 4 2 1 3
Company 8 2 1 4 3
Company 9 3 4 2 1
Company 10 4 1 3 2
Company 11 2 1 4 3
Company 12 3 1 2 4
Company 13 3 3 2 1
Company 14 2 4 1 2
Company 15 4 2 3 1
Company 16 4 1 2 3
Company 17 1 3 2 4
Company 18 1 4 2 3
Company 19 2 4 1 2
Company 20 3 1 4 2
TOTAL 55 45 44 53
Based on the managers` opinions, the best project would be P3, followed by P2, P4, and P1.
They were asked to rank the criteria for choosing the projects. They used the Saaty scale and developed a pair wise comparison, meaning that they have analyzed each pair of criteria (e.g. C1 versus C2, C1 versus C3, C2 versus C6, etc.) for the same project. For example, for P3, if C2(schedule) has the same effect on the project as C3 (pollution), then C2 will get 1, and C3 will get also 1. But if C2 is extremely important in contrast with C3, then C2 will get 9, and C3 will get 1/9.
[Anastasiu * et al., 5(2): February, 2018]
ISSN: 2349-5197
Impact Factor: 3.765
I
NTERNATIONAL
J
OURNAL OF
R
ESEARCH
S
CIENCE &
M
ANAGEMENT
Table 5: Scores given by managers for criteria
C1 C2 C3 C4 C5 C6 ∑ Score (%)
C1 1 1/6 3 3 1/3 4 11.500 17
C2 6 1 1/6 1/5 1 3 11.367 16
C3 1/3 6 1 1/3 4 1 12.666 19
C4 1/3 5 3 1 1/7 1/3 9.809 15
C5 3 1 1/4 7 1 1/5 12.450 18
C6 1/4 1/3 1 3 5 1 10.583 15
∑ 10.916 13.500 8.417 14.533 11.476 9.533 68.375 100
The sum of all the descriptors is the base for normalizing the criteria by weighing them compared to the sum. For example, in Table 5, the value of C5 is obtained by dividing all of values (1/3; 1; 4; 1/7; 1; 5) to 11.476.
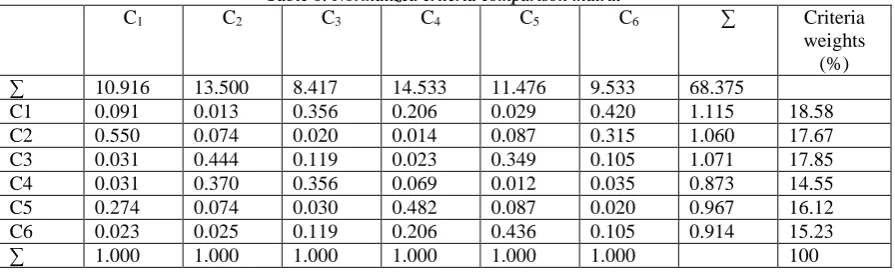
Table 6: Normalized criteria comparison matrix
C1 C2 C3 C4 C5 C6 ∑ Criteria
weights (%)
∑ 10.916 13.500 8.417 14.533 11.476 9.533 68.375
C1 0.091 0.013 0.356 0.206 0.029 0.420 1.115 18.58
C2 0.550 0.074 0.020 0.014 0.087 0.315 1.060 17.67
C3 0.031 0.444 0.119 0.023 0.349 0.105 1.071 17.85
C4 0.031 0.370 0.356 0.069 0.012 0.035 0.873 14.55
C5 0.274 0.074 0.030 0.482 0.087 0.020 0.967 16.12
C6 0.023 0.025 0.119 0.206 0.436 0.105 0.914 15.23
∑ 1.000 1.000 1.000 1.000 1.000 1.000 100
Then, by summing all the weights of C5 (0.967), than divided to the number of criteria (6), we found the total weight of C5 (16.12%).
The scores for the criteria are: 18.58% for C1, 17.67% for C2, 17.85% for C3, 14.55% for C4, 16.12% for C5, and 15.23% for C6.
Phase 3: ELECTRE I analyze for outranking the projects
ELECTRE I is a multi-criteria decision making method. It is widely used in construction project management, for selecting the optimum variant of a project portfolio.
The main hypothesis of this research is that ELECTRE I method is suitable for choosing the best project out of four, if an organization has limited resources and is able to perform only one.
The stages of this method are:
Stage 1: Variants and criteria:
In this stage, the managers set the decisional variants and their consequences, by considering some criteria that determine the choice.
In our research, the criteria, which are the same for all projects, are: profit (C1), schedule (C2), level of pollution (C3), technology (C4), workers` skills (C5), and level of risk (C6).
[Anastasiu * et al., 5(2): February, 2018]
ISSN: 2349-5197
Impact Factor: 3.765
I
NTERNATIONAL
J
OURNAL OF
R
ESEARCH
S
CIENCE &
M
ANAGEMENT
Table 7: Projects and criteria using maximization and minimization
Pj/Cj C1 C2 C3 C4 C5 C6
P1 260.000 - 30 - 1 3 2 - 2
P2 220.000 - 26 - 2 2 3 - 1
P3 180.000 - 20 - 2 3 1 - 3
P4 200.000 - 18 - 4 2 2 - 2
The utility matrix is calculated by the formulas:
For max criteria: uij = 𝑐𝑖𝑗−min 𝑐𝑖𝑗 max 𝑐𝑖𝑗−min 𝑐𝑖𝑗 For min criteria: uij = max 𝑐𝑖𝑗−𝑐𝑖𝑗
max 𝑐𝑖𝑗−min 𝑐𝑖𝑗
Utilities for C1 (max): u11 = 260.000−180.000
260.000−180.000 = 1.000 u12 =
220.000−180.000
260.000−180.000 = 0.500 u13 = 180.000−180.000
260.000−180.000 = 0.000 u14 =
200.000−180.000
260.000−180.000 = 0.250
Utilities for C2 (min): u21 = −18+30
−18+30 = 1.000 u22 =
−18+26
−18+30 = 0.667 u23 = −18+20
−18+30 = 0.167 u24 =
−18+18
−18+30 = 0.000
Utilities for C3 (min): u31 = −1+1
−1+4 = 0.000 u32 =
−1+2
−1+4 = 0.333 u33 = −1+2
−1+4 = 0.333 u34 =
−1+4
−1+4 = 1.000
Utilities for C4 (max): u41 = 3−2
3−2 = 1.000 u42 =
2−2
3−2 = 0.000 u43 = 3−2
3−2 = 1.000 u44 =
2−2
3−2 = 0.000
Utilities for C5 (max): u51 = 2−1
3−1 = 0.500 u52 =
3−1
3−1 = 1.000 u53 = 1−1
3−1 = 0.000 u54 =
2−1
3−1 = 0.500
Utilities for C6 (min): u61 = −1+2
−1+3 = 0.500 u62 =
−1+1
−1+3 = 0.000 u63 = −1+3
−1+3 = 1.000 u64 =
−1+2
−1+3 = 0.500
Table 8: The utility matrix
Pj/Cj C1 C2 C3 C4 C5 C6
P1 1.000 1.000 0.000 1.000 0.500 0.500
P2 0.500 0.667 0.333 0.000 1.000 0.000
P3 0.000 0.167 0.333 1.000 0.000 1.000
P4 0.250 0.000 1.000 0.000 0.500 0.500
K 0.1858 0.1767 0.1785 0.1455 0.1612 0.1523
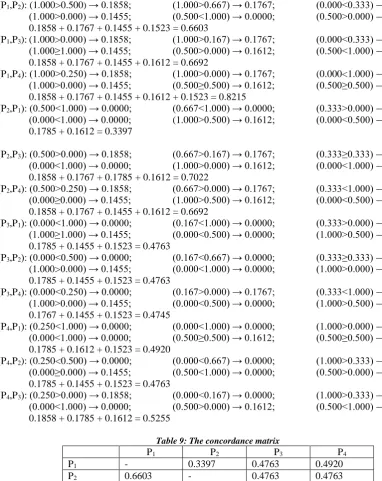
Stage 2: Concordance index:
The concordance index shows the limit to which a variant is better than another.
c(Vg,Vh) = ∑ 𝐾𝑗 𝑤ℎ𝑒𝑟𝑒 𝑈(𝑉𝑔)≥𝑈(𝑉ℎ) 𝐾1+𝐾2+𝐾3+⋯+𝐾𝑚
[Anastasiu * et al., 5(2): February, 2018]
ISSN: 2349-5197
Impact Factor: 3.765
I
NTERNATIONAL
J
OURNAL OF
R
ESEARCH
S
CIENCE &
M
ANAGEMENT
c(P1,P2): (1.000>0.500) → 0.1858; (1.000>0.667) → 0.1767; (0.000<0.333) → 0.0000; (1.000>0.000) → 0.1455; (0.500<1.000) → 0.0000; (0.500>0.000) → 0.1523. 0.1858 + 0.1767 + 0.1455 + 0.1523 = 0.6603
c(P1,P3): (1.000>0.000) → 0.1858; (1.000>0.167) → 0.1767; (0.000<0.333) → 0.0000; (1.000≥1.000) → 0.1455; (0.500>0.000) → 0.1612; (0.500<1.000) → 0.0000. 0.1858 + 0.1767 + 0.1455 + 0.1612 = 0.6692
c(P1,P4): (1.000>0.250) → 0.1858; (1.000>0.000) → 0.1767; (0.000<1.000) → 0.0000; (1.000>0.000) → 0.1455; (0.500≥0.500) → 0.1612; (0.500≥0.500) → 0.1523. 0.1858 + 0.1767 + 0.1455 + 0.1612 + 0.1523 = 0.8215
c(P2,P1): (0.500<1.000) → 0.0000; (0.667<1.000) → 0.0000; (0.333>0.000) → 0.1785; (0.000<1.000) → 0.0000; (1.000>0.500) → 0.1612; (0.000<0.500) → 0.0000. 0.1785 + 0.1612 = 0.3397
c(P2,P3): (0.500>0.000) → 0.1858; (0.667>0.167) → 0.1767; (0.333≥0.333) → 0.1785; (0.000<1.000) → 0.0000; (1.000>0.000) → 0.1612; (0.000<1.000) → 0.0000. 0.1858 + 0.1767 + 0.1785 + 0.1612 = 0.7022
c(P2,P4): (0.500>0.250) → 0.1858; (0.667>0.000) → 0.1767; (0.333<1.000) → 0.0000; (0.000≥0.000) → 0.1455; (1.000>0.500) → 0.1612; (0.000<0.500) → 0.0000. 0.1858 + 0.1767 + 0.1455 + 0.1612 = 0.6692
c(P3,P1): (0.000<1.000) → 0.0000; (0.167<1.000) → 0.0000; (0.333>0.000) → 0.1785; (1.000≥1.000) → 0.1455; (0.000<0.500) → 0.0000; (1.000>0.500) → 0.1523. 0.1785 + 0.1455 + 0.1523 = 0.4763
c(P3,P2): (0.000<0.500) → 0.0000; (0.167<0.667) → 0.0000; (0.333≥0.333) → 0.1785; (1.000>0.000) → 0.1455; (0.000<1.000) → 0.0000; (1.000>0.000) → 0.1523. 0.1785 + 0.1455 + 0.1523 = 0.4763
c(P3,P4): (0.000<0.250) → 0.0000; (0.167>0.000) → 0.1767; (0.333<1.000) → 0.0000; (1.000>0.000) → 0.1455; (0.000<0.500) → 0.0000; (1.000>0.500) → 0.1523. 0.1767 + 0.1455 + 0.1523 = 0.4745
c(P4,P1): (0.250<1.000) → 0.0000; (0.000<1.000) → 0.0000; (1.000>0.000) → 0.1785; (0.000<1.000) → 0.0000; (0.500≥0.500) → 0.1612; (0.500≥0.500) → 0.1523. 0.1785 + 0.1612 + 0.1523 = 0.4920
c(P4,P2): (0.250<0.500) → 0.0000; (0.000<0.667) → 0.0000; (1.000>0.333) → 0.1785; (0.000≥0.000) → 0.1455; (0.500<1.000) → 0.0000; (0.500>0.000) → 0.1523. 0.1785 + 0.1455 + 0.1523 = 0.4763
c(P4,P3): (0.250>0.000) → 0.1858; (0.000<0.167) → 0.0000; (1.000>0.333) → 0.1785; (0.000<1.000) → 0.0000; (0.500>0.000) → 0.1612; (0.500<1.000) → 0.0000. 0.1858 + 0.1785 + 0.1612 = 0.5255
Table 9: The concordance matrix
P1 P2 P3 P4
P1 - 0.3397 0.4763 0.4920
P2 0.6603 - 0.4763 0.4763
P3 0.6692 0.7022 - 0.5255
P4 0.8215 0.6692 0.4745 -
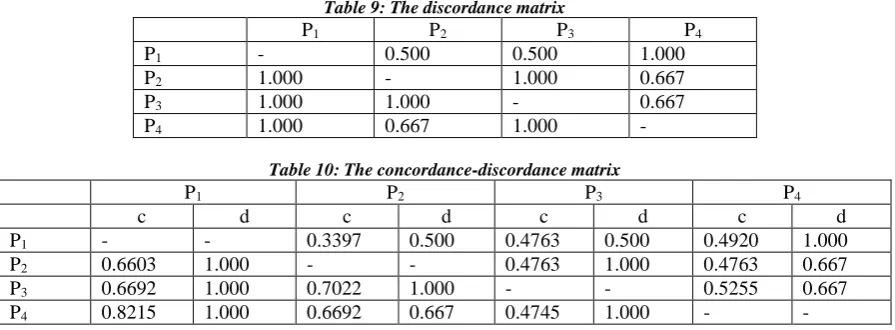
Stage 3: Discordance index:
The discordance index shows the limit to which a variant is worse than another. d(Vg, Vh) = 0 if U(Vg)≥U(Vh)
= 1
𝛼 max [U(Vg) – U(Vh)] for U(Vg)≤U(Vh)
[Anastasiu * et al., 5(2): February, 2018]
ISSN: 2349-5197
Impact Factor: 3.765
I
NTERNATIONAL
J
OURNAL OF
R
ESEARCH
S
CIENCE &
M
ANAGEMENT
d(P1,P2): max | 0 (1.000>0.500); 0 (1.000>0.0.667); -0.333 (0.000<0.333); 0 (1.000>0.500); -0.500 (0.500<1.000); 0 (0.500>0.000) | = 0.500
d(P1,P3): max | 0 (1.000>0.000); 0 (1.000>0.167); -0.333 (0.000<0.333); 0 (1.000≥1.000); 0 (0.500>0.000); -0.500 (0.500<1.000) | = 0.500
d(P1,P4): max | 0 (1.000>0.250); 0 (1.000>0.000); -1.000 (0.000<1.000); 0 (1.000>0.000); 0 (0.500≥0.500); 0 (0.500≥0.500) | = 1.000
d(P2,P1): max | -0.500 (0.500<1.000); -0.333 (0.667<1.000); 0 (0.333>0.000); -1.000 (0.000<1.000); 0 (1.000>0.500); -0.500 (0.000<0.500) | = 1.000
d(P2,P3): max | 0 (0.500>0.000); 0 (0.667>0.167); 0 (0.333≥0.333); -1.000 (0.000<1.000); 0 (1.000>0.000); -1.000 (0.000<1.000) | = 1.000
d(P2,P4): max | 0 (0.500>0.250); 0 (0.667>0.000); -0.667 (0.333<1.000); 0 (0.000≥0.000); 0 (1.000>0.500); -0.500 (0.000<0.500) | = 0.667
d(P3,P1): max | -1.000 (0.000<1.000); -0.833 (0.167<1.000); 0 (0.333>0.000); 0 (1.000≥1.000); -0.500 (0.000<0.500); 0 (1.000>0.500) | = 1.000
d(P3,P2): max | -0.500 (0.000<0.500); -0.500 (0.167<0.667); 0 (0.333≥0.333); 0 (1.000>0.000); -1.000 (0.000<1.000); 0 (1.000>0.000) | = 1.000
d(P3,P4): max | -0.250 (0.000<0.250); 0 (0.167>0.000); -0.667 (0.333<1.000); 0 (1.000>0.000); -0.500 (0.000<0.500); 0 (1.000>0.500) | = 0.667
d(P4,P1): max | -0.750 (0.250<1.000); -1.000 (0.000<1.000); 0 (1.000>0.000); -1.000 (0.000<1.000); 0 (0.500≥0.500); 0 (0.500≥0.500) | = 1.000
d(P4,P2): max | -0.250 (0.250<0.500); -0.667 (0.000<0.667); 0 (1.000>0.333); 0 (0.000≥0.000); -0.500 (0.500<1.000); 0 (0.500>0.000) | = 0.667
d(P4,P3): max | 0 (0.250>0.000); -0.167 (0.000<0.167); 0 (1.000>0.333); -1.000 (0.000<1.000); 0 (0.500>0.000); -0.500 (0.500<1.000) | = 1.000
Table 9: The discordance matrix
P1 P2 P3 P4
P1 - 0.500 0.500 1.000
P2 1.000 - 1.000 0.667
P3 1.000 1.000 - 0.667
P4 1.000 0.667 1.000 -
Table 10: The concordance-discordance matrix
P1 P2 P3 P4
c d c d c d c d
P1 - - 0.3397 0.500 0.4763 0.500 0.4920 1.000
P2 0.6603 1.000 - - 0.4763 1.000 0.4763 0.667
P3 0.6692 1.000 0.7022 1.000 - - 0.5255 0.667
P4 0.8215 1.000 0.6692 0.667 0.4745 1.000 - -
Stage 4: Optimum variant:
The optimum variant is calculated by iterative operations of upgrading the variants, with respect on the conditions:
Concordance c(Vg,Vh) ≥ p
Discordance c(Vg,Vh) ≤ q
p,q ϵ [0.1]
p+q = 1, where p is as close as possible to 1, and q is as close as possible to 0.
[Anastasiu * et al., 5(2): February, 2018]
ISSN: 2349-5197
Impact Factor: 3.765
I
NTERNATIONAL
J
OURNAL OF
R
ESEARCH
S
CIENCE &
M
ANAGEMENT
Variants:
p = 0.90; q = 0.10
Condition: c≥0.90 → c is not in the limits d≤0.10 → d is not in the limits → The variant isn`t suitable
p = 0.80; q = 0.20
Condition: c≥0.80 → c is in the limits d≤0.20 → d is not in the limits → The variant isn`t suitable
p = 0.70; q = 0.30
Condition: c≥0.70 → c is in the limits d≤0.30 → d is not in the limits → The variant isn`t suitable
p = 0.60; q = 0.40
Condition: c≥0.60 → c is in the limits d≤0.40 → d is not in the limits → The variant isn`t suitable
p = 0.50; q = 0.50
Condition: c≥0.50 → c is in the limits: c(P1,P2) = 0.6603; c(P1,P3) = 0.6692; c(P1,P4) = 0.8215; c(P2,P3) = 0.7022; c(P2,P4) = 0.6692; c(P4,P3) = 0.5255.
d≤0.50 → d is in the limits: d(P2,P1) = 0.500; d(P3,P1) = 0.500. → The variant isn`t suitable
p = 0.40; q = 0.60
Condition: c≥0.40 → c is in the limits: c(P1,P2) = 0.6603; c(P1,P3) = 0.6692; c(P1,P4) = 0.8215; c(P2,P3) = 0.7022; c(P2,P4) = 0.6692; c(P3,P1) = 0.4763; c(P3,P2) = 0.4763;
c(P3,P4) = 0.4745; c(P4,P1) = 0.4920; c(P4,P2) = 0.4763; c(P4,P3) = 0.5255. d≤0.60 → d is in the limits: d(P2,P1) = 0.500; d(P3,P1) = 0.500;
→ The variant issuitable: P3-P1.
p = 0.30; q = 0.70
Condition: c≥0.30 → c is in the limits: c(P1,P2) = 0.6603; c(P1,P3) = 0.6692; c(P1,P4) = 0.8215; c(P2,P1) = 0.3397; c(P2,P3) = 0.7022; c(P2,P4) = 0.6692; c(P3,P1) = 0.4763;
c(P3,P2) = 0.4763; c(P3,P4) = 0.4745; c(P4,P1) = 0.4920; c(P4,P2) = 0.4763; c(P4,P3) = 0.5255.
d≤0.70 → d is in the limits: d(P2,P1) = 0.500; d(P2,P4) = 0.667; d(P3,P1) = 0.500; d(P4,P2) = 0.667; d(P4,P3) = 0.667.
→ The variant is suitable: P2-P1; P2-P4; P3-P1; P4-P2 and P4-P3.
p = 0.20; q = 0.80
Condition: c≥0.20 → c is in the limits: c(P1,P2) = 0.6603; c(P1,P3) = 0.6692; c(P1,P4) = 0.8215; c(P2,P1) = 0.3397; c(P2,P3) = 0.7022; c(P2,P4) = 0.6692; c(P3,P1) = 0.4763;
c(P3,P2) = 0.4763; c(P3,P4) = 0.4745; c(P4,P1) = 0.4920; c(P4,P2) = 0.4763; c(P4,P3) = 0.5255.
d≤0.80 → d is in the limits: d(P2,P1) = 0.500; d(P2,P4) = 0.667; d(P3,P1) = 0.500; d(P4,P2) = 0.667; d(P4,P3) = 0.667.
→ The variant is suitable: P2-P1; P2-P4; P3-P1; P4-P2; and P4-P3.
p = 0.10; q = 0.90
Condition: c≥0.10 → c is in the limits: c(P1,P2) = 0.6603; c(P1,P3) = 0.6692; c(P1,P4) = 0.8215; c(P2,P1) = 0.3397; c(P2,P3) = 0.7022; c(P2,P4) = 0.6692; c(P3,P1) = 0.4763;
c(P3,P2) = 0.4763; c(P3,P4) = 0.4745; c(P4,P1) = 0.4920; c(P4,P2) = 0.4763; c(P4,P3) = 0.5255.
[Anastasiu * et al., 5(2): February, 2018]
ISSN: 2349-5197
Impact Factor: 3.765
I
NTERNATIONAL
J
OURNAL OF
R
ESEARCH
S
CIENCE &
M
ANAGEMENT
→ The variant is suitable: P2-P1; P2-P4; P3-P1; P4-P2; and P4-P3.
Results and conclusion
The best variant is the one that has the highest difference between p and q. In our case study, p=0.10 and q = 0.90.
As can be seen, the projects that fit this condition are P2 and P4.
For these projects, we have 2 possible choices:
c(P2,P4) = 0.6692; d(P2,P4) = 0.667.
c(P4,P2) = 0.4763; d(P4,P2) = 0.667.
That means that the optimum variant is P4, since the difference between the concordance and the discordanceindex is the highest.
So, the main hypothesis is validated, because we could choose the best project of the portfolio by using ELECTRE I, as a multi-criteria decision making method.
If the organization would have enough resources for two project, the second to be chosen would be P2.
However, if we analyze the managers` opinion, they ranked the projects as follows: P3, P2, P4, and P1.
That means that common sense in decision making is not a solid argue; in order to be competitive on the market, some calculation have to be made, if the company has historical data.
From total of 20 companies, only 3 ranked the first two projects correctly: Company 6, Company 10, and Company 20, representing 15%. It results in 85% wrong choices.
The study revealed another important aspect: as expected, the companies ranked the profit (18.58%) and the schedule (17.85%) as the main criteria when deciding on a specific project. The last criterion was the investment in technology (14.55%), meaning that the execution is based on traditional equipment, because the managers aren`t interested in long term investments.
The civil engineering industry in Romania faced many crisis in the last 40 years. This sector has big manufacturing costs, due to the expensive resources (materials, prefabricates, human resources, equipment and machineries, etc.), so the clients aren`t so many, compared to other products/services. The effect is less attention on therisks involved when accepting a contract. The estimation process is a difficult one, because the managers have to choose between more variants, each one with pros and cons, and involving risks, like expenses, human resources, or technology.
The ex-communist European states face a major phenomenon: Millennials who emigrate to developed countries. They rent buildings and not buy them, therefore the number of clients is decreasing. However, the construction market in Transylvania region is in expansion, since a lot of IT specialists found jobs there.
A sustainable organization is supposed to survive in the business environment if it`s flexible and innovative. The decisions should be based on criteria which may mitigate the risks of the future projects. The data may come from the historical performances of the company, like best practices, lessons learned, personnel`s skills, or others.
[Anastasiu * et al., 5(2): February, 2018]
ISSN: 2349-5197
Impact Factor: 3.765
I
NTERNATIONAL
J
OURNAL OF
R
ESEARCH
S
CIENCE &
M
ANAGEMENT
The main hypothesis of the present research is that, by using two combined methods, the Analytic Hierarchy Process (AHP) and ELECTRE I, the decidents may adopt the best variant of a project portfolio, when the resources are limited. AHP was developed for calculating the weight of each criteria; ELECTRE I was used to iterate the historical data and to perform a pair wise analyze for finding the best variant of estimation.
The hypothesis was validated, because the managers are able to make decisions in certain conditions, by using multi-criteria analysis.
The study also showed that common sense decisions are not always the best ones. In fact only 15% of the subject managers were able to choose the optimum project out of four. Each of them had one or two criteria in mind, and ranked them accordingly, without considering the others, also important to the project.
Another important aspect is that the construction companies keep using traditional technologies, even if this industry is one of most polluting. However, the European and word regulations will force the decision makers to find ways to perform without affecting the environment.
Acknowledgements
This research was possible with the help of the Civil Engineering Association from Transylvania, Romania. They were the subjects of the questionnaire and gave answers according to their professional experience. In return, we presented the results of the study and argued that a cooperation between the business environment and the university is a key to success.
References
[1] “Share of Construction in GDP, in 2016”, UNICEF, 2017,
http://w3.unece.org/PXWeb/en/CountryRanking?IndicatorCode=8.
[2] “8 Ways the Construction Industry Can Rebuild Itself for the 21th Century”, in World Economic Forum, May 2017, https://www.weforum.org/agenda/2017/05/construction-industry-recruit-talent/. [3] Industry Agenda: “Shaping the Future of Constructions: A Breakthrough in Mindset and Technology”,
in World Economic Forum, 2016.
[4] Zou, P., Zhang, G, and Wang, J. “Identifying Key Risks in Construction Projects: Life Cycle and Stakeholder Perspectives”, in International Journal of Project Management, Elsevier, 2007, pp. 7. [5] Botti, L., and Peypoch, N. “Multi-Criteria ELECTRE Method and Destination Competitiveness”, in
Elsevier, Vol. 6, 2013, pp. 108-113.
[6] Keshavarz, G.M., Zavadskas, E.K., Amiri, M., and Turskis, Z. “Extened EDAS Method for Fuzzy Multi-Criteria Decision Making”, in International Journal of Computers Communication & Control, 2016, pp. 359.
[7] Ling, X., and Yang, J. “Introduction to Multi-Criteria Decision-Making and the Evidential Reasoning Approach”, in Manchester School of Management, Paper 0106, 2001, pp. 4.
[8] Saarikosky, H., Barton, D., Mustajoki, J., and Keune, K. “Multi-Criteria Decision Analysis (MCDA) in Ecosystem Survive Valuation”, in OpeNESS Ecosystem Service Reference Book. EC FP7 Grant Agreement no. 308428, 2013, pp. 1.
[9] Dziadosz, A., and Konczak, A. “Review of Selected Methods of Supporting Decision-Making Process in the Construction Industry”, in De Gruyter Open, Archives of Civil Engineering, Vol. LXII, Issue 1, 2016, pp. 111-124.
[10]Monghasemi, S., Reza, N.M., Khasar F., and Adamowski, J. “A Novel Multi-Criteria Decision Making Model for Optimizing Time-Cost-Quality Trade-Off Problems in Construction Projects”, in Expert Systems with Applications, Elsevier, 2015, pp. 1.
[11]Ritchie, J.R.B., and Crouch, G.I. “The Competitive Destination: A Sustainability Perception”, in CAB International, 2003.
[12]Buchanan, J. “Ranking Projects for an Electricity Utility Using ELECTRE III”, in International Transactions in Operational Research, Vol. 4, Issue 4, 2007, pp. 309-323.
[Anastasiu * et al., 5(2): February, 2018]
ISSN: 2349-5197
Impact Factor: 3.765
I
NTERNATIONAL
J
OURNAL OF
R
ESEARCH
S
CIENCE &
M
ANAGEMENT
[14]Figuieira, J.R. and Greco, S. “Trends in Multiple Criteria Decision Analysis”, in Springer Science, New York, USA, 2010, pp. 101-139.
[15]Bouyssou, D. and Marchant, T. “An Axiomatic Approach to Noncompensatory Sorting Methods in MCDM I: The Case of Two Categories”, in European Journal of Operational Research, Elsevier, 2007. [16]Saaty, T.L. “The Analytic Hierarchy Process. Planning, Priority Setting, Resource Allocation”, in
McGraw-Hill, New York, 1980.
[17]Supraja, S., and Kousalia, P. “ELECTRE Method for Selection of Best Computer System”, in Indian Journal of Science and Technology, Vol. 9 (39), 2016, pp.2.
[18]Hobbs, B.F., and Meier, P. “Energy Decisions and the Environment: A Guide to the Use of Multicriteria Methods”, in Kluwer Academic Publishers, Boston, MA., USA, 2000.
[19]Mela, K., Tiainen, T., and Heinisuo, M. “Comparative Study of Multiple Criteria Decision Making Methods for Building Design”, in Advanced Engineering Informatics, 2012, Vol. 26, pp. 716-726. [20]Szafranko, E. “Decision Problems in Management of Construction Projects”, in IOP Conference
Series: Materials Science and Engineering, IOP Publishing Ltd., 2017.
[21]Virine, L., Trumper, M., and Virine, E. “Why Good Managers Make Bad Decisions”, in PM World Journal, Vol. IV, Issue 3, 2015.
[22]Husefest, O.M., Robertsen, K., and Hannas, G. “Selection Criteria and Tender Evaluation: The Equivalent Tender Price Method”, in Management and Innovation for a Sustainable Built Environment, Amsterdam, The Netherlands, 2011.