Divertor Impurity-Influx Monitor for ITER: Spectral Throughput
Measurement on an Optical Prototype for the Upper Port and
Optimization of Viewing Chords based on Computerized
Tomography
Atsushi IWAMAE, Tatsuo SUGIE, Hiroaki OGAWA and Yoshinori KUSAMA
Fusion Research and Development Directorate, Japan Atomic Energy Agency, Naka, Ibaraki 311–0193, Japan
(Received 16 June 2009/Accepted 14 July 2009)
We are developing a spectroscopic diagnostics system in ultraviolet and visible wavelength regions for moni-toring ITER divertor plasmas. An equivalent-size prototype of the optical components for viewing upper port fan-array chords has been assembled as a system to measure spectral throughput, i.e., ´etendu. Collisional-radiative models for Heiand Civare used to estimate the emission line intensities of helium ash and carbon impurity ions in a divertor region of a burning plasma. The estimated line intensity of Civ,λ772.6 nm, satisfies ITER require-ments for the time resolution of measurement ofTi. A numerical simulation of the computerized tomographic technique for various pairs of viewing fan arrays has been applied to the divertor plasma region to reconstruct a two-dimensional distribution. The optimized pair of viewing fan arrays resolves a model distribution with a rea-sonable spatial resolution. We measure the reflectance of surfaces of carbon-fiber-composite and tungsten blocks, which make up the plasma-facing divertor target plates and the divertor dome. The reflectance of the surface of the tungsten divertor block is 23% at Hα(λ656.3 nm). A sandblast-processed tungsten surface effectively reduces
direct reflectance; the resultant reflectance is less than 0.7%.
c
2009 The Japan Society of Plasma Science and Nuclear Fusion Research
Keywords: divertor impurity-influx monitor, ITER, collisional-radiative model, computerized tomography, max-imum entropy method, reflectance, tungsten, carbon-fiber-composite CFC
DOI: 10.1585/pfr.4.042
1. Introduction
ITER-oriented research has proceeded at the Japan Atomic Energy Agency (JAEA) to achieve the required specifications for plasma measurement [1]. JAEA has a procurement plan to supply a divertor impurity-influx monitor for ITER. Developments in schematic design and research on the divertor impurity-influx monitor have been presented [2–8]. Table 1 shows ITER specification require-ments related to the divertor impurity-influx monitor for plasma measurement. The monitor measures the emission in a wide spectral range, fromλ200 nm toλ1000 nm, along multiple lines of sight in the divertor region. The principal functions of the monitoring system are to identify impurity elements, measure concentrations and influxes [9, 10] of impurities, deuterium, and tritium for control, and obtain important parameters for optimization such as the energy of impurity elements (i.e., ion temperatures) and the ion-ization front position. The expected impurities are beryl-lium [11], carbon [12], and tungsten [13] originating from the first wall in the main chamber and from the inner and outer divertor target plates. Neon and other impurity gases injected into the plasma for radiation cooling in the diver-tor are also expected. It also monidiver-tors electron temperature
author’s e-mail: [email protected]
Teand densityneas well as the fuel rationH/nDornT/nD of the divertor plasma. It provides supplementary informa-tion about the radiainforma-tion power and profiles in the divertor and X-point/multi-faceted asymmetric radiation from the edge (MARFE) [14] regions, and also information about the densities of neutral atomsnH,nD, andnTand molecules
nH2, nD2, and nT2. The ITER vacuum vessel consists of eighteen port sections numbered from #01 to #18. The system is slated for installation in the upper #01, equatorial #01, and divertor #02 ports. Table 2 indicates its compo-nents, roles, designed spatial resolutions, and present sta-tus. Table 3 shows a proposal for spectrometers.
From the upper #01, equatorial #01, and divertor #02 ports, we observe the divertor plasma with a fan-array of viewing chords (see Figs. 1 and 2). Plasma emissions from the divertor region can be observed with 72 fan-array chords from the upper port #01 across the core plasma and with 72 chords from equatorial port #01. We propose ob-serving the plasma with upper and lower fan-arrays from the gap between divertor cassettes in divertor port #02. The w-type divertor consists of central domes, inner and outer target plates, and baffles. The domes and baffles are made of tungsten (W) blocks. The divertor strike points are placed on a target plate made of carbon-fiber-composite (CFC) material. The optical design of the fan-array
view-c
2009 The Japan Society of Plasma
Table 1 ITER specification requirements related to the divertor impurity-influx monitor for plasma measurement. (Quoted from Ref. [1]; copyright 2007 with permission from IAEA.)
Resolution
Measurement Parameter Range Time Space Accuracy
1. Impurity and D, T ΓBe,ΓC,ΓW 1017−1022at s−1 1 ms 50 mm 30% influx in the divertor ΓD,ΓT 1019−1025at s−1 1 ms 50 mm 30%
2. Divertor Helium density nHe 1017−1021m−3 1 ms — 20%
Fuel Ratio nT/nD 0.1−10 100 ms integral 20%
in the divertor nH/nD 0.01−0.1 100 ms integral 20%
3. Divertor electron ne 1019−1022m−3 1 ms 50 mm along leg, 20%
parameters 3 mm across leg
Te 0.3 eV−200 eV 1 ms 50 mm along leg, 20% 3 mm across leg
4. Divertor ion Ti 0.3 eV−200 eV 1 ms 50 mm along leg, 20%
temperature 3 mm across leg
5. Divertor plasma flow Vp TBD−105ms 1 ms 100 mm along leg, 20% 3 mm across leg
6. Divertor operational Position of the 0−TBD m 1 ms 100 mm —
parameters ionization front
Table 2 The divertor impurity-influx monitoring system.
Port Mirror Optics system Role Spatial Resolution Present status
Upper port #01 Front-end and Two-dimensional <40 mm An optical prototype Collection optics system measurement of is fabricated. Equatorial port #01 Front-end and divertor and x- <40 mm Optical design has
Collection optics system point region been completed.
Divertor port #02(g) Upper and Lower Gap, (except near — Optical design in process (Relay) and Collection divertor target to fit the new divertor dome. optical system plates)
Divertor port #02(c) Inside-Dome, (Relay) and Observe divertor — Optical design in process Collection optics system target plates to fit the new divertor dome. (c) Diagnostics access through the center of a cassette.
(g) Diagnostics access in a 20-mm gap between cassettes (see Fig. 2).
Table 3 Proposal for ITER divertor spectrometers with an observation wavelength range fromλ200 nm toλ1000 nm.
Spectrometer Location Wavelength region Time resolution Aim
1. UV spectrometers Behind the bio- λ200−λ450 nm 10 ms Impurity element monitoring and
shield: Port cell particle influx measurement in the UV region 2. Visible survey Diagnostic hall λ400−λ1000 nm 10 ms Impurity element monitoring and
spectrometers particle influx measurement in the UV region 3. High-resolution Diagnostic hall λ400−λ1000 nm 100 ms Ion temperature, particle energy distribution
spectrometers Tritium/deuterium/hydrogen density ratio from Balmer-αemissions
ing chords for observing inner and outer target plates from the inside of the dome in the central divertor is in process.
The first walls are covered with beryllium. Helium ash atoms after D-T fusion reactions are pumped out at the divertor. The impurity influx ΓBe, ΓC, ΓW, andΓHe (ΓNe,ΓAr,ΓXe etc.) and the above parameters are moni-tored in the ultra-violet (UV), visible, and near infrared (IR). The collected emission from the divertor is divided and sent to three spectrometers: UV, visible survey, and high-resolution. High-resolution spectrometers measure line profiles and shifts and deduce the dynamics of impu-rity elements emitted from the divertor plates. The fuel in-flux in the divertorΓDandΓTwhich also helps in determin-ing the fuel ratio from the intensity of the Dαand Tα
emis-sion lines, is measured using high-resolution spectrome-ters. The wavelength of the Hα, Dαand Tαemission lines
are λ656.280, λ656.104 and λ656.045 nm, respectively. Polarization separation measurement is necessary to select theπ-light of the Dαand Tαemission lines [15,16]. Simul-taneous measurements of both polarization componentsπ andσmay indicate the emission location via Zeeman split spectral profiles [17–19]. The electron velocity distribu-tion funcdistribu-tion may be determined by plasma polarizadistribu-tion spectroscopy [20, 21]. The ion temperatures in the divertor plasma are deduced from the Doppler broadening of the lithium-like Civλ772.6 nm line (C3+,n=6−7) [12]. The plasma parameters of electron temperature Te and elec-tron densityneare derived from the ratio of the emission line intensity of Hei when the ionizing plasma compo-nent is dominant. If the monitoring wavelengths of impu-rity emission lines and bremsstrahlung continuum and the wavelength bandwidths of the filters are determined, some of the optical fibers transmitting light from the collection optics system to visible survey spectrometers can be con-nected with filter spectrometers, which provide faster time resolution.
Reference [22] estimates the neutron flux and energy deposition in mirror materials and vacuum windows. The predicted neutron flux and the nuclear heat production of the first mirror, located about 1 m behind the first wall, are 1.2×10⁸m−2s−1and 20 kWm−3, respectively. The radia-tion level has no effect on the molybdenum mirror surface at a neutron irradiation level of 1.4×10⁸neutrons m−2[23]. Irradiation of low-energy deuterium ions on molybdenum and tungsten mirrors decreases the reflection; however, the decrease in reflectivity of the mirrors due to sintering with-out surface melting is less than 10% [24]. The nuclear heat-ing power for stainless steel is 0.2 MW m−3 in the upper port. To remove the nuclear heat, water-cooling channels are bored into the mirror support structure. Heat load anal-ysis has shown that the effect of thermal deformation is relatively low for the upper port optical components [4].
Here, we assembled the upper port optical compo-nents into a scale-size model viewing system. Its spectral light throughput, the ´etendue, was measured in the near UV, visible, and near IR regions. We examined the field
of view of sight chords of the prototype optical system. The two-dimensional spatial resolution was evaluated by means of the computerized tomography.
2. Scale-size Optical Prototype
2.1
Spectral throughput (´etendue) of the
up-per port chords
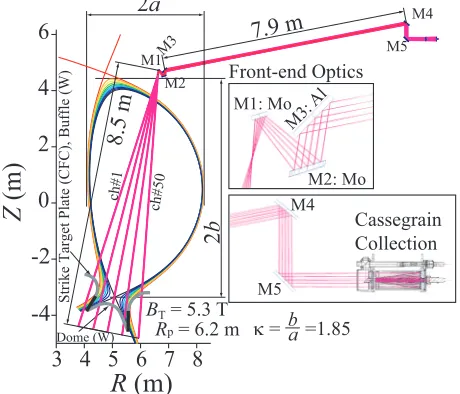
Figure 1 shows the ray tracing of the viewing chords of the optical prototype used in the present experiment, which consists of 50 fan-array chords. The major and mi-nor radii of the ITER plasma, Rp and a, are 6.2 m and 2.0 m, respectively. The plasma elongation isκ = a/b =
1.85. Thus, the length from the first mirror of the front-end optics to the divertor region is about 8 m. The 50 fan-array covers a 2-m divertor region along the poloidal direction.
Emission light from the divertor plasma is relayed through the front-end optical components. The front-end system consists of a plane molybdenum mirror (M1), an off-axis paraboloid molybdenum mirror (M2), and a plane aluminum mirror (M3), as shown in Fig. 1. Two Al-coated glass mirrors (M4 and M5) create a dog-leg for the light path. A Cassegrain telescope focuses the relayed divertor image onto a focal plane. A fifty-channel micro-lens ar-ray is set at the focal plane of the Cassegrain telescope. The array is placed to collect the light in the toroidal
Fig. 3 The measured spectral light throughput coefficients (´etendue) for the upper port prototype. The observed spectral ´etendue of three chords, #1, #25, and #50, is shown as an example. We re-measured the spectral ´etendue about seven months after the first measurement. The deterioration of the spectral ´etendue at shorter wavelengths is shown with dashed curves. Tarnished spots can be seen on the surface of the molybdenum mirrors. The deterioration of the off-axis paraboloid mirror (M2) is quite considerable. Expected emission lines from the divertor plasma are indicated by bars at the bottom of the graph.
Fig. 2 Planned viewing fan-arrays from upper port #01 and from the 20-mm gap between divertor cassettes in divertor port #02. Two gap fan-arrays are located at the upper and lower levels of the divertor. The optical design of fan-array viewing chords from the inside of the dome to ob-serve the inner and outer strike target plates is in process (red hatched viewing fields). The viewing chords from equatorial port #01 are not shown in this schematic draw-ing (see Table 2).
rection while maintaining the poloidal spatial resolution. It is made of synthetic silica and contains a biconvex lens with a thin-height of 250µm, lens front and end surface
curvatures ofr=3.3 mm, and a lens thickness of 6.7 mm. Ten slab-type biconvex lenses are molded into one unit. Five units are bonded with a binding material. Each lens is coupled with an optical fiber with a core diameter of 200µm. The fiber interval is 250µm to fit the micro-lens array. FC-type connectors are attached to 2-m fiber cables on the output side, numbered from #1 to #50.
We measured the spectral light throughput coefficient (´etendue) of the fifty chords of the optical prototype twice over a period of about seven months. Initially, a standard light source (xenon arc lamp) irradiated a Spectralon re-flectance target plate at a distance of 0.50 m. The manufac-turers provided its calibration values of spectral irradiance atλ200 nm -λ800 nm and reflectance of the target plate at
λ250 nm -λ2500 nm. The target plate was placed in front of the first mirror (M1) at a distance of 300 mm. An FC-FC connector and a 20-m optical fiber cable (FC-FC-SMA) transferred the collected light to a portable spectrometer (B&WTEK BTC112).
Figure 3 shows the measured spectral ´etendue of chords #1, #25, and #50 of the optical prototype plotted with solid curves. The spectral ´etendue of chords #1, #25, and #50 is almost constant fromλ400 toλ600 nm at 6.2, 6.8, and 5.0×10⁻¹¹m2 sr, respectively. For shorter wave-lengths, belowλ400 nm, the spectral ´etendue rapidly de-creased to∼2×10⁻¹¹m2 sr atλ320 nm. For longer wave-lengths, aboveλ600 nm, the spectral ´etendue gradually de-creased to∼2×10⁻¹¹m2sr atλ800 nm. The small peaks at
λ723 nm are pseudo-peaks of the xenon line from the light source.
deteri-orated. The center of the plane molybdenum mirror was also tarnished. After about seven months, an integrating sphere (Labsphere USS-1200) was used to re-measure the spectral ´etendue. The light source was a tungsten-halogen lamp. Calibration values of the spectral radiance between
λ300 nm and λ1000 nm were provided by the manufac-turer.
Figure 3 depicts the results plotted with dashed curves for chords #1, #25, and #50. A gradual deterioration of the spectral ´etendue at shorter wavelengths is clearly seen. Atλ400 nm for chord #25, the ´etendue decreases to 6.8×10⁻¹²m2sr, which is one order of magnitude lower than that measured the first time.
A molybdenum corner cube mirror stored in a desic-cator for several years has kept a metallic mirror surface with no degradation in the same experimental room as the mirror showing oxidation. The experimental room is air-conditioned; however, the relative humidity exceeds 80% on some days in the rainy season. We suspect that the high humidity in the air and some treatment during surface pol-ishing might have caused the surface oxidation, leading its surface to gradually deteriorate. A storage case for desic-cation or vacuum pumping for storing the optical head is necessary to maintain the reflectivity of the molybdenum mirrors on a par with a newly produced version.
The spectral ´etendue aroundλ700 nm andλ800 nm is unaffected by surface deterioration. Its value registers a minimum of ∼1.6×10⁻¹¹m2 sr at around λ830 nm. The spectral ´etendue in the wavelength region aboveλ934 nm is too low to measure in this experiment, at least one or-der of magnitude lower than∼2×10⁻¹¹m2 sr. The light-absorption in this wavelength region is enhanced by hy-droxyl (-OH) bonds doped in the optical fiber to increase UV transmittance.
2.2
Spatial resolution of the viewing field
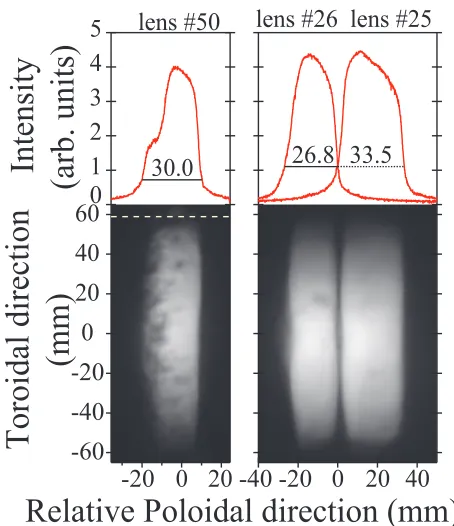
A bright white light from a fiber-coupled Xe lamp was inserted at each end of optical fiber cables connected to the Cassegrain telescope. The image was projected on a white reflectance target plate 8.5 m from the first mirror. The im-ages on the target plate were taken with a digital single-lens reflection camera (Nikon D60 with a zoom lens 18-55 mm F3.5-5.6G). We calibrated the scale of the digital camera image by taking a picture of a cross-sectional paper under the same focal conditions.Figure 4 shows an example of the projected image of the micro-lens coupled optical-fibers. Intensities of 90% are recorded in the width from 27 mm to 34 mm along the poloidal direction. These values satisfy the ITER require-ment of a 50-mm resolution. The surface of lens #50 is rather rough, so the spectral ´etendue of this chord is the lowest of the 50 chords. The intensity of the 5% overlap with the neighboring chord can be seen on the cross sec-tions of lens #25 and #26.
The curvature and thickness of the biconvex
micro-Fig. 4 Photographs showing two-dimensional intensity distribu-tion of the micro-lenses of chords #25, #26, and #50. The cross section (red curve) at the center along the poloidal direction appears above each of the photographs. Widths of the lens images (27 mm to 34 mm) in the poloidal direction are less than 50 mm. This degree of spatial-resolution in the poloidal direction satisfies ITER require-ments. The image of chords #25 and #26 is digitally syn-thesized from separate images of each chord.
lens used in the present experiment arer = 3.3 mm and
t = 6.7 mm, respectively, which are feasible for manu-facturing. If the ideal micro-lens of r = 2.45 mm and
t =7.45 mm becomes feasible in the future, the light col-lection efficiency will increase about three times, which is calculated by a ray tracing simulation code. A Herschelian telescope is also proposed as a collection optics device to increase the light collection efficiency by a factor of 1.3.
For the planned divertor impurity-influx monitor for ITER, spectral emissions in the UV region between
3. Emission Intensity Estimation of
Impurities
The B2-EIRENE code package [25] simulates the neutral atom and ion distribution in the ITER scrape-off layer and divertor private plasma region. The calcu-lated condition is as follows: Ip = 15 MA, BT = 5.3 T,
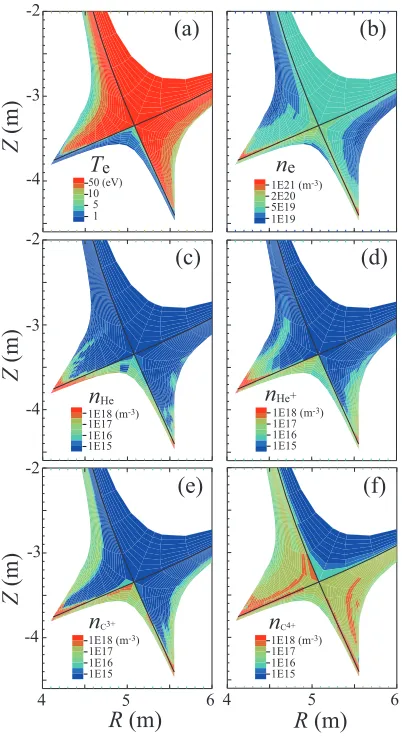
Pfusion = 600 MW, (Q = 20,PNBI = 30 MW), a flux of deuterium from the core of 9×10²¹s−1, and a gas-puffrate of 1.4×10²³s−1. Simulation results are supplied by Dr. Kukushkin [26]. Figure 5 shows the B2-EIRENE simula-tion results, which give the two-dimensional (a)Teand (b)
nedistribution, and (c) helium atom and (d) ion density dis-tribution, and various ion stages of carbon ion distribution. Densities of C3+and C4+are depicted in Fig. 5 (e) and (f), respectively.
The spontaneous transition probability from upper statekto lower statei,Aki, is related to the total intensity
Fig. 5 Two-dimensional distributions of plasma parameters in the divertor plasma, based on B2-EIRENE numerical simulation: (a) electron temperatureTe, (b) electron den-sityne, (c) helium atom densitynHe, (d) helium ion den-sitynHe+, (e) C3+ion densityn
C3+, and (f) C4+ion density nC4+.
Ikiin photon numbers by
Iki= 1
4πAkin(k), (1)
where n(k) is the population density of state k. The level population densities n(k) are calculated based on collisional-radiative (CR) models. The emissivity of im-purity lines from the ITER divertor plasma is estimated by means of CR models on Hei[27, 28] and Civ[12], on the condition of the given plasma parameters (Fig. 5).
Figure 6 shows an example of the two-dimensional emissivity distribution of the Heiλ587.6 nm (23P−33D) line: the ionizing component generated from a helium ground state (a) and the recombining component from He+ ions (b) are separately plotted. For the ionizing compo-nent, high emissivity over (1×10¹⁹ph s−1 m−3 sr−1) is observed around the inner and outer divertor leg strike points (the orange regions shown in Fig. 6 (a)). For the recombining plasma component, the highest emissivity over (1 × 10²⁰ph s−1 m−3 sr−1) is observed in front of the inner divertor-leg strike point (the red region in Fig. 6 (b)). In front of the outer divertor-leg strike point, the emissivity is between 1×10¹⁹ph s−1 m−3 sr−1 and 1×10²⁰ph s−1 m−3 sr−1 (shown in orange). These ten-dencies in emissivity distribution can be observed for other transitions of the Hein=3 ton=2 transition manifold.
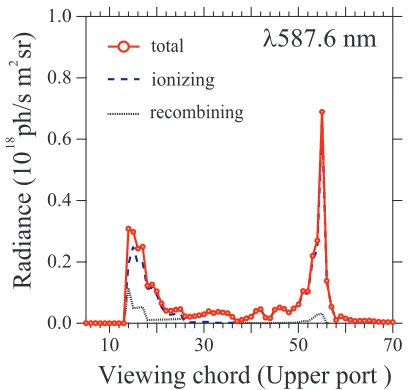
These emission lines of impurities are observed with the fan-array chord from the upper port (see Fig. 1). Fig-ure 7 shows the line-of-sight integrated radiance of the Hei emission lineλ587.6 nm. For the upper port view, emission lines in front of the strike points are eclipsed by the
diver-Fig. 6 Two-dimensional distributions of the emissivity in the units of photons s−1m−3sr−1of Heiλ587.6 nm (23P−
33D) for (a) the ionizing plasma component excited
from the ground state of He atoms: High emissivity (more than 1×10¹⁹ph s−1 m−3 sr−1) is observed around
the inner and outer divertor leg strike points (orange region). (b) The recombining plasma component pro-duced from He+ions. The highest emissivity (more than 1×10²⁰ph s−1 m−3 sr−1) is observed at the inner
diver-tor leg strike point (red region). At the outer strike point, the emissivity ranges between 1×10¹⁹ph s−1m−3sr−1and
Fig. 7 Chord integrated emission intensity of Heiλ587.6 nm (23P−33D). The ionizing plasma component is
dom-inant for the upper port viewing chords.
tor baffle, as shown in Fig. 2. The contribution from the ionizing and recombining plasma components [29] is in-dicated with dashed and dotted curved lines, respectively. Total intensity is plotted with a solid curve and circles. The ionizing plasma component is mostly dominant. Near the strike points in front of the inner and outer divertor tar-gets, the plasma temperature is low (Te < 1 eV) and the density is rather high (ne > 1×10²¹m−3), as shown in Fig. 5 (a) and (b), respectively, leading to speculation that a detached plasma may have formed. The inner and outer divertor target plates will be observed from inside the dome as shown in Fig. 2. Recently, the divertor dome design has been changed. Revision of the internal design of the opti-cal system to fit the changed dome is now underway.
All the helium emission lines from n = 3 to n = 2 transitions are shown in Fig. 8 in logarithmic plots. Fig-ure 8 (a) shows singlet transitions:λ501.6 nm (21S−31P),
λ667.8 nm (21P−31D), and λ728.1 nm (21P−31S), and Fig. 8 (b) shows triplet transitions:λ388.9 nm (23S−33P),
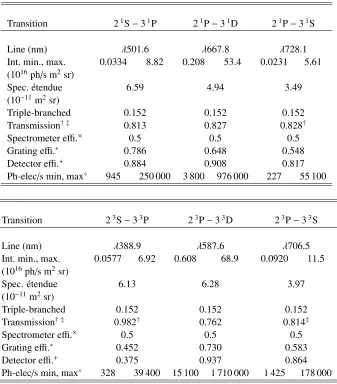
λ587.6 nm (23P−33D), andλ706.5 nm (23P−33S). The maximum and minimum estimated chord-integrated signal intensities in photo-electrons per second for Heiand Civare estimated in Tables 4 and 5, respec-tively. For Hei, because of the low photon radiation around the X-point (see Fig. 6), the lowest estimated signal inten-sity is 227 photoelectrons per second for theλ728.1 nm line (see Table 4). The signal-to-noise ratio is about 25. The line intensity ratios of I(667.8 nm)/I(728.1 nm) and
I(728.1 nm)/I(706.5 nm) are often used as indicators ofne andTe, respectively, on the condition that the population production is dominant from the ionizing plasma compo-nent. To obtain the line-averagedneandTedistributions by means of helium ash, without helium gas puffing at the di-vertor plasma, we need an exposure time of a few seconds
Fig. 8 Chord integrated emission intensity of Hein = 2−3 manifold (a) singlet transitions and (b) triple transitions.
with the present optical system.
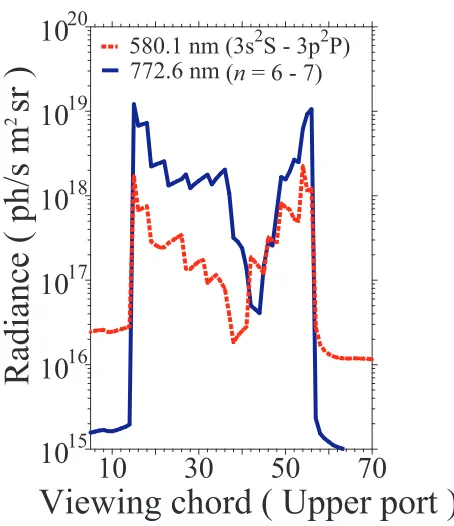
Figure 9 and Table 5 show the chord-integrated radiance of the λ580.5 nm (580.151 nm, 581.214 nm: 3s2S
1/2 −3p2P1/2,3/2) andλ772.6 nm (n = 6 - 7) transi-tions in Civ(C3+) ions and estimated minimum and max-imum photoelectrons we observe by a spectrometer with a CCD detector, respectively. The radiance of theλ772.6 nm (n=6 - 7) emission line is rather high; its highest value is above 1019ph s−1m−2sr−1. It is expected that with a high-resolution spectrometer, spectral profiles of theλ772.6 nm line provideTiat a fast time resolution. This line is domi-nantly populated from the recombining plasma component from C4+ions. The lineλ580.49 nm is important for the branching ratio to λ31.24 nm (2s,2S1
/2 −3p2P1/2,3/2) in
vacuum UV measurements.
From the upper port, the chords observe the di-vertor region through the core plasma. The intensity of bremsstrahlung is estimated to be on the order of 1017ph s−1 m−2 sr−1nm−1 at an electron density of 1× 10²⁰m−3for the chord through the center of the core. If we use a spectrometer, the bremsstrahlung continuum compo-nent and the divertor impurity emission lines are easily dis-tinguishable. For filter spectrometers, filters for monitor-ing the bremsstrahlung continuum are needed in addition to the emission-line filters. For Heiand C iv, emission contributions from the upper common flux region are neg-ligible based on CR model calculations.
The absolute intensity calibration is important for population density estimation. Test results of the in situ calibration method using a micro-retro-reflector array plate located in the front-end optical system are reported sepa-rately [2].
4. Computerized Tomography
Table 4 Estimated photoelectrons per second for Heiemission lines with the CR model.
Transition 21S−31P 21P−31D 21P−31S
Line (nm) λ501.6 λ667.8 λ728.1
Int. min., max. 0.0334 8.82 0.208 53.4 0.0231 5.61 (1016ph/s m2sr)
Spec. ´etendue 6.59 4.94 3.49
(10−11m2sr)
Triple-branched 0.152 0.152 0.152
Transmission† ‡ 0.813 0.827 0.828†
Spectrometer effi.× 0.5 0.5 0.5
Grating effi.∗ 0.786 0.648 0.548
Detector effi.+ 0.884 0.908 0.817
Ph-elec/s min, max 945 250 000 3 800 976 000 227 55 100
Transition 23S−33P 23P−33D 23P−33S
Line (nm) λ388.9 λ587.6 λ706.5
Int. min., max. 0.0577 6.92 0.608 68.9 0.0920 11.5
(1016ph/s m2sr)
Spec. ´etendue 6.13 6.28 3.97
(10−11m2sr)
Triple-branched 0.152 0.152 0.152
Transmission† ‡ 0.982† 0.762 0.814‡
Spectrometer effi.× 0.5 0.5 0.5
Grating effi.∗ 0.452 0.730 0.583
Detector effi.+ 0.375 0.937 0.864
Ph-elec/s min, max 328 39 400 15 100 1 710 000 1 425 178 000
Assumptions: For visible wavelengths, a 100-meter, OH-doped optical fiber transfers the light from the collection optics
to a diagnostics room. †For UV wavelengths, spectrometers are placed near the collection optics behind a bio-shield and connected with a 2-m, OH-doped optical-fiber bundle.‡For the near IR region above 700 nm, a 100-meter Ge-doped optical fiber bundle is used to avoid OH-band absorption.×Spectrometer efficiency depends on the slit width, the spectral reflectivity of the mirrors used and the light-coupling efficiency aberration correction of optical components placed in front of the entrance slit. Here, we assumed it is constant. ∗Efficiency curve of a grating with 1200 grooves/mm and 500 nm braze wavelength. Input light is assumed to be unpolarized. +The quantum efficiency of a CCD detector (ANDOR DU971N-UVB) is used as an example.Dark electrons are estimated to be 9.1 electrons s−1at a detector temperature of−50◦C. The area of 13×10-(16×16)µm2-pixels is assumed for a 200µm core diameter of the optical fiber as the height and a 20µm-slit width for the line profile with a background signal.
have changed this design by moving one of the two gap chords to a higher position on the same side of the diver-tor cassette in diverdiver-tor port #02. The plasma is measured from the outer region through a gap of 20 mm between the divertor cassettes, as shown in Fig. 2, which shows the two gap fan-arrays of the upper and lower viewing chords.
To measure the ionization front at the divertor legs, a 100-mm spatial resolution is required for spectroscopic measurement, as shown in Table 1. The viewing chords for the inner and outer strike points along the divertor legs at the target plates are installed in the divertor dome. The
optical component box and the inner dome optical compo-nents that will fit into the new divertor dome are currently being designed.
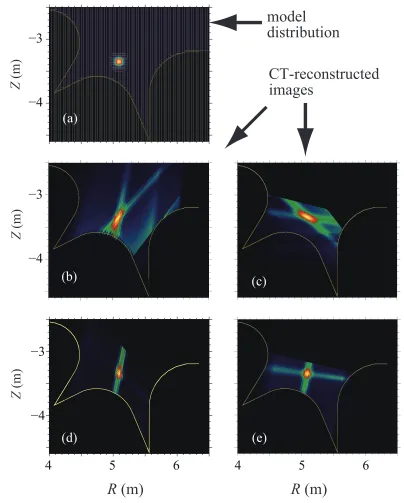
In a CT simulation, a model distribution of the emis-sion intensity, as shown in Fig. 10 (a), is located at the X point with a full-width at half-maximum (FWHM) of 100 mm. Fig. 10 (a)–(e) shows the CT reconstructed im-ages. The maximum entropy method (MEM) [30] is ap-plied to reconstruct a two-dimensional intensity distribu-tion based on the integrated signal intensity. The element
obser-Table 5 Estimated photoelectrons per second for Civemission lines with the CR model.
Transition 3s2S
1/2−3p2P1/2,3/2 n=6−7 Line (nm) λ580.49 (580.151, 580.214) λ772.6
Int. min., max. 1.682 224.7 4.061 1219.1
(1016ph/s m2sr)
Spec. ´etndue 6.81 2.43
(10−11m2sr)
Triply-branched 0.152 0.152
Transmission‡ 0.788 0.857‡
Spectrometer effi.× 0.5 0.5
Grating effi.∗ 0.735 0.508
Detector effi.+ 0.940 0.720
Ph-elec/s min, max 47 400 6 330 000 26 600 7 050 000
The superscript symbols‡,×,∗,+, andare the same as in Table 4.
Fig. 9 Chord-integrated emission intensity from Civ(C3+) ions.
vation chord. The signal intensitygmof them-th detector
can be written as
K
k=1
hmkfk=gm, (2)
wherehmkis the contribution from the image elementfkto the signal intensitygm. We definehmk as the length of the
chord across the image element of fk. We use the evalua-tion funcevalua-tion
P(f)=
K
k=1
fklnfk. (3)
The Lagrange functionΛγ(f) is minimized with an
itera-tive solution technique.
The MEM code used here was originally developed for the divertor measurement of JT-60U plasma [31–33]. We modified the code to the ITER divertor configuration and the divertor impurity-influx monitor.
how-Fig. 10 Computerized tomographic simulation: (a) The model of the intensity distribution of a 100-mm FWHM Gaussian. Reconstructed images: (b) The upper and equatorial chords in ports #01 are used for the reconstruction, (c) Upper and lower gap fan-arrays in divertor port #02 are used for the reconstruction, (d) The upper port chord and lower gap fan-array, and (e) the upper port and upper gap fan-array are used for reconstruction with toroidal symmetry assumed.
ever, that artificially low intensity of base signals is gener-ated in the CT-reconstructed images in a manner that may, for example, form a cross shape, as shown in Fig. 10 (e).
5. Reflectance of Divertor Blocks
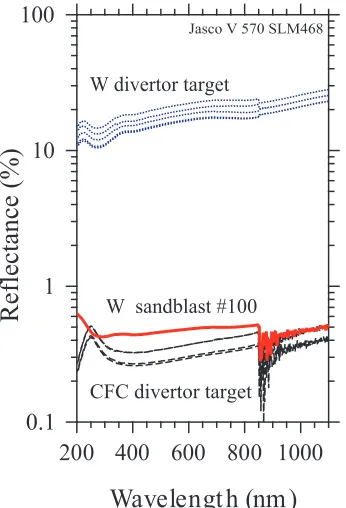
The direct reflection of the bright light sources near the surface of the divertor materials (W and CFC) may af-fect the line-integrated intensity. We measured the spec-tral reflectance (λ200 nm -λ1100 nm) of W and CFC
sam-ple blocks provided by our divertor group. Measurements were performed using a spectrophotometer (Jasco V-570) with a single reflection attachment (SLM-468). The rough-ness of the W plasma-facing surface was less thanRa =
3.2µm. A monochromatic spectral light-ray was inserted at six degrees to normal relative to the surface. The re-flectance of a sandblasted W plate was also measured, be-cause it was expected to exhibit reduced direct reflection.
Fig. 11 Reflectance of the divertor blocks of tungsten (W: dotted lines) and carbon-fiber composite (CFC: dashed lines). The solid curve shows the reflectance of the sandblast-processed W surface. The detector for reflected light changes from a photo-multiplier to a PbS photodetector for wavelengths over 832 nm.
surface of both W and CFC is anisotropic relative to the di-rection of the block because of the circular milling grooves on the W surface and the laminated carbon-fiber sheets.
At the Hα wavelength of 656.3 nm, direct reflection of the W surface ranges from 17 to 23%. The direct re-flection of the CFC surface is lower than that of W; the value ranges between 0.3 and 0.4%. The sandblasted W surface has the highest level of direct reflectance (0.7%) at 200 nm, is down to 0.4% at 275 nm, and is almost constant around 0.5%, gradually increasing with the wavelength. However, surface conditions drastically change due to the massive thermal heat load, erosion, and deposition. Proto-type divertor targets made of CFC and W blocks with cool-ing pipes of CuCrZr have been constructed by the Blanket Technology group in JAEA. A qualification prototype of the divertor plate was sent to the Russian Federation to test the heat load with an electron beam. The post-test quali-fication prototype has since been returned. Recrystalliza-tion on the W surface is observed on some of the blocks. The surface of the recrystallized W looks white. Depo-sition of carbon is observed on a portion of the surfaces of W blocks. In this case, the surface is black. We plan to detailed measurements of the surface conditions of the heat-loaded W and CFC sample tiles.
Acknowledgments
The authors are grateful to Dr. S. Suzuki in the Blan-ket Technology group for supplying us with samples of the divertor blocks. One of the authors (A. I.) wishes to thank Mr. T. Tollefson for his careful reading of the manuscript.
[1] A.J.H. Donn´eet al., Nucl. Fusion47, S337 (2007). [2] H. Ogawaet al., will appear in Nucl. Fusion.Proceedings
of IAEA conferenceIT-p6-23 (2009).
[3] T. Sugieet al.,Burning Plasma Diagnosticsed. G. Gorini
et al. (AIP, 2008) p.218.
[4] H. Ogawaet al., Plasma Fusion Res.2, S1054 (2007). [5] H. Ogawaet al.,Degin of Impurity Influx Monitor
(Diver-tor) for ITERJAEA-Tech. 2006-015 (2006). http://jolissrch-inter.tokai-sc.jaea.go.jp/pdfdata/ JAEA-Technology-2006-015.pdf
[6] T. Sugieet al., J. Plasma Fusion Res.79, 1051 (2003). [7] T. Sugieet al.,Design of Divertor Impurity Monitoring
Sys-tem for ITER (II)JAERI-Tech 98-047 (1998). http://jolissrch-inter.tokai-sc.jaea.go.jp/pdfdata/ JAERI-Tech-98-047.pdf
[8] T. Sugieet al.,Design of Divertor Impurity Monitoring Sys-tem for ITERJAERI-Tech 96-055 (1996).
[9] K.H. Behringer, J. Nucl. Mater.145-147, 145 (1987). [10] N.J. Peacock, Astrophys. Space Sci.237, 341 (1996). [11] H.P. Summerset al., Plasma Phys. Control. Fusion34, 325
(1992).
[12] T. Nakanoet al., J. Plasma Fusion Res.80, 500 (2004). [13] I. Beigmanet al., Plasma Phys. Control. Fusion49, 1833
(2007).
[14] B. Lipschultzet al., Nucl. Fusion24, 977 (1984). [15] C.H. Skinneret al., Nucl. Fusion35, 143 (1995). [16] C.H. Skinneret al., J. Nucl. Mater.241-243, 887 (1997). [17] T. Shikamaet al., Phys. Plasmas11, 47011 (2004). [18] A. Iwamaeet al., Phys. Plasmas12, 042501 (2005). [19] A. Iwamaeet al., Phys. Plasmas14, 042504 (2007). [20] A. Iwamae et al., Plasma Phys. Control. Fusion47, L41
(2005).
[21] T. Fujimoto and A. Iwamae Eds., Plasma Polarization Spectroscopy(Springer, Berlin Heidelberg, 2008). [22] H. Iidaet al.,Nuclear Analysis ReportG 73 DDD 2 W 0.2
(2004).
[23] T. Nishitaniet al., Fusion Eng. Des.42, 443 (1998). [24] T. Sugieet al., J. Nucl. Mater.329-333, 1481 (2004). [25] R. Schneideret al., J. Nucl. Mater.266-269, 175 (1999). [26] V. Kotov, D. Reiter and A. S. Kukushkin,
Numerical study of the ITER divertor plasma with the B2-EIRENE code package(J¨ulich 2007).
http://www.eirene.de/kotov solps42 report.pdf andprivate communication.
[27] M. Goto and T. Fujimoto, Collisional-radiative Model for Neutral Helium in Plasma: Excitation Cross Section and Singlet-triplet Wavefunctsion MixingNIFS-DATA-043 (1997).
http://www.nifs.ac.jp/report/NIFS-DATA-043.pdf [28] M. Goto, JQSRT76, 331 (2003).
[29] T. Fujimoto, Plasma Spectroscopy (Oxford University Press, Oxford, 2004).
[30] N. Iwama and S. Ohdachi, J. Plasma Fusion Res.82, 399 (2006). [in Japanese]