R E S E A R C H
Open Access
Linear quantification of lymphoid infiltration of
the tumor margin: a reproducible method,
developed with colorectal cancer tissues, for
assessing a highly variable prognostic factor
Marc-Antoine Allard
1,2, Jean Baptiste Bachet
1,3,6, Alain Beauchet
4, Catherine Julie
1,5, Robert Malafosse
1,2,
Christophe Penna
1,2,7, Bernard Nordlinger
1,2and Jean-François Emile
1,5*Abstract
Background:Lymphoid infiltration is a prognostic marker in solid tumors, such as colorectal, breast and lung carcinomas. However, lymphoid infiltration is heterogeneous and the reproducibility of quantification based on single counts within a tumor is very low. We aimed to develop a reproducible method for evaluating lymphoid infiltration in tumors.
Methods:Virtual slides were obtained from tissue sections from the localized colorectal carcinomas of 117 patients, stained for CD3 and CD45R0. We assessed the variation of lymphoid cell density by automatic counts in 1 mm-wide, 5μm-long segments of the invasive front, along an axis 4 mm in length running perpendicular to the invasive front of the tumor.
Results:We plotted curves of the variation of lymphocyte density across the tumor front. Three distinct patterns emerged from this linear quantification of lymphocyte (LQLI). In pattern 1, there was a high density of lymphocytes within the tumor. In pattern 2, lymphocyte density peaked close to the invasive margin. In pattern 3, lymphocytes were diffusely distributed, at low density. It was possible to classify all the tumors studied, and interobserver reproducibility was excellent (kappa =0.9). By contrast, single counts of CD3+cells on tissue microarrays were highly variable for a given LQLI pattern, confirming the heterogeneity of lymphoid infiltration within individual tumors. In univariate analysis, all pathologic features (stage, metastatic lymph node ratio (LNR), vascular embolism, perineural invasion), CD3+cell density, LQLI patterns for CD3+and CD45R0+cells) were found to have a significant effect on disease-free survival (DFS). In multivariate analysis, only the LQLI pattern for CD3+cells (HR: 6.02; 95% CI: 2.74-13.18) and metastatic lymph node ratio (HR: 6.14; 95% CI: 2.32-16.2) were associated with DFS.
Conclusion:LQLI is an automated, reproducible method for the assessment of lymphoid infiltration. However, validation of its prognostic value in larger series is required before its introduction into routine practice for prognostic evaluation in patients with colorectal carcinomas.
Virtual slides:The virtual slide(s) for this article can be found here: http://www.diagnosticpathology.diagnomx.eu/ vs/9861460717895880
Keywords:Tumor infiltration, Lymphocytes, Invasive margin, Linear quantification, Colorectal cancer, Image analysis, Automated count
* Correspondence:[email protected] 1EA4340, Versailles SQY University, Boulogne, France 5
Department of Pathology, Ambroise Paré Hospital, APHP, 9 Av. Charles de Gaulle, Boulogne F-92104, France
Full list of author information is available at the end of the article
Background
It is now clearly established that tumor progression depends not only on the biological characteristics of the tumor, but also on the host immune response to the tumor [1,2]. More than four thousand papers have been published on the im-mune response and carcinomas over the last 40 years. Most studies of this aspect in solid cancers, mostly colorectal car-cinoma (CRC), lung and breast cancers, reported a strong correlation between the density of immune cells, particularly lymphocytes, within tumors and long-term survival [3-10]. However, despite this massive body of evidence, lymphocyte infiltration (LI) is not taken into account in daily practice, even for discussions of adjuvant treatment in patients with stage II or III CRC. This paradox is explained by the lack of a reproducible and suitable method for assessing LI. There is, therefore, a need to develop new, more reproducible methods for LI assessment.
Immune cell density is evaluated on slides stained with hematoxylin and eosin (H&E) or byin situ immunohis-tochemistry on tumor samples, performed on whole slides or tissue microarrays (TMA) [11]. In early studies of lymphocyte infiltration, the pathologists counted the lymphocytes within a limited area of the tumor them-selves, by eye [3,4]. However, this method was time-consuming and subject to human error, the area of the tumor considered was small and reproducibility between pathologists was poor. The more recent development of a combination of virtual slide technology and image ana-lysis software has made high-throughput counting pos-sible. This approach has been adopted by several authors, mostly using TMA [5,12]. Lymphocyte density is classified as “high “or “low”, depending on whether the absolute number of lymphocytes obtained is higher or lower than the mean absolute number of lymphocytes for the study population.
TMA-based approaches are cheap and pertinent in this field, but the area analyzed is limited to the size of the TMA core (diameter of 0.6 mm in most studies).
Furthermore, LI is highly heterogeneous within tumors, rendering lymphocyte counts in limited areas highly va-riable. The establishment of a cutoff value for lymphocyte density for the estimation of prognosis is, thus, necessarily biased, and the assessment of tumor lymphoid infiltration based on absolute values for restricted areas is unsatisfac-tory. The aim of this study was to develop a reproducible method for LI quantification, overcoming these problems of variability.
Recent studies of CRC have shown that the prognostic value of LI determinations can be increased by combining lymphocyte densities within and outside the tumor. This suggests that the environment immediately around the tumor should be included in the evaluation of LI [13].
Based on these findings and the need to limit the bias described above, any method for measuring LI must take
large areas of tissue sections, including both tumor tis-sue and the adjacent region, into account. Such methods should also involve automated counting, based on image analysis, to save time and to overcome potential pro-blems of interobserver variability.
We focused on the CRC CD3+ and CD45R0+ lympho-cyte subpopulations for the development of this method, because infiltration with these subpopulations has been widely reported to have an impact on the outcome of CRC [11,13]. We plotted curves of infiltration along an axis running parallel to the invasive front of the tumor and looked for common patterns in a sample of CRC. We then assessed the prognostic value of this method by comparing the results obtained with those for the prog-nostic markers used in routine practice and with single counts of CD3+cells on TMA.
Methods
The first step in this study was the establishment of the linear quantification of lymphocyte infiltration (LQLI) method.
Samples
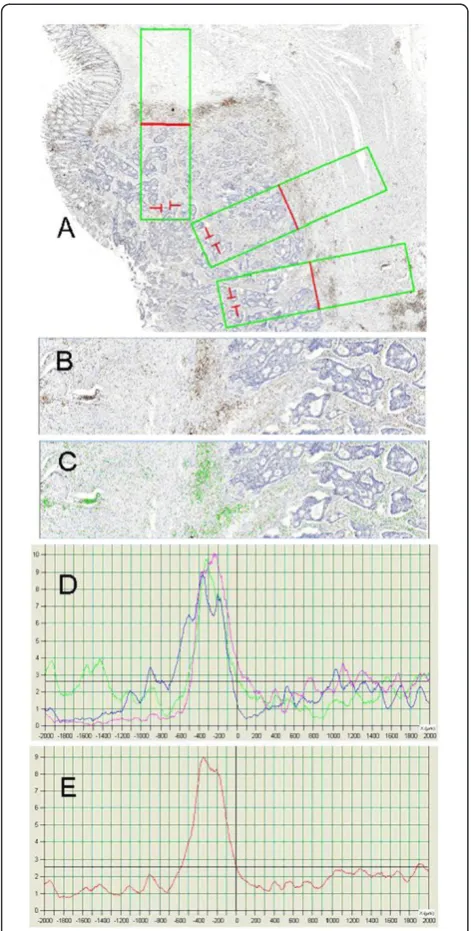
H&E-stained slides of CRC sections were checked for the presence of an invasive tumor front. Formalin-fixed paraffin-embedded (FFPE) blocks containing tumor tis-sue with an invasive front and surrounded tistis-sue were selected for the construction of TMA and the applica-tion of our quantificaapplica-tion method (see below; Figure 1). Paraffin-embedded samples were obtained from the Pathology Department and the tissue bank of Ambroise Paré Hospital, which has been registered with the French Ministry of Research (# DC 2009–933).
Immunohistochemistry
Immunohistochemistry was performed on 4μm-thick sec-tion of FFPE tissue samples, with a Bond autostainer (Leica, Biosystems Newcastle Ltd), after antigen retrieval in citrate buffer pH6 (Leica, Biosystems Newcastle Ltd) and endogenous peroxidase inhibition with 3% H2O2. The
primary antibodies were mouse monoclonal anti-CD3 (1/50, clone F7.2.38, Dako France S.A.S.) and anti-CD45R0 (1/50; clone UCHL1, Dako France) antibodies. Antibody binding was detected and the signal was amplified with the Bond Polymer Refine Detection system (Leica, Biosystems Newcastle Ltd) and hematoxylin counterstaining.
Linear quantification of lymphoid infiltration of the tumor front
Support
France), a commercially available image analysis suite already used in a previous study [14].
Concept
Visilog 9.0 software was specifically developed to express lymphocyte density as a function of the distance from the invasive front of the tumor, defined as the micro-scopic interface between the normal tissue of the host and the tumor mass. In budding tumors, the tumor front was localized close to areas containing groups of at least five cohesive tumor cells. Lymphocyte density was evalu-ated from the outside to the inside of the tumor, along an axis perpendicular to the tangent of the invasive front of the tumor.
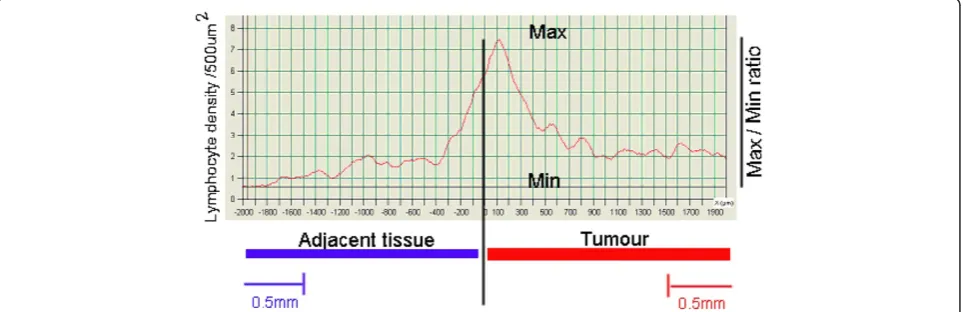
The area analyzed was a rectangle (1 mm × 4 mm), measuring 4 square millimeters (Figure 1). The invasive front of the tumor was manually positioned, by the ob-server, in the middle of the rectangle, with the tumor to the right. Lymphocyte cell density was determined for segments of 5 μm. CD3+ cells were counted as a func-tion of their distance from the invasive front of the tumor, in 5 μm segments from the outside to the inside of the tumor (Figure 2). We named this method the lin-ear quantification of lymphocyte infiltration (LQLI). As counts were standardized for an area 1 mm wide, each lymphocyte density value corresponded to an area of 5000 μm2, and was associated with a distance from the invasive front of the tumor. We then plotted curves of
lymphocyte density from the outside to the inside of the tumors, across the invasive front (Figure 2). We ensured that these curves were comparable between patients by positioning the curve on the axes such that the region surrounding the tumor extended from 0 to 2 mm and the tumor region extended from 2 mm to 4 mm.
Process
In practice, the process was performed as follows:
1. Opening the file for the virtual slide in .mrx or .vms format
2. Automatically generating a 1 × 4 mm rectangle, with preformatted counting areas, measuring 1 mm × 5μm, along an axis running perpendicular to the tumor front
3. Orienting the rectangle and positioning it manually on the virtual slide
4. The simultaneous use of several rectangles on the same virtual slide was possible
5. Automatic detection of lymphocytes based on a three-step process: i) detection based on color thresholding; ii) boundary definition with a watershed approach and iii) filtering on the detected elements on the basis of size
6. Visual validation of the identified lymphocytes. It is possible to modify the default parameters
beforehand (size, blue intensity, red intensity), if necessary, and to check corresponding results as many times as necessary. The three parameters listed here were identified as the most critical during the evaluation of robustness.
7. Up to 100 slides can be prepared before automatic counting.
8. Automatic counting of the lymphocytes in 5μm segments at known distances from the tumor front. Processing time of 40 to 200 seconds per slide, depending on the number of rectangles and the computer used.
9. Automatic generation of a curve of distance from the tumor front (x) versus lymphocyte count (y). The curves for the various rectangles can be merged and used to generate a curve of mean counts.
Manual export of the data in .csv format is possible, for further analyses.
We then compared the prognostic value of LQLI with those of widely used clinical/pathologic parameters, and with CD3+lymphocyte densities determined from TMA cores.
CD3+lymphocyte densities measured with tissue microarrays
TMA blocks were constructed as follows: three cores, each with a diameter of 0.6 mm, were taken from the
Figure 1In situimmunohistochemistry with brown staining of CD3 lymphocytes and blue nuclear staining of all cells including the invasive front (arrows) of a colon
tumor region identified on H&E-stained slides (Figure 1) generated from another FFPE block of the same tumor. A manual tissue-array instrument (Beecher Instruments, Alphelys, Plaisir, France) was used to insert each core into the recipient paraffin block. All positive cells within each core were counted automatically and a mean value for the three cores was obtained in square millimeters and used for statistical analysis.
Evaluation cohort
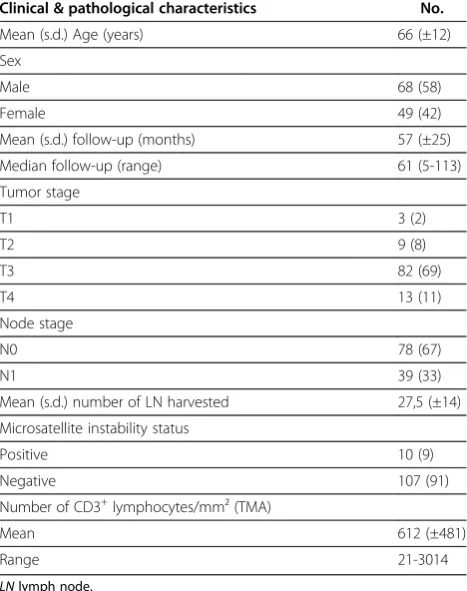
We studied 117 consecutive patients with stage II and III colorectal cancer (International Union Against Cancer [UICC], TNM classification) undergoing“en bloc” resec-tion between January 1998 and December 2008 at Ambroise Paré Hospital (Table 1). Patients with stage II and III CRC constitute a heterogeneous group with a risk of relapse of 15 to 60%, for which improvements in the assessment of prognosis would be of clinical benefit, particularly as concerns decisions relating to adjuvant therapy. None of the patients with stage II CRC received adjuvant treatment. All patients with stage III CRC com-pleted six months of a FOLFOX adjuvant therapy regi-men, in accordance with international recommendations [15,16].
The cohort was rendered more homogeneous co-hort by the exclusion of patients undergoing palliative resection, or with tumor perforation, a personal his-tory of familial adenomatous polyposis coli, previous chemotherapy and radiotherapy or a tumor of the low or mid rectum.
Follow-up consisted of a physical examination, carci-noembryonic antigen (CEA) determination, CT scan or the thorax and abdomen and/or abdominal ultrasound and chest X ray every three months for the first three years and every six months for two years, as recom-mended in the Guidelines of the French Society for Gastroenterology, 2008).
This study was approved by the relevant ethics com-mittee, CPP Ile de France 8 (DC 11 05 45).
Pathology data
All patients included were reviewed for pathological features by two pathologist expert in digestive oncol-ogy (CJ & JFE). Immunostaining for mismatch repair proteins was carried out to diagnose microsatellite instability (MSI) as previously reported [17]. Table 1 summarizes clinical and pathological characteristics of the cohort.
Statistical analysis
Interobservation reproducibility was assessed by calcula-ting the kappa coefficient. The means of three populations were compared by non parametric Kruskal-Wallis tests.
Disease-free survival (DFS) was used as the end-point for prognostic assessment. DFS has been shown to be an appropriate surrogate end-point for overall survival in studies of nonmetastatic colorectal cancer [18]. In survival analysis, we also assessed widely used prognostic factors such as TNM stage, metastatic lymph node ratio (LNR) [19], MSI status, vascular em-bolism and perineural invasion. We also included the CD3+ cell density measured on TMA (Patients were classified as “High LI density” or “Low LI density” with respect to the mean lymphoid density measured with TMA), and LQLI pattern with immunostaining for CD3 and CD45R0. The failure event for DFS analysis was defined as death or relapse. Survival time was cal-culated from the date of surgery to the date of the failure event or last follow-up. The significance of the effect of the variables tested on DFS was assessed by univariate analysis, with log-rank tests. We used a Cox proportional hazards model to assess the prognostic value of all variables identified as significant in univa-riate analysis. A P value ≤ 0.1 was required for entry into the model. Statistical significance was indicated by a P value < 0.05. The analysis was conducted with R software (2.14.1), except for Kaplan-Meier curves, which were plotted with IBM SPSS Statistics 20.
Results
LQLI patterns for CD3+cells
It was possible to apply the LQLI method to all tumors. The LQLI curves for each tumor were all very similar, suggesting that tumors had a specific pattern of lym-phoid cell density variation across the invasive front.
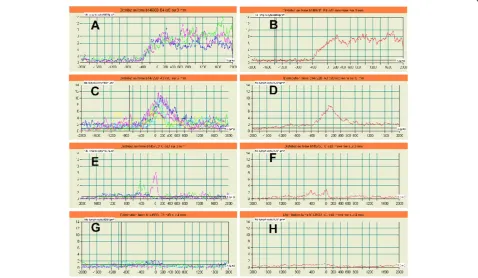
We then tried to define groups of tumors with similar LQLI. Comparisons of the curves obtained led to the iden-tification of three distinct patterns. In the first (pattern 1), lymphocyte density was higher within the tumor than in the region surrounding the tumor. This pattern accounted for 21% of the study population (Figure 3; A, B).
The second pattern was marked by the existence of a significant peak in the invasive front region. This feature corresponded to the presence of large numbers of lym-phocytes in the close vicinity of the tumor. Lymphocyte density increased just ahead of the invasive front, at a mean distance of 400 μm ahead of this front, and declined in the 200 μm beyond the invasive front. This pattern was observed in 61% of patients. The height of the peak was varied considerably between patients, from 3 to 14 CD3+ cells/5000μm2(Figure 3; C, D, E, F) with a mean value of 6.7 CD3+cells/5000μm2.
In the third pattern, the density of CD3+ lymphocytes was low throughout the tumor front, with no significant fluctuation. This pattern was detected in 18% of the patients (Figure 3; G, H).
LQLI pattern for CD45R0+cells
The same three LQLI patterns were observed with CD45R0 immunostaining.
In 104 patients (89%), the type of LQLI pattern was iden-tical with both antibodies. Discrepancies between the LQLI pattern for a given tumor were observed in 13 patients (11%) and mostly concerned patterns 2 and 3 (Table 2).
Heterogeneity of tumor lymphoid infiltration
Mean lymphocyte density, as assessed by automatic count-ing on TMA, was 612 CD3+cells/mm2(range, 21 to 3014). Mean CD3+ cell densities were 922/mm2 (range, 132 to 3014), 581/mm2 (21 to 1768) and 392/mm2 (67 to 846) for patients displaying LQLI patterns 1, 2 and 3, respectively. The differences between the mean CD3+ cell densities for these three patterns were significant (P = 0.002; Figure 4).
The fluctuations in the parts of the curve correspond-ing to the tumor and the surroundcorrespond-ing tissue highlighted the considerable variability of The maximal/minimal tumor CD3+cell density ratio within each tumor ranged from 2.5 to 55, with a median value of 14.5. Heteroge-neity was lower at greater distances from the invasive tumor front. Indeed the median maximal/minimal CD3+ cell density ratios for points 1.5 mm outside and 2 mm
Table 1 Description of the study population
Clinical & pathological characteristics No.
Mean (s.d.) Age (years) 66 (±12)
Sex
Male 68 (58)
Female 49 (42)
Mean (s.d.) follow-up (months) 57 (±25)
Median follow-up (range) 61 (5-113)
Tumor stage
T1 3 (2)
T2 9 (8)
T3 82 (69)
T4 13 (11)
Node stage
N0 78 (67)
N1 39 (33)
Mean (s.d.) number of LN harvested 27,5 (±14)
Microsatellite instability status
Positive 10 (9)
Negative 107 (91)
Number of CD3+lymphocytes/mm² (TMA)
Mean 612 (±481)
Range 21-3014
LNlymph node.
within the tumor were 2.2 (1.2 to 3.5) and 2.4 (1.25 to 4), respectively (Figure 5).
Reproducibility
The robustness of the method was confirmed by analy-zing sections from different paraffin-embedded blocks for a given tumor, carrying out CD3 immunostaining separately on several sections of a given block and gene-rating several virtual slides by multiple scans of a small number of slides. We found that LQLI measurements at different points along the length of the tumor front had no effect on the pattern observed (Figure 2).
The reproducibility of pattern classification was assessed by the analysis of 50 randomly chosen CD3+cell density curves by a surgeon with limited experience in pathology (MAA) and by two experienced pathologists (JFE & CJ).
Interobserver reproducibility was excellent (kappa = 0.93). The mean time required for LQLI and classification of the LI pattern by a pathologist was less than 2 minutes.
Prognostic value of LQLI pattern
After a median follow-up of 61 months (range, 5 to 113), 24 patients (20.5%) had died or relapsed, and 93 patients (79.5%) were alive without recurrence.
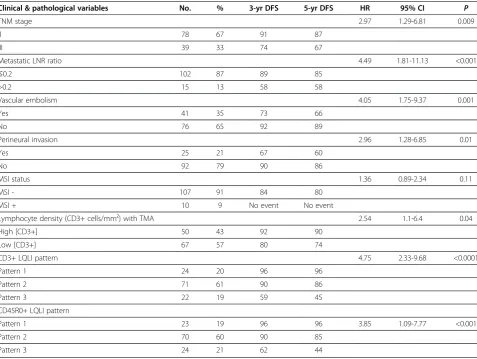
Univariate analysis showed that pT stage and pN sta-tus, the total number of lymph nodes, vascular embolism and perineural invasion were significant prognostic fac-tors. LI, assessed by either CD3 count on TMA or by LQLI, was also a prognostic factor. Ten patients had CRC with high levels of MSI. Four of these patients had LQLI pattern 1, five had LQLI pattern 2 and one had LQLI pattern 3. None of the patients with high-MSI tumors relapsed, but MSI status was not identified as a significant prognostic value in this series of 117 patients. These results and the corresponding three- and five-year DFS results for each variable are reported in Table 3.
On multivariate analysis, LQLI pattern for CD3+ cells (HR: 6.02; 95% CI: 2.74-13.18;P< 0.001) and metastatic lymph node ratio (HR: 6.14; 95% CI: 2.32-16.2;P< 0.001) were independently associated with DFS (Table 4). Patients with high CD3+ cell densities on TMA had a
Figure 3Left side (A, C, E, G): Curves derived from different measures performed on 4 tumors.Right side (B, D, F, H): Different pattern of lymphocytic infiltration defined according to the mean curve derived from the different measures in A, C, E and G respectively. Pattern 1: High density of positive lymphocytes within the tumors (A, B). Pattern 2: High Peak of lymphocyte density within the non-tumorous tissues localized nearby the tumors (C, D) and Low Peak of lymphocyte density within the non-tumorous tissues localized nearby the tumors (E, F). Pattern 3: Uniform low lymphocyte density (G,H).
Table 2 Discrepancies between the LQLI patterns for CD3+and CD45R0+cells
Number of patients CD45R0+ CD3+
4 Pattern 2 Pattern 3
1 Pattern 1 Pattern 2
6 Pattern 3 Pattern 2
better DFS than patients with low CD3+ cell densities (92% and 90% versus 80% and 74% at 3 and 5 years;
P = 0.04; Figure 6). However, this factor was not sig-nificant in multivariate analysis. Patients displaying pattern 3 had worse outcomes than those displaying pattern 1 or 2, regardless of the antibody (directed against CD3 or CD45R0) used. With immunostaining for CD3, three- and five-year DFS was 96% and 96%, respectively, in patients with pattern 1, 90% and 86% in patients with pattern 2, and 59% and 45% in patients with pattern 3 (Figure 7).
Discussion
Many studies have already demonstrated the prognostic value of lymphoid infiltration (LI) in CRC [3-5,11-13]. However, LI evaluation is still not used in daily practice to determine whether a patient should receive adjuvant
treatment. Automated counts on virtual immune-stained slides from patients with CRC have already been investi-gated in other studies [12,13]. We developed an auto-mated method of LI evaluation suitable for use in routine clinical practice.
Our automated method has several specific features accounting for its robustness and high level of reprodu-cibility. The size of area analyzed (more than 14 times the area of a TMA core) limits the impact of count va-riability due to the heterogeneity of LI. Furthermore, taking into account the demonstration, by Gallon et al., of the prognostic value of lymphocyte density in a region adjacent to the tumor, the method developed here includes both tumor tissue and the surrounding non tumor tissue [13]. Finally, we decided to focus on the variation of lymphocyte density across the invasive front, from the non tumor region to the centre of the tumor, rather than obtaining a mean value for one or two areas. Interestingly, we were able, with a sample of 117 patients with stage II or III CRC, to identify three different curve patterns and to associate these patterns with long-term outcome. One of the original findings of this study was the presence of a peak of lymphocyte density around the invasive front of the tumor in the curves or more than half (61%) the study population. This finding is reminis-cent of the high lymphocyte densities found at the inva-sive margin of colorectal liver metastases, which are also associated with a favorable outcome [20].
Lymphocyte density has been assessed by several methods, including the counting of lymphocytes on H&E-stained sections and immunostaining. It has been evaluated on TMA and on whole slides [5,11-13,21]. Immunostained slides have been evaluated by a patho-logist [22] or by dedicated software. A recent study confirmed that the results of automated counting of tumor-infiltrating lymphocytes based on image analysis are closely correlated with the semi-quantitative results
Figure 4Distribution of CD3+ density according to the LQL pattern.
obtained by a pathologist [23]. Software can be used to evaluate the percentage of the study area that is immu-noreactive [11] or to identify lymphocytes by segmenta-tion [12]. Such segmentasegmenta-tion-based analysis may prove difficult if the lymphocytes are located close together [21]. We obtained identical patterns for analyses of the percentage of the area displaying immunoreactivity and for analyses based on the identification of positive cells.
In most studies, receiver operating characteristic (ROC) curve analysis, with survival as the end-point, is used to determine the cutoff values. This method is problematic in that the mean values obtained cannot be
used for patients of other series or in routine practice. This drawback does not apply to LQLI patterns, which are not dependent on the definition of a single thresh-old value. The LQLI method had a better prognostic value than counts based on the use of TMA techno-logy, and the results obtained were independent of the analysis area. The LQLI method was also feasible for all tumor subtypes, provided that the invasive front was included in the paraffin-embedded block. The only processes requiring direct human intervention in the LQLI method are the positioning of the rectangle for analysis on the virtual slides and determination of the curve pattern. Interobserver reproducibility was excel-lent (kappa = 0.93).
Microsatellite instability has been shown to be predic-tive of a favorable outcome, even in the absence of adju-vant therapy, in colorectal cancer. Tumors displaying microsatellite instability are known to have rich lym-phoid infiltrates [24-26]. It is therefore important to consider microsatellite status when assessing LI and
Table 4 Multivariate analysis of disease-free survival
Variable Multivariate analysis
HR 95% CI P
Metastatic LNR 6.14 2.32-16.2 <0.001
CD3+LQL pattern 6.02 2.74-13.18 <0.001 LNRlymph node ratio,HRhazard ratio,CIconfidence interval.
Table 3 Univariate analysis of pathological variables and two automated techniques (CD3+ cell counts from TMA and LQLI) for disease-free survival
Clinical & pathological variables No. % 3-yr DFS 5-yr DFS HR 95% CI P
TNM stage 2.97 1.29-6.81 0.009
II 78 67 91 87
III 39 33 74 67
Metastatic LNR ratio 4.49 1.81-11.13 <0.001
≤0.2 102 87 89 85
>0.2 15 13 58 58
Vascular embolism 4.05 1.75-9.37 0.001
Yes 41 35 73 66
No 76 65 92 89
Perineural invasion 2.96 1.28-6.85 0.01
Yes 25 21 67 60
No 92 79 90 86
MSI status 1.36 0.89-2.34 0.11
MSI - 107 91 84 80
MSI + 10 9 No event No event
Lymphocyte density (CD3+ cells/mm²) with TMA 2.54 1.1-6.4 0.04
High [CD3+] 50 43 92 90
Low [CD3+] 67 57 80 74
CD3+ LQLI pattern 4.75 2.33-9.68 <0.0001
Pattern 1 24 20 96 96
Pattern 2 71 61 90 86
Pattern 3 22 19 59 45
CD45R0+ LQLI pattern
Pattern 1 23 19 96 96 3.85 1.09-7.77 <0.001
Pattern 2 70 60 90 85
Pattern 3 24 21 62 44
prognosis. In our study, only one of the 10 patients with MSI-positive tumors had a low density of lymphocytes both in and around the tumor (pattern 3). CD3+ cell density was higher in the MSI+ group than in tumors without MSI, and the other nine patients displayed LI patterns 1 and 2, but these differences were not statisti-cally significant. No relapses were recorded in the
MSI-positive group, but MSI status was not identified as signifi-cantly predictive of disease-free survival, possibly due to the small number of patients with MSI-positive tumors.
Another important feature of LI is the location of lym-phocytes within the tumor. Indeed, the infiltration of cancer cell networks by CD8+ T cells has been reported to be of prognostic value in colorectal cancer [27].
Figure 6Kaplan Meier disease-free survival curve according to CD3+ densities measured on TMA cores.
Kayser et al. have shown that stromal T cells affect survival in patients with non-small cell lung cancer [28]. We did not investigate the prognostic significance of the location of the lymphocytes within the tumor (stroma versus epithelial tumor cells) with our method. Little is currently known about the precise role of lymphocyte lo-cation and its impact on prognosis, and further investiga-tions and confirmation in a different subset of solid tumors are required before this method can be adopted as a standard approach.
By contrast, a number of studies have investigated the nature of the lymphocytes infiltrating tumors. Galon
et al. analyzed four lymphoid markers (CD3, CD8, CD45R0, granzyme B) and found that combined analysis of CD3+and CD45RO+lymphocyte densities in the cen-ter of the tumor and the invasive margin had the best prognostic value [13]. In an independent series, FoxP3 was the only prognostic marker identified, with CD45RO and CD8 significant only in univariate analysis [12]. Both these studies were performed on tissue arrays. The in-nate immune response may also play an important role in tumor control, as shown by the prognostic value of the density of tumor-infiltrating NK cells and macro-phages [29]. Moreover, the respective proportions and the location of the various leukocyte subpopulations with respect to the tumor may be important, as already demonstrated for breast carcinomas [30].
Conclusion
In conclusion, we describe an original method (LQLI) for the evaluation of LI, plotted as a function of the dis-tance from the invasive front of the tumor. This method is reproducible for a given tumor, and has a better prog-nostic value than CD3+ cell counts on TMA, which is highly variable and less reliable at the individual level. It is easy to use, and results for virtual slides can be obtained in less than two minutes. The LQLI method thus appears to be a powerful tool for investigations of the anti-tumor immune response. Further studies are required to determine which leukocyte subpopulation has the best prognostic value in large series of patients.
Abbreviations
CRC: Colorectal cancer; LQLI: Linear quantification of lymphocyte infiltration; LI: Lymphocyte infiltration; MSI: Microsatellite instability; H&E: Hematoxylin and eosin; TMA: Tissue microarray; FFPE: Formalin-fixed paraffin-embedded; CI: Confidence interval; HR: Hazard ratio.
Competing interests
The authors declare that they have no competing interests.
Authors’contributions
MAA & JFE conceived the experiment, collected and analyzed data, and wrote the manuscript. JBB collected data. MAA and AB were responsible for the statistical analysis, CJ, CP, RM and BN analyzed data. All the authors approved the manuscript.
Acknowledgments
We would like to thank theBenoit Malassagne Associationfor the grant awarded to MAA for this research, and François Germain and José Ramos Magalhaes for fruitful discussions relating to software development.
Author details
1EA4340, Versailles SQY University, Boulogne, France.2Department of Digestive and Oncological Surgery, Ambroise Paré Hospital, APHP, Boulogne, France.3Department of Digestive Oncology, Ambroise Paré Hospital, APHP, Boulogne, France.4Department of Clinical Research, and Ambroise Paré Hospital, APHP, Boulogne, France.5Department of Pathology, Ambroise Paré Hospital, APHP, 9 Av. Charles de Gaulle, Boulogne F-92104, France.6present address: Hôpital de la Pitié, APHP, Paris, France.7present address: Hôpital de Bicêtre, APHP, Bicêtre, France.
Received: 20 August 2012 Accepted: 4 November 2012 Published: 13 November 2012
References
1. Dunn GP, Bruce AT, Ikeda H, Old LJ, Schreiber RD:Cancer immunoediting: from immunosurveillance to tumor escape.Nat Immunol2002,3:991–998. 2. Shankaran V, Ikeda H, Bruce AT, White JM, Swanson PE, Old LJ, Schreiber RD:
IFNgamma and lymphocytes prevent primary tumour development and shape tumour immunogenicity.Nature2001,410:1107–1111.
3. House AK, Watt AG:Survival and the immune response in patients with carcinoma of the colorectum.Gut1979,20:868–874.
4. Jass JR:Lymphocytic infiltration and survival in rectal cancer.J Clin Pathol 1986,39:585–589.
5. Pagès F, Berger A, Camus M, Sanchez-Cabo F, Costes A, Molidor R, Mlecnik B, Kirilovsky A, Nilsson M, Damotte D, Meatchi T, Bruneval P, Cugnenc P-H, Trajanoski Z, Fridman W-H, Galon J:Effector memory T cells, early metastasis, and survival in colorectal cancer.N Engl J Med2005,353:2654–2666. 6. Sato E, Olson SH, Ahn J, Bundy B, Nishikawa H, Qian F, Jungbluth AA,
Frosina D, Gnjatic S, Ambrosone C, Kepner J, Odunsi T, Ritter G, Lele S, Chen Y-T, Ohtani H, Old LJ, Odunsi K:Intraepithelial CD8+ tumor-infiltrating lymphocytes and a high CD8+/regulatory T cell ratio are associated with favorable prognosis in ovarian cancer.Proc Natl Acad Sci USA2005,102:18538–18543.
7. Zingg U, Montani M, Frey DM, Dirnhofer S, Esterman AJ, Went P, Oertli D:
Tumour-infiltrating lymphocytes and survival in patients with adenocarcinoma of the oesophagus.Eur J Surg Oncol2010,36:670–677. 8. Wang B, Xu D, Yu X, Ding T, Rao H, Zhan Y, Zheng L, Li L:Association of
intra-tumoral infiltrating macrophages and regulatory T cells is an independent prognostic factor in gastric cancer after radical resection. Ann Surg Oncol2011,18:2585–2593.
9. Droeser R, Zlobec I, Kilic E, Güth U, Heberer M, Spagnoli G, Oertli D, Tapia C:
Differential pattern and prognostic significance of CD4+, FOXP3+ and IL-17+ tumor infiltrating lymphocytes in ductal and lobular breast cancers. BMC Cancer2012,12:134.
10. Shimizu K, Nakata M, Hirami Y, Yukawa T, Maeda A, Tanemoto K: Tumor-infiltrating Foxp3+ regulatory T cells are correlated with cyclooxygenase-2 expression and are associated with recurrence in resected non-small cell lung cancer.J Thorac Oncol2010,5:585–590.
11. Laghi L, Bianchi P, Miranda E, Balladore E, Pacetti V, Grizzi F, Allavena P, Torri V, Repici A, Santoro A, Mantovani A, Roncalli M, Malesci A:CD3+ cells at the invasive margin of deeply invading (pT3-T4) colorectal cancer and risk of post-surgical metastasis: a longitudinal study.Lancet Oncol2009,
10:877–884.
12. Salama P, Phillips M, Grieu F, Morris M, Zeps N, Joseph D, Platell C, Iacopetta B:
Tumor-infiltrating FOXP3+ T regulatory cells show strong prognostic significance in colorectal cancer.J Clin Oncol2009,27:186–192.
13. Galon J, Costes A, Sanchez-Cabo F, Kirilovsky A, Mlecnik B, Lagorce-Pagès C, Tosolini M, Camus M, Berger A, Wind P, Zinzindohoué F, Bruneval P, Cugnenc P-H, Trajanoski Z, Fridman W-H, Pagès F:Type, density, and location of immune cells within human colorectal tumors predict clinical outcome.Science2006,313:1960–1964.
15. André T, Boni C, Mounedji-Boudiaf L, Navarro M, Tabernero J, Hickish T, Topham C, Zaninelli M, Clingan P, Bridgewater J, Tabah-Fisch I, de Gramont A:Oxaliplatin, fluorouracil, and leucovorin as adjuvant treatment for colon cancer.N Engl J Med2004,350:2343–2351.
16. Schrag D, Somerfield MR, Cohen AM, Figueredo AT, Flynn PJ, Krzyzanowska MK, Maroun J, McAllister P, Van Cutsem E, Brouwers M, Charette M, Haller DG:
American Society of Clinical Oncology recommendations on adjuvant chemotherapy for stage II colon cancer.J Clin Oncol2004,22:3408–3419. 17. Julié C, Trésallet C, Brouquet A, Vallot C, Zimmermann U, Mitry E, Radvanyi F,
Rouleau E, Lidereau R, Coulet F, Olschwang S, Frébourg T, Rougier P, Nordlinger B, Laurent-Puig P, Penna C, Boileau C, Franc B, Muti C, Hofmann-Radvanyi H:Identification in daily practice of patients with Lynch syndrome (hereditary nonpolyposis colorectal cancer): revised Bethesda guidelines-based approach versus molecular screening.Am. J. Gastroenterol2008,
103:2825–2835. quiz 2836.
18. Sargent DJ, Wieand HS, Haller DG, Gray R, Benedetti JK, Buyse M, Labianca R, Seitz JF, O’Callaghan CJ, Francini G, Grothey A, O’Connell M, Catalano PJ, Blanke CD, Kerr D, Green E, Wolmark N, Andre T, Goldberg RM, De Gramont A:
Disease-free survival versus overall survival as a primary end point for adjuvant colon cancer studies: individual patient data from 20,898 patients on 18 randomized trials.J Clin Oncol2005,23:8664–8670.
19. Berger AC, Sigurdson ER, LeVoyer T, Hanlon A, Mayer RJ, Macdonald JS, Catalano PJ, Haller DG:Colon cancer survival is associated with decreasing ratio of metastatic to examined lymph nodes.J Clin Oncol 2005,23:8706–8712.
20. Halama N, Michel S, Kloor M, Zoernig I, Benner A, Spille A, Pommerencke T, von Knebel DM, Folprecht G, Luber B, Feyen N, Martens UM, Beckhove P, Gnjatic S, Schirmacher P, Herpel E, Weitz J, Grabe N, Jaeger D:Localization and density of immune cells in the invasive margin of human colorectal cancer liver metastases are prognostic for response to chemotherapy. Cancer Res2011,71:5670–5677.
21. Halama N, Zoernig I, Spille A, Westphal K, Schirmacher P, Jaeger D, Grabe N:
Estimation of immune cell densities in immune cell conglomerates: an approach for high-throughput quantification.PLoS One2009,4:e7847. 22. Prall F, Dührkop T, Weirich V, Ostwald C, Lenz P, Nizze H, Barten M:
Prognostic role of CD8+ tumor-infiltrating lymphocytes in stage III colorectal cancer with and without microsatellite instability.Hum Pathol 2004,35:808–816.
23. Rizzardi AE, Johnson AT, Vogel RI, Pambuccian SE, Henriksen J, Skubitz AP, Metzger GJ, Schmechel SC:Quantitative comparison of
immunohistochemical staining measured by digital image analysis versus pathologist visual scoring.Diagn Pathol2012,7:42.
24. Parc Y, Gueroult S, Mourra N, Serfaty L, Fléjou J-F, Tiret E, Parc R:Prognostic significance of microsatellite instability determined by
immunohistochemical staining of MSH2 and MLH1 in sporadic T3N0M0 colon cancer.Gut2004,53:371–375.
25. Ribic CM, Sargent DJ, Moore MJ, Thibodeau SN, French AJ, Goldberg RM, Hamilton SR, Laurent-Puig P, Gryfe R, Shepherd LE, Tu D, Redston M, Gallinger S:Tumor microsatellite-instability status as a predictor of benefit from fluorouracil-based adjuvant chemotherapy for colon cancer. N Engl J Med2003,349:247–257.
26. Michael-Robinson JM, Biemer-Hüttmann A, Purdie DM, Walsh MD, Simms LA, Biden KG, Young JP, Leggett BA, Jass JR, Radford-Smith GL:Tumour infiltrating lymphocytes and apoptosis are independent features in colorectal cancer stratified according to microsatellite instability status.Gut2001,48:360–366. 27. Naito Y, Saito K, Shiiba K, Ohuchi A, Saigenji K, Nagura H, Ohtani H:CD8+ T cells infiltrated within cancer cell nests as a prognostic factor in human colorectal cancer.Cancer Res1998,58:3491–3494.
28. Kayser G, Schulte-Uentrop L, Sienel W, Werner M, Fisch P, Passlick B, Zur Hausen A, Stremmel C:Stromal CD4/CD25 positive T-cells are a strong and independent prognostic factor in non-small cell lung cancer patients, especially with adenocarcinomas.Lung Cancer2012,76:445–451. 29. Coca S, Perez-Piqueras J, Martinez D, Colmenarejo A, Saez MA, Vallejo C,
Martos JA, Moreno M:The prognostic significance of intratumoral natural killer cells in patients with colorectal carcinoma.Cancer1997,79:2320–2328. 30. Ladoire S, Mignot G, Dabakuyo S, Arnould L, Apetoh L, Rébé C, Coudert B,
Martin F, Bizollon MH, Vanoli A, Coutant C, Fumoleau P, Bonnetain F, Ghiringhelli F:In situimmune response after neoadjuvant chemotherapy for breast cancer predicts survival.J Pathol2011,224:389–400.
doi:10.1186/1746-1596-7-156
Cite this article as:Allardet al.:Linear quantification of lymphoid infiltration of the tumor margin: a reproducible method, developed with colorectal cancer tissues, for assessing a highly variable prognostic factor.Diagnostic Pathology20127:156.
Submit your next manuscript to BioMed Central and take full advantage of:
• Convenient online submission
• Thorough peer review
• No space constraints or color figure charges
• Immediate publication on acceptance
• Inclusion in PubMed, CAS, Scopus and Google Scholar
• Research which is freely available for redistribution