doi: 10.1093/bioinformatics/xxxxx Advance Access Publication Date: DD Month YYYY Original papers
Genome analysis
SNP Interaction Pattern Identifier (SIPI): An
In-tensive Search for SNP-SNP Interaction
Pat-terns
Hui-Yi Lin
1,*, Dung-Tsa Chen
2, Po-Yu Huang
3, Yung-Hsin Liu
4, Augusto Ochoa
5,
Jovanny Zabaleta
5, Donald E. Mercante
1, Zhide Fang
1, Thomas A. Sellers
6, Julio
Pow-Sang
7, Chia-Ho Cheng
2, Rosalind Eeles
8,9, Doug Easton
10, Zsofia Kote-Jarai
8,
Ali Amin Al Olama
10, Sara Benlloch
10, Kenneth Muir
11, Graham G. Giles
12, 13,
Fredrik Wiklund
14, Henrik Gronberg
14, Christopher A. Haiman
15, Johanna
Schleutker
16,17, Børge G. Nordestgaard
18, Ruth C. Travis
19, Freddie Hamdy
20, Nora
Pashayan
21, 38, Kay-Tee Khaw
22, Janet L. Stanford
23, 24, William J. Blot
25, Stephen
N. Thibodeau
26, Christiane Maier
27, Adam S. Kibel
28, 29, Cezary Cybulski
30, Lisa
Cannon-Albright
31, Hermann Brenner
32. 33, 39, Radka Kaneva
34, Jyotsna Batra
35,
Manuel R. Teixeira
36, Hardev Pandha
37, Yong-Jie Lu
40, the PRACTICAL
consorti-um
41, and Jong Y. Park
61
Biostatistics Program, School of Public Health, Louisiana State University Health
Scienc-es Center, New Orleans, LA 70112, USA.
2Department of Biostatistics and Bioinformatics,
Moffitt Cancer Center & Research Institute, Tampa, FL 33612, USA.
3Computational
Intelligence Technology Center, Industrial Technology Research Institute, Hsinchu City,
Taiwan.
4Department of Biometrics, INC Research, LLC, Raleigh, NC 27609, USA.
5Stan-ley S. Scott Cancer Center, Louisiana State University Health Sciences Center, New
Orle-ans, LA 70112, USA.
6Department of Cancer Epidemiology, Moffitt Cancer Center &
Re-search Institute, Tampa, FL 33612, USA.
7Department of Genitourinary Oncology, Moffitt
Cancer Center & Research Institute, Tampa, FL 33612, USA.
8The Institute of Cancer
Re-search, London, SM2 5NG, UK,
9Royal Marsden NHS Foundation Trust, London, SW3 6JJ,
UK,
10Centre for Cancer Genetic Epidemiology, Department of Public Health and Primary
Care, University of Cambridge, Strangeways Research Laboratory, Worts Causeway,
Cambridge, UK,
11University of Warwick, Coventry, UK,
12Cancer Epidemiology Centre,
The Cancer Council Victoria, 615 St Kilda Road, Melbourne, Victoria, 3004, Australia,
13Ox-ford, John Radcliffe Hospital, OxOx-ford, UK,
21Centre for Cancer Genetic Epidemiology,
De-partment of Oncology, University of Cambridge, Strangeways Research Laboratory, Worts
Causeway, Cambridge, UK,
22Cambridge Institute of Public Health, University of
Cam-bridge, Forvie Site, Robinson Way, Cambridge CB2 0SR, UK, 23
Division of Public Health
Sciences, Fred Hutchinson Cancer Research Center, Seattle, Washington, USA,
24De-partment of Epidemiology, School of Public Health, University of Washington, Seattle,
Washington, USA,
25International Epidemiology Institute, 1455 Research Blvd., Suite 550,
Rockville, MD 20850, USA,
26Department of Laboratory Medicine and Pathology, Mayo
Clinic, Rochester, MN, USA,
27Institute of Human Genetics University Hospital Ulm,
Ger-many,
28Brigham and Women's Hospital/Dana-Farber Cancer Institute, USA, 45 Francis
Street- ASB II-3, Boston, MA 02115, USA,
29Washington University, St Louis, Missouri,
USA,
30International Hereditary Cancer Center, Department of Genetics and Pathology,
Pomeranian Medical University, Szczecin, Poland,
31Division of Genetic Epidemiology,
Department of Medicine, University of Utah School of Medicine, USA,
32Division of Clinical
Epidemiology and Aging Research, German Cancer Research Center (DKFZ), Heidelberg,
Germany,
33Division of Preventive Oncology, German Cancer Research Center (DKFZ)
and National Center for Tumor Diseases (NCT), Heidelberg, Germany,
34Molecular
Medi-cine Center and Department of Medical Chemistry and Biochemistry, Medical University -
Sofia, 2 Zdrave St, 1431, Sofia, Bulgaria,
35Australian Prostate Cancer Research
Centre-Qld, Institute of Health and Biomedical Innovation and Schools of Life Science and Public
Health, Queensland University of Technology, Brisbane, Australia,
36Department of
Genet-ics, Portuguese Oncology Institute, Porto, Portugal and Biomedical Sciences Institute
(ICBAS), Porto University, Porto, Portugal,
37The University of Surrey, Guildford, Surrey,
GU2 7XH, UK,
38University College London, Department of Applied Health Research, 1-19
Torrington Place, London, WC1E 7HB, UK,
39German Cancer Consortium (DKTK), German
Cancer Research Center (DKFZ), Heidelberg Germany,
40Centre for Molecular Oncology,
Barts Cancer Institute, Queen Mary University of London, John Vane Science Centre,
Charterhouse Square, London, EC1M 6BQ, UK,
41Additional members from the Prostate
Cancer Association Group to Investigate Cancer Associated Alterations in the Genome
(PRACTICAL) consortium to be provided in the supplement.
*To whom correspondence should be addressed.
Associate Editor: XXXXXXX
Received on XXXXX; revised on XXXXX; accepted on XXXXX
Abstract
Motivation: Testing SNP-SNP interactions is considered as a key for overcoming bottlenecks of ge-netic association studies. However, related statistical methods for testing SNP-SNP interactions are underdeveloped. Results: We propose the SNP Interaction Pattern Identifier (SIPI), which tests 45 biologically meaningful interaction patterns for a binary outcome. SIPI takes non-hierarchical models, inheritance modes, and mode coding direction into consideration. The simulation results show that SIPI has higher power than MDR (Multifactor Dimensionality Reduction), AA_Full, Geno_Full (full interaction model with additive or genotypic mode) and SNPassoc in detecting interactions. Applying SIPI to the prostate cancer PRACTICAL consortium data with approximately 21,000 patients, the four
SNP pairs in EGFR-EGFR, EGFR-MMP16, and EGFR-CSF1 were found to be associated with
pros-tate cancer aggressiveness with the exact or similar pattern in the discovery and validation sets. A similar match for external validation of SNP-SNP interaction studies is suggested. We demonstrated that SIPI not only searches for more meaningful interaction patterns but can also overcome the un-stable nature of interaction patterns.
Availability: The SIPI software is freely available at http://publichealth.lsuhsc.edu/LinSoftware/. Contact: [email protected]
1
Introduction
During the past decade, the genome-wide association studies (GWAS) have successfully identified many inherited genetic variants (or SNPs) associated with complex diseases, such as cancer or related phenotypes. However, the predictive power of cancer risk for the GWAS-identified SNPs is small by a median of 1.2 per-allele odds ratio (Ioannidis, et al., 2010). The predictive power of these GWAS SNPs can be improved by combining multiple SNPs in a prediction model (Van den Broeck, et al., 2014). We recently reported the polygenic genetic models to estimate their risk for prostate cancer (Al Olama, et al., 2014; Amin Al Olama, et al., 2015; Eeles, et al., 2013). Despite these efforts, major proportion of familiar risk of prostate cancer remains unknown. The similar situation applies for using SNPs to predict prostate cancer prognosis (Van den Broeck, et al., 2014). It is well known that biological associations among genes are complicated. The majority of GWAS focus on identification of individual SNP effects, which are not sufficient to explain the complexi-ty of disease causalicomplexi-ty. It has been shown that gene-gene/SNP-SNP in-teractions play an important role in the etiology of complex diseases (Cordell, 2009; Moore, 2003; Moore and Williams, 2002; Onay, et al., 2006). Although SNP-SNP or gene-gene interaction studies have been emerging, the statistical methods for evaluating SNP-SNP interactions are still underdeveloped.
The majority of genetic association studies focus on two-way interac-tions with two SNPs involved. In the past decade, various statistical methods have been proposed for evaluating two-way SNP-SNP interac-tions. These methods can be classified either model-based or pattern-based. The most common model-based approach tests an interaction based on a full interaction model (hierarchical model) with both main effects and their interaction and SNPs could be treated as different inher-itance mode (such as additive, dominant, recessive, and genotypic). Examples include the full interaction model in PLINK(Purcell, et al., 2007), SNPassoc (Gonzalez, et al., 2007) and the 2nd stage of the
Boole-an Operation-based Screening Boole-and Testing (BOOST) (WBoole-an, et al., 2010). For the model-based approaches, the impact of an interaction can be distinguished from the main effects, but the types of detectable interac-tion patterns are limited. In the pattern-based approach, interacinterac-tion detec-tion is based on risk patterns of the 3x3 genotype combinadetec-tion table of the two SNPs. The Hypothesis Free Clinical Cloning (HFCC) tests for 255 patterns for one SNP pair (Gayan, et al., 2008), but some patterns may not be biologically meaningful or are rare. SNPmaxsel evaluates 16 interaction patterns and four main effects for a given SNP pair (Boulesteix, et al., 2007). Multifactor dimensionality reduction (MDR) is also a pattern-based approach (Ritchie, et al., 2003; Ritchie, et al., 2001) to define based the best model based on classification accuracy. The strength of pattern-based approaches is that they are designed to detect wider range of interaction patterns. The limitation of the pattern-based approaches is that they search associations that allow for but are not limited to interactions. A significant result detected using the pattern-based approaches may be due to strong main effect without an interac-tion.
To overcome these weaknesses, we propose SNP Interaction Pattern Identifier (SIPI), which combines the advantages of the model-based and pattern-based approaches. Our approach can examine 45 interaction models that consider biologically meaningful factors. Each model has a straightforward corresponding pattern, and there is a formal statistical test for evaluating the interaction effect. This approach is powerful, and the identified patterns can be easily applied to assemble risk-prediction models. For evaluating the performance of SIPI, we conducted a simula-tion study to evaluate power and type I errors of SIPI with other four approaches: MDR, AA_full, Geno_Full and SNPassoc. The details of these methods are listed in Section 2.2.
2
Methods
2.1 SNP Interaction Pattern Identification (SIPI)
SIPI can intensively and effectively search pairwise SNP-SNP interac-tions. The conventional approach for identifying SNP-SNP interaction is to search a specific type of interaction using the full interaction model with the additive-additive mode based on the minor allele. The SIPI detects 45 interaction models, which take inheritance mode (both origi-nal and reverse coding), and risk category grouping (model structure) into consideration. The best interaction pattern is selected based on the Bayesian information criterion (BIC), which is used to deal with the trade-off between model fit and complexity of the model. BIC is also shown to be consistent in selecting the true model and tends to select a parsimonious model compared with the Akaike information criterion (AIC), especially in studies with a large sample size (Yang, 2005). The concept of SIPI can be applied to different types of outcomes, such as numeric, binary and time-to-event variables. In this study, we focused on the binary outcome using logistic regression models. The two primary components of SIPI are introduced separately below.
2.1a SNP Inheritance Modes
The SNP inheritance modes can impact on power to detect SNP interac-tions (Lin, et al., 2008). We designate a lowercase letter ‘a’ to denote the minor (low frequency) allele, and an uppercase ‘A’ to denote the major (common) allele. Each SNP has three genotype categories: homozygous major type (‘AA’), heterozygous type (‘Aa’) and homozygous minor type (‘aa’). For a SNP, the inheritance mode for a disease risk refers to a specific relationship between genotype and phenotype. The inheritance modes include additive, dominant, recessive, genotypic and over-dominant modes. The over-dominant mode assumes that the impact of having one or two copies of a given allele on the outcome is the same, and the recessive mode implies that the subjects with the homozygous genotype of a given allele have a different risk to develop the outcome compared with the other two genotypes. Additive mode refers to the impact of each additional copy of a given allele on the outcome being equal. The geno-typic mode, treats a SNP as a categorical variable with three groups, and assumes that each genotype has a distinct effect on risk. This genotypic mode needs four degrees of freedom for the interaction term itself, and interpretation of the result is not straightforward. The over-dominant mode, which assumes that heterozygote has a different risk than the other two homozygous genotypes (Aa vs. AA/aa), is a rare case. Therefore, the SIPI takes three inheritance modes (dominant, recessive and additive) into consideration.
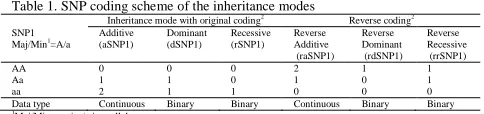
In the majority of genetic association studies, inheritance modes are defined based on the minor (or variant) allele. Under this scenario, the binary inheritance mode (dominant and recessive) is coded as “1” for the group containing the homozygous minor type, and the other group as “0” in modeling. For the AA, Aa and aa genotypes, the additive mode coding is 0, 1 and 2. The reverse coding (=1 - original coding for dominant and recessive mode; and 2-original coding for additive mode) of inheritance mode is seldom to be considered in testing SNP-SNP interactions. The coding direction (original/reverse coding) of inheritance mode does not impact on statistical significance (p-values) for testing the main effect in a main-effect model and the interaction term in a full interaction model, but dramatically impacts testing the interaction term in a non-hierarchical interaction model. As shown in Table 1, there are six total possible coding methods for inheritance modes for each SNP. The three inheritance modes with the original coding based on the minor allele are additive (noted as aSNP1 for SNP1), dominant (dSNP1) and recessive (rSNP1). For the inheritance modes with the reverse coding, the three modes are reverse additive (raSNP1), reverse dominant (rdSNP1), and reverse recessive (rrSNP1).
Table 1. SNP coding scheme of the inheritance modes
Inheritance mode with original coding2
Reverse coding2
SNP1
Maj/Min1
=A/a Additive (aSNP1)
Dominant (dSNP1)
Recessive (rSNP1)
Reverse Additive (raSNP1)
Reverse Dominant (rdSNP1)
Reverse Recessive (rrSNP1)
AA 0 0 0 2 1 1
Aa 1 1 0 1 0 1
aa 2 1 1 0 0 0
Data type Continuous Binary Binary Continuous Binary Binary
1
Maj/Min= major/minor allele
2Original modes are based on a minor allele ‘a’; Reverse coding is (1 - original coding) for the dominant and
2.1b Risk Category Grouping/Model Structure
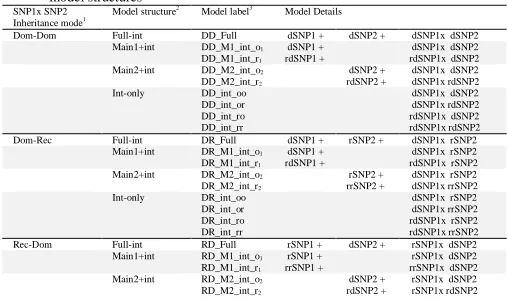
Both hierarchical and non-hierarchical interaction model were consid-ered in this study. For evaluating 2-way interactions, the hierarchical or full interaction models are the models with two main effects and their interactions. This is the most common model type for testing pairwise SNP-SNP interactions, but this full model tests only one specific interac-tion pattern. Non-hierarchical models are defined as models with an interaction, and none or one main effects. In genetic association studies, non-hierarchical models, which combines genotypes with similar out-come risk are possible (Lin, et al., 2013; Lin, et al., 2008). Using non-hierarchical models, a parsimonious model based on risk profile can be generated; therefore power of detecting these specific interaction patterns increases (Piegorsch, et al., 1994). As shown in Equations 1-4, four possible model structures for testing a two-way interaction include mod-els with (1) two main effects plus an interaction (Full-int); (2) the main effect of variable 1 plus an interaction (Main1+int); (3) the main effect of variable 2 plus an interaction (Main2+int); and (4) an interaction only (Int-only). It is worthy to note that the interaction only model for a SNP pair does not mean their main effects alone.
By considering a binary inheritance mode, there are four inheritance mode combinations (dominant-dominant, dominant-recessive, recessive-dominant and recessive-recessive). When treating SNPs as numeric variables, the additive-additive mode is taken into consideration. Thus, SIPI considers a total of five possible types of inheritance mode combi-nations. For each inheritance mode combination, there are nine unique interaction models/patterns when taking into consideration different model structures and inheritance modes (types and original/reverse cod-ing direction). An example of codcod-ing direction impact on a recessive-dominant interaction model for a SNP pair in the prostate cancer study is listed in Table S1.Thus, a total of 45 interaction patterns are considered in SIPI for each SNP pair (Table 2).
The best model among the 45 models is based on the lowest value of the Bayesian information criterion (BIC) (Schwarz, 1978). The significance of the interaction effect is tested using the Wald test of the interaction term (H0: β3=0). Although the likelihood ratio test (LRT) is usually recommended as the most powerful approach, it requires performing the two models one wishes to compare. The Wald test is similar to LRT in large scale studies and only one model needs to be estimated. In order to ease computation burden for high-dimensional data, the Wald test was primarily used in SIPI. In the SIPI R package, the users can choose to report p-values based on the Wald test or LRT. The Bonferroni method is applied to adjust for multiple comparisons.
Full interaction model (Full-int):
logit[pr(Y = 1)] = β0+ β1SNP1 + β2SNP2 + β3SNP1× SNP2 (𝐞𝐪. 𝟏) Main 1+ interaction (Main1+int):
logit[pr(Y = 1)] = β0+ β1SNP1 + + β3SNP1× SNP2 (𝐞𝐪. 𝟐) Main 2+ interaction (Main2+int):
logit[pr(Y = 1)] = β0+ + β2SNP2 + β3SNP1× SNP2 (𝐞𝐪. 𝟑) Interaction only (Int-only):
logit[pr(Y = 1)] = β0+ + β3SNP1× SNP2 (𝐞𝐪. 𝟒)
,where Y is the binary outcome with a value of 0 or 1.
Table 2. List of 45 interaction models by considering the inheritance modes and model structures
SNP1x SNP2
Inheritance mode1 Model structure
2
Model label3
Model Details
Dom-Dom Full-int DD_Full dSNP1 + dSNP2 + dSNP1x dSNP2
Main1+int DD_M1_int_o1
DD_M1_int_r1
dSNP1 + rdSNP1 +
dSNP1x dSNP2 rdSNP1x dSNP2
Main2+int DD_M2_int_o2
DD_M2_int_r2
dSNP2 + rdSNP2 +
dSNP1x dSNP2 dSNP1x rdSNP2
Int-only DD_int_oo
DD_int_or DD_int_ro DD_int_rr
dSNP1x dSNP2 dSNP1x rdSNP2 rdSNP1x dSNP2 rdSNP1x rdSNP2
Dom-Rec Full-int DR_Full dSNP1 + rSNP2 + dSNP1x rSNP2
Main1+int DR_M1_int_o1
DR_M1_int_r1
dSNP1 + rdSNP1 +
dSNP1x rSNP2 rdSNP1x rSNP2
Main2+int DR_M2_int_o2
DR_M2_int_r2
rSNP2 + rrSNP2 +
dSNP1x rSNP2 dSNP1x rrSNP2
Int-only DR_int_oo
DR_int_or DR_int_ro DR_int_rr
dSNP1x rSNP2 dSNP1x rrSNP2 rdSNP1x rSNP2 rdSNP1x rrSNP2
Rec-Dom Full-int RD_Full rSNP1 + dSNP2 + rSNP1x dSNP2
Main1+int RD_M1_int_o1
RD_M1_int_r1
rSNP1 + rrSNP1 +
rSNP1x dSNP2 rrSNP1x dSNP2
Main2+int RD_M2_int_o2
RD_M2_int_r2
dSNP2 + rdSNP2 +
rSNP1x dSNP2 rSNP1x rdSNP2
Int-only RD_int_oo
RD_int_or RD_int_ro RD_int_rr
rSNP1x dSNP2 rSNP1x rdSNP2 rrSNP1x dSNP2 rrSNP1x rdSNP2
Rec-Rec Full-int RR_Full rSNP1 + rSNP2 + rSNP1x rSNP2
Main1+int RR_M1_int_o1
RR_M1_int_r1
rSNP1 + rrSNP1 +
rSNP1x rSNP2 rrSNP1x rSNP2
Main2+int RR_M2_int_o2
RR_M2_int_r2
rSNP2 + rrSNP2 +
rSNP1x rSNP2 rSNP1x rrSNP2
Int-only RR_int_oo
RR_int_or RR_int_ro RR_int_rr
rSNP1x rSNP2 rSNP1x rrSNP2 rrSNP1x rSNP2 rrSNP1x rrSNP2
Add_Add Full-int AA_Full aSNP1 + aSNP2 + aSNP1x aSNP2
Main1+int AA_M1_int_o1
AA_M1_int_r1
aSNP1 + raSNP1 +
aSNP1x aSNP2 raSNP1x aSNP2
Main2+int AA_M2_int_o2
AA_M2_int_r2
aSNP2 + raSNP2 +
aSNP1x aSNP2 aSNP1x raSNP2
Int-only AA_int_oo
AA_int_or AA_int_ro AA_int_rr
aSNP1x aSNP2 aSNP1x raSNP2 raSNP1x aSNP2 raSNP1x raSNP2
1Dom: dominant, Rec: recessive, Add: additive 2
Full-int: full interaction model with two main effects plus an interaction; Main1+int: main effect of variable 1 plus an interaction; Main2+int: main effect of variable 2 plus an interaction; and (4) Int-only: an interaction only.
3_o
1, _r1: minor allele (original coding), and reverse coding of SNP1
_o2, _r2: minor allele (original coding), and reverse coding of SNP2
_oo, _or, _ro, _rr: based on original-original, original-reverse, reverse-original and reverse-reverse coding for SNP1 and SNP2
2.1c Translating Interaction Models to Interaction Patterns
By treating SNPs as binary variables (such as dominant or recessive), we can simplify genotype combinations from a three-by-three panel into a by-two panel, resulting in four possible sub-groupings. For the two-by-two panel, we can categorize the genotype combinations to 4-, 3- and 2-risk subgroups. As shown in Figures S1-S2, we can translate the inter-action models to the corresponding genotype interinter-action patterns. The full-int model has 4 risk subgroups, the Main1+int and Main2+int mod-els have 3 risk subgroups, and the Int-only model have 2 rsik subgroups. The non-hierarchical models have flexibility to combine genotype com-binations with similar outcome risk. Our 45 model labels are based on a three-by-three table with an order of homozygous major, heterozygous and homozygous minor types (denote as AA, Aa, and aa) and the homo-zygous major genotypes of the two SNPs as the top left corner.
2.2 Other approaches for SNP-SNP interactions
2.2a MDR
MDR (Ritchie, et al., 2003; Ritchie, et al., 2001) searches overall associ-ations that allow for but are not limited to interactions. A promising MDR generates a binary risk variable (high/low risk) by comparing the case-to-control ratio in each genotype combination to a threshold and classifies each genotype to either a high risk set or low risk set. The best model is decided based on classification accuracy. The K-fold cross-validation is used to relieve over-fitting issue in MDR. The permutation testing (Motsinger-Reif, 2008) can be used to determine MDR overall significance (not just for an interaction). In this study, MDR with the 5-fold cross-validation and a permutation testing procedure (1,000 random-ized datasets) was performed. One major weakness of MDR is that its identified associations may be due to strong main effect without an inter-action. Thus, another method for the MDR selected interaction is needed to distinguish the impact of main effects and interaction term.
2.2b AA_Full
The AA_full [available in PLINK (Purcell, et al., 2007)] approach uses a logistic regression model with both main effect and interaction. Each SNP is treated as an additive mode based on the minor allele. The signif-icance test is evaluated using the Wald test of the interaction coefficient.
2.2c Geno_Full
The Geno_Full uses a full logistic regression model and each SNP is treated as a genotypic mode with two degrees of freedom. The signifi-cance test is evaluated using the likelihood ratio test of the interaction coefficient. This Geno_Full is equivalent to the 2nd stage of BOOST
(Wan, et al., 2010), which uses the Kirkwood superposition approxima-tion (KSA) is used to screen a subset of SNPs for the 2nd stage analyses.
2.2d SNPassoc
minor allele. Two SNPs in the same pair are required to have the same inheritance mode.
2.3 Simulation
We conducted a simulation study to compare the power of SIPI with the conventional MDR, AA_Full, Geno_Full and SNPassoc approach for detecting two-way SNP-SNP interactions. For simulation settings, one SNP pair was considered. The two candidate SNPs were generated inde-pendently based on the Hardy-Weinberg equilibrium. Seven sets of a wide range of minor allele frequencies (MAF=0.05-0.5) for SNP1 and SNP2 were investigated: (0.5, 0.3), (0.5, 0.2), (0.5, 0.05), (0.3, 0.3), (0.3, 0.1), (0.3, 0.05), and (0.1, 0.05). The sample sizes of 1,000 and 5,000 were chosen. All analyses were based on 1,000 simulation runs.
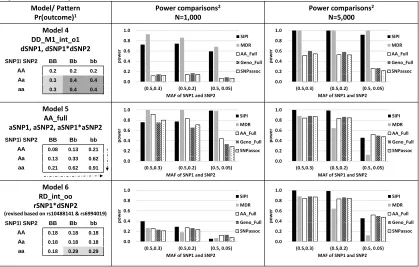
The binary outcome variable (such as case/control) was generated based on outcome prevalence (such as disease) in each genotype combination of the two given SNPs using multinomial distribution. We evaluated a total of six designed interaction patterns, including one real-data pattern (Figures 1-2). Most of these simulated models are based on the interac-tion patterns reported previously (Lin, et al., 2013; Lin, et al., 2012). One null model without a true interaction term was also tested. For the effect size of Models 1-4, the outcome prevalence was set to 0.3 or 0.4 in the high-risk subgroups and was 0.2 in the low-risk sub-groups. The corre-sponding odds ratio (OR) is 1.6 and 2.7, respectively. The settings of true interaction models are listed in Figures 1-2.
Models 1-3 were interaction-only models. For Model 1 (RR_int_rr pat-tern), both SNPs are considered as recessive with the reverse coding. The disease prevalence is 0.3 and 0.2 for the high- and low-risk groups, re-spectively. For Model 2 (DD_int_oo pattern), both SNPs are considered as dominant based on the minor alleles. In Model 3 (RD_int_rr), SNP1 is considered under a recessive mode, SNP2 is considered as dominant mode, and both SNPs have the reverse coding. Model 4 (DD_M1_int_o1)
includes the SNP1 main effect and an interaction, in which both SNPs are considered as dominant based on the minor allele of SNP1. The significance of the interaction term is the same regardless of the inher-itance mode coding (original or reverse) for SNP2. Model 5 (AA_Full) is a full interaction model and both SNPs are treated as an additive mode based on the minor allele. This AA_full model has the setting of β0= -2.5
and β1=β2=β3=0.6 in eq. 1. Model 6 (RD_int_oo) was designed based on
rs10488141 and rs6994019 from the PRACTICAL data (first SNP pair in Figure 4) with an OR of 1.9. For the null model, the outcome prevalence of 0.2 was applied for all nine genotype combinations.
2.4 Performance Evaluation
Both power and type I error were evaluated in the 1,000 simulation runs. Power is defined as the percentage of detecting a significant interaction when there is a true interaction. Type I error is defined as percentage of detecting a significant interaction when there is no interaction. The sig-nificant tests of the interaction for all four approaches (SIPI, AA_Full, Geno_Full and SNPassoc) are based on testing the coefficient of the interaction term. Statistical significance for SIPI and SNPassoc is de-fined as a p<0.001 (=0.05/45) and p<0.01 (=0.05/5) based on the Bonfer-roni correction. For the AA_Full and Geno_Full approaches, the signifi-cance level is 0.05. The signifisignifi-cance of MDR is based on the permutation p-values (1,000 randomized datasets). In addition, we evaluated SIPI’s pattern identification rate, which is defined as the percentage of identi-fied correct interaction pattern among the significant simulation runs.
2.5 Prostate Cancer Study Application
SIPI was applied in evaluating SNP-SNP interactions in angiogenesis genes associated with prostate aggressiveness using Prostate Cancer Association Group to Investigate Cancer Associated Alterations in the Genome (PRACTICAL) consortium data. The study population includes 21,316 cases of European ancestry (3,812 aggressive and 17,504 non-aggressive) from the 32 study sites. We randomly selected half of the cases as the discovery set and the other half as the validation set in each study site. The sample sizes in the discovery and validation sets are 10,664 and 10,652, respectively. Individuals were excluded from the study based on strict quality control criteria including: overall call rate <95% and extremely high or low heterozygosity (p < 1.0 × 10⁻⁵).
Ag-gressive prostate cancer was defined as a Gleason score > 8, PSA >100, disease stage of “distant” (stage IV) or death from PCa. Ethnic groups were defined based on a subset of 37,000 uncorrelated markers that passed quality control (including ~1,000 selected as ancestry informative markers). Principal Component Analyses were carried out for the Euro-pean subgroups. The details of this study population have been published previously (Eeles, et al., 2013).
We evaluated the 148 SNPs in the six angiogenesis genes (EGFR,
MMP16, ROBO1, CSF1, FBLN5,and HSPG2), which were reported in a genetic interaction network associated with prostate cancer aggressive-ness(Lin, et al., 2013). These result in 10,878 SNP pairs. The pairwise interactions among these SNPs associated with prostate cancer aggres-siveness (yes/no) were investigated using the SIPI approach in the dis-covery set first. For the top SNP pairs identified in the disdis-covery set, both SIPI and AA_Full were conducted in the validation set.
3
Results
3.1 Simulation
The power of comparing SIPI with other four methods (MDR, AA_Full, Geno_Full and SNPassoc) using the six simulated models for two SNPs with MAF of (0.5, 0.3), (0.5, 0.2) and (0.5, 0.05) is shown in Figures 1-2. As the sample size increased, power of all five approaches increased. In general, SIPI and MDR had similar power, and both of them are more powerful than the other three full-model approaches (AA_Full, Geno_Full, and SNPassoc). SIPI and MDR suffer less negative impact of SNPs with a low MAF than the other three full-model approaches.
The four methods (SIPI, AA_Full, Geno_Full and SNPassoc) evaluate the impact of interactions, but MDR is used to test overall associations allow for an interaction. For fair comparisons, we discuss the MDR performance separately. In Models 1-4 for a SNP pair with a MAF>=0.2 under a sample size of 1,000, SIPI greater than 49% power while the other three approaches have low power (<25%). Under a sample size of 1,000 with MAF of (0.5, 0.05), power decreases for all three full-model approaches but SIPI still has the highest power. As the sample size in-creased to 5,000, SIPI has 100% power in most of the conditions for identifying an interaction with a SNP pair with MAF of (0.5, 0.3) and (0.5, 0.2). The order of power for detecting a SNP-SNP interaction is SIPI >Geno_Full>AA_Full (similar with SNPassoc) with a big sample size of 5,000.
The three full-model approaches (AA_Full, Geno_Full and SNPassoc) have difficulty detecting Model 1, the ‘RR_int_rr’ pattern. With a reces-sive interaction-only pattern (RR_int_rr) in Model 1 for a sample size of 1,000 (Figure 1), SIPI has a power of 49-54% but the other three ap-proaches only have a power <10%. When the sample size increases to 5,000, the power of SIPI is approximately 100% while the other three approaches’ power remains low (<30%).
For Model 2 (DD_int_oo), SIPI have power 58-65%, but the other three approaches only have <25% power in a sample size of 1,000 and MAF of (0.5, 0.3) and (0.5, 0.2). As the sample size increases to 5,000, the power of all methods increase, and SIPI has the highest power compared with the other three approaches.
For Model 3 (RD_int_rr), SIPI have the highest power among all testing scenarios in Figure 1. For a sample size of 5,000, SIPI has 100% power, while power of other three approaches is <80%. Similarly, the power of Model 4 (DD_M1_int_o1) is 59-74% for SIPI and <20% for the other
three approaches when the sample size is 1,000. Power increases to close to close to 100% for SIPI and 22-60% for others when the sample size becomes 5,000.
AA_M1_int_r). For Model 6 generated based on the real data, SIPI is still the most powerful approach in most of the conditions.
For comparing SIPI with MDR, both methods are more powerful than other three full model approaches (AA_Full, Geno_Full and SNPassoc). SIPI has similar or higher power compared with MDR in majority of simulated conditions. For Model 6 with high risk groups in the minor genotypes, SIPI is more powerful than MDR under the sample size of 1,000 and 5,000.
For type I errors, SIPI using the Bonferroni correction is the most con-servative method among all testing approaches. As shown in Figure 3, SIPI has the smallest type I errors (0.01-0.02) compared to the other three methods. Some of SNPassoc’s type I errors (0.021-0.057) are also less than 0.05. The type I errors for MDR, AA_Full and Geno_Full are close to 0.05. As shown in Tables S2-4, the power and type I error com-parisons for additional MAF conditions show similar observations.
3.2 Patten Detection Accuracy
The accuracy rate of pattern identification increases (Figures S4-S5) as the sample size increases. For Models 1, 2, 3 and 6 with 1,000 samples, 56-84% of the significant simulation runs identify the correct pattern. For the sample size of 5,000, all models have approximately 100% accu-racy in identifying correct interaction patterns. For Models 4-5 and MAF=(0.3, 0.3) with a sample size of 1,000, the pattern identification rates are low (10% and 2%, respectively). However, these rate becomes 100% for a sample size of 5,000. Although pattern detection accuracy is low for the smaller sample, SIPI’s power can still be high due to detec-tion of other similar patterns. Using Model 4 with MAF=(0.3, 0.3) as an example, only 10% of the significant runs detect the correct pattern (DD_M1_int_o1) but other three similar patterns (39.9% DD_int_oo,
23% DR_int_rr, and 12.6% DR_int_or) are identified (Figure S5). Thus, its power of detecting any interaction can reach 61.2%.
From the simulation results, we observed an interesting scenario for common variants with a MAF close to 0.5. Under this condition, the minor allele determination is unstable, which can affect SIPI’s model labels. The model label system are built upon the minor/major allele. As an example shown in Figure S3, a low risk subgroup of a (GG+ GG) combination of SNP1 and SNP2 are classified as the “DD_int_rr” pattern when SNP1 is with a major allele of ‘G’ and a minor allele of ‘A’ but is classified as “RD_int_or” (called a “sister pattern”) when SNP1’s major allele is ‘A’. For an interaction with a SNP with a MAF close to 0.5, the pattern identification rate is the sum of the rates of the designed and sister patterns. We present the pattern identification rates for the signifi-cant simulation runs in Figures S4-S5. For Model 1 with a SNP pair with MAF=(0.5, 0.3), a total of 74% runs successfully identified the correct risk pattern (39% designed pattern and 5% sister pattern). A similar observations are presented for other models.
3.3 Example of Prostate Cancer Aggressiveness
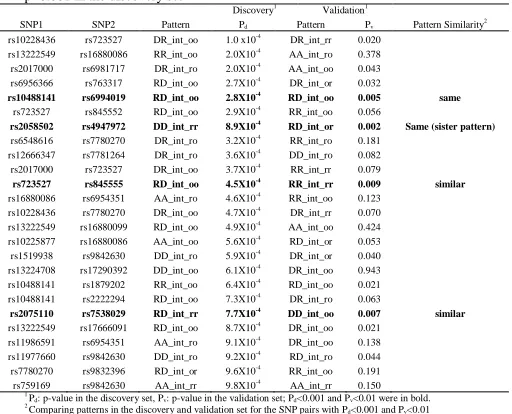
For the proposed SIPI approach, we considered SNP pairs with a p< 1x10⁻⁷ to be statistically significant after the Bonferroni correction for
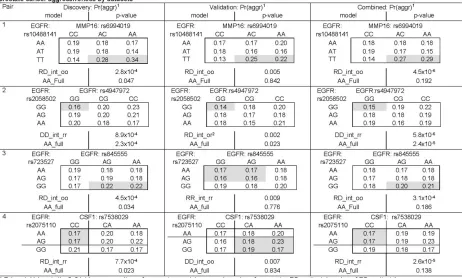
489,510 tests (=10,878 pairs x 45 models per pair). Although the SNP-SNP interaction results do not appear to be significant after adjusting for multiple comparisons, some of them show promising consistent results in both discovery and validation datasets. In the discovery set, 25 SNP pairs had a p < 0.001. Among these top 25 pairs, four pairs have a p-value < 0.01 in the validation set. Two pairs (rs10488141+ rs6994019 and rs2058502+ rs4947972) have the exact interaction pattern in both sets. The prevalence of prostate cancer aggressiveness by the nine genotype combinations are shown in Figure 4, and the prediction models are listed in Table 3. The prostate cancer patients with the TT + AC/AA genotype of the SNP pair of EGFR rs10488141 and MMP16 rs6994019 tend to suggest a higher risk of developing aggressive tumors (odds ratio (OR)=1.7, p=4.5x10⁻⁶). Those with GG+ GG of two SNPs in EGFR
(rs2058502 and rs4947972) are less likely to have aggressive prostate cancer tumors (OR=0.8, p=5.8x10⁻⁶). Those with GG+ AG/AA of two
SNPs in EGFR (rs723527 and rs845555) are likely to have aggressive prostate cancer tumors (OR=1.2, p=3.1x10⁻⁴). The patients with AA/AG
and CC in EGFR rs2075110 and CSF1 rs7538029 have a lower chance of developing an aggressive prostate cancer (OR=0.9, p=2.6x10⁻⁵).
Table 3. Results of the PRACTICAL discovery and validation set for the top 25 SNP-SNP interaction pairs associated with prostate cancer aggressiveness with a p<0.001 in the discovery set
Discovery1 Validation1
SNP1 SNP2 Pattern Pd Pattern Pv Pattern Similarity
2
rs10228436 rs723527 DR_int_oo 1.0 x10⁻⁴
DR_int_rr 0.020
rs13222549 rs16880086 RR_int_oo 2.0X10⁻⁴ AA_int_ro 0.378
rs2017000 rs6981717 DR_int_ro 2.0X10⁻⁴ AA_int_oo 0.043
rs6956366 rs763317 RD_int_oo 2.7X10⁻⁴
DR_int_or 0.032
rs10488141 rs6994019 RD_int_oo 2.8X10⁻⁴
RD_int_oo 0.005 same
rs723527 rs845552 RD_int_oo 2.9X10⁻⁴
RR_int_oo 0.056
rs2058502 rs4947972 DD_int_rr 8.9X10⁻⁴
RD_int_or 0.002 Same (sister pattern)
rs6548616 rs7780270 DR_int_ro 3.2X10⁻⁴ RR_int_ro 0.181
rs12666347 rs7781264 DR_int_ro 3.6X10⁻⁴
DD_int_ro 0.082
rs2017000 rs723527 DR_int_oo 3.7X10⁻⁴
RR_int_rr 0.079
rs723527 rs845555 RD_int_oo 4.5X10⁻⁴
RR_int_rr 0.009 similar
rs16880086 rs6954351 AA_int_ro 4.6X10⁻⁴ RR_int_oo 0.123
rs10228436 rs7780270 DR_int_oo 4.7X10⁻⁴ DR_int_rr 0.070
rs13222549 rs16880099 RD_int_oo 4.9X10⁻⁴
AA_int_oo 0.424
rs10225877 rs16880086 AA_int_oo 5.6X10⁻⁴
RD_int_or 0.053
rs1519938 rs9842630 DD_int_ro 5.9X10⁻⁴
DR_int_or 0.040
rs13224708 rs17290392 DD_int_oo 6.1X10⁻⁴ DR_int_oo 0.943
rs10488141 rs1879202 RR_int_oo 6.4X10⁻⁴ RD_int_oo 0.021
rs10488141 rs2222294 RD_int_oo 7.3X10⁻⁴
DR_int_ro 0.063
rs2075110 rs7538029 RD_int_rr 7.7X10⁻⁴
DD_int_oo 0.007 similar
rs13222549 rs17666091 RD_int_oo 8.7X10⁻⁴
DR_int_oo 0.021
rs11986591 rs6954351 AA_int_ro 9.1X10⁻⁴ DR_int_oo 0.138
rs11977660 rs9842630 DD_int_ro 9.2X10⁻⁴ RD_int_ro 0.044
rs7780270 rs9832396 RD_int_or 9.6X10⁻⁴
RR_int_oo 0.191
rs759169 rs9842630 AA_int_rr 9.8X10⁻⁴
AA_int_rr 0.150
1 P
d: p-value in the discovery set, Pv: p-value in the validation set; Pd<0.001 and Pv<0.01 were in bold. 2
Comparing patterns in the discovery and validation set for the SNP pairs with Pd<0.001 and Pv<0.01
Three of the four SNP interaction pairs remain promising (rs10488141+ rs6994019, rs2058502+ rs4947972, and rs2075110+ rs7538029) after including these four SNP pairs and the first five principal components of European ancestry in the model (Table 4). For evaluating whether the SNPs in the top pairs in the discovery are comparable in the validation set, the MAF of these SNPs are calculated. As shown in Table S5, the MAFs for these top SNPs are very similar in these two datasets. The individual effects of these SNPs in the combined dataset are also evalu-ated, and some SNPs did not have significant main effects. For example, the SNP pairs of rs10488141 and rs6994019 has an interaction with a p-value of 4.5x10⁻⁶ but without significant main effects (p-value=0.145 and
0.659, respectively). These show that some pure SNP-SNP interactions (without significant main effects) associated with prostate cancer aggres-siveness. In summary, our results demonstrate SNP-SNP interactions in the two gene pairs (EGFR-MMP16 and EGFR-CSF1), and within EGFR. These findings support that EGFR may be the hub of this angiogenesis interaction network, which is consistent with the conclusion of the previ-ous study (Lin, et al., 2013).
4
Discussion
For evaluating two-way SNP-SNP interactions, SIPI is more powerful than the MDR, AA_Full, Geno_Full and SNPassoc approach, in general, even after applying stringent Bonferroni correction for multiple compari-son justification. Although MDR and SIPI have similar power based on our simulation results, SIPI performs better than MDR is terms of testing significance of an interaction. MDR searches overall associations allow-ing interactions. For testallow-ing significance of an interaction, we need a two-stage MDR method, which has lower power than MDR alone. The primary strengths of SIPI are (1) taking non-hierarchical models, inher-itance modes, and mode coding direction into consideration and (2) using BIC to search for a best interaction pattern. In practice, it is chal-lenge to detect a true interaction pattern for studies with a limited sample size. These features equip SIPI for searching similar interaction patterns close to the truth, so it can overcome the unstable nature of detecting SNP-SNP interaction patterns.
over-dominant) but two SNPs in a pair need to have the same mode. Thus, these three approaches can only detect limited interaction patterns. For example, AA_Full, Geno_Full, and SNPassoc experienced difficulty in detecting the RR_int_rr pattern (Model 1, power<30%, Figure 1), but SIPI had 100% power for a large sample size of 5,000.
SIPI also provides advantages compared to other statistical approaches. BOOST (Wan, et al., 2010) is a two-stage method using the log-linear model to test interactions and treats SNPs as the genotypic mode (same as Geno_Full in our study) as the 2nd stage. SIPI is more powerful than
Geno_Full (Figures 1 and 2, and Tables S2-S3), which is more powerful than the two-stage BOOST. SNPmaxsel (Boulesteix, et al., 2007) evalu-ates 16 interaction patterns, which are parts of SIPI patterns. These 16 patterns are the interaction-only models for SNPs with a binary mode (dominant or recessive). HFCC (Gayan, et al., 2008) is used to assess 255 patterns, but some are rare or biologically meaningless patterns. Compared with these approaches, SIPI tests the 45 biologically meaning-ful patterns, some of which have been reported previously (Lin, et al., 2013).
For external validation of SNP-SNP interactions, we suggest loosening the validation criteria for evaluating SNP-SNP interactions to allow for similar matches. The optimal goal of a genetic association study is to build prediction models for clinical usage. External validation using an independent dataset is a key in identifying true prediction factors. The majority of previous studies use AA_Full in the two independent datasets or the exact interaction pattern identified in the discovery set to verify the same pattern in the validation set (Su, et al., 2013). However, this exact match is too stringent for identifying SNP-SNP interactions. Our simulation findings (Figures S4-S5) indicate the unstable nature of inter-action patterns due to unsteady risk profiles of the nine genotype sub-groups. Thus, it should be more effective to allow for similar matches instead of exact matches in SNP-SNP interaction validation, especially in the studies with a small sample size. SIPI provides useful features that work to overcome this unstable pattern nature. SIPI uses the BIC to select the best pattern of 45 patterns so that the true pattern or the most similar pattern can be detected. This provides flexibility in terms of result validation. For a SNP pair with MAF of (0.3, 0.3) in Model 4 with a sample size of 1,000, SIPI can still reach 61% power to detect an inter-action with any type of SNP1 and SNP2, even though only 10% of the significant results point to the correct pattern.
The outcome prevalence table stratified using three-by-three genotypes (called the “3x3 outcome table”, available in SIPI software) is a useful way to boost result interpretation for interaction patterns. Using the 3x3 outcome table for real prostate cancer data application, it is easy to ob-serve that two of the top SNP pairs had similar interaction patterns in the discovery set and validation set (Figure 4). Combining the two testing sets with a larger sample size ensures that the interaction pattern is more reliable. In result validation, the sister pattern (one pattern with two different pattern labels) can be easily observed for an interaction with a SNP with a MAF close to 50%. In our prostate cancer application, three out of eight SNPs involved in the top SNP interactions have a MAF>45%. In practice, the sister pattern issue can be identified by re-viewing the 3x3 outcome table. Thus, we cannot purely rely on model labels to decide whether the two patterns are exactly matched. Due to the sister pattern and similar matching issues, it is suggested that the 3x3 outcome table should be consulted to further review interaction patterns.
For potential biological relevance of our identified SNP-SNP interactions (within EGFR, EGFR-MMP16 and EGFR-CSF1), the main key protein
was epidermal growth factor receptor (EGFR), which interacted with the other two proteins that were also involved in cancers. The EGFR is a critical protein in proliferation of epithelial cells, differentiation, and cell survival and is involved in oncogenesis. The EGFR has been known for a role in regulating prostate cellular growth and function (Bonaccorsi, et al., 2007; Leotoing, et al., 2007; Migliaccio, et al., 2006). Results from a meta-analysis of prostate cancer expression datasets were consistent with our results. Wang et al. identified the EGFR pathway, which was associ-ated with prostate cancer risk (Wang, et al., 2011).
The interaction between matrix metalloproteinase16 (MMP16) and EGFR is interesting. These two proteins have also been implicated in several cancers including prostate cancer. MMPs are a family of proteo-lytic enzymes involved in tumor growth, invasion and metastasis (Rundhaug, 2005). Among 24 MMPs, the role of MMP16 in prostate cancer has not been well investigated. Jung et al. reported a down-regulation of MMP16 in malignant prostate tissues (Jung, et al., 2003). MMP16 has been shown to be associated with pancreatic cancer cell migration and invasion (Lin, et al., 2011) and lung development (Hadchouel, et al., 2008). Several cancers in which EGFR signaling is involved were often observed abnormal high expression of MMPs (Da-vidson, et al., 1999). Van Meter et al. reported MMP16 mRNA levels significantly increased after EGF stimulation in the glioma cell lines (Van Meter, et al., 2004).
Colony stimulating factor-1 (CSF1) is a protein that promotes metastatic potential in breast cancer (Lin, et al., 2001). Although there is no report on a role of CSF1 in prostate cancer, previous studies reported overex-pression of serum CSF1 in several cancer sites, including pancreatic cancer (Pyonteck, et al., 2012), breast, ovary, and endometrial tissues (Espinosa, et al., 2011; Kacinski, 1997). Recently, Pei et al (Pei, et al., 2015) observed that CSF1 expression is positively correlated with pro-gression and EGFR expression in lung cancer and concluded that co-expression of CSF1 and EGFR may be an independent prognostic bi-omarker for progression of lung cancer.
The SIPI software (SAS macro and SIPI R package) is freely available at http://publichealth.lsuhsc.edu/LinSoftware/. SIPI software can perform models adjusted for covariates. In SIPI R package, the original (‘SIPI’ function) and parallel computing functions (‘parSIPI’ function) are in-cluded. SIPI can finish the analyses of all pairwise analyses of 150 SNPs for a dataset with a sample size of 5,000 within about 3 hours on a desk-top computer (3.6 GHz CPU with 8 cores) using the ‘parSIPI’ R func-tion. For large scale studies, it is recommended to apply some approach-es (such as statistical screening or biological pathway selection) to de-crease the number of candidate SNPs before applying the SIPI analyses.
In summary, SIPI is a powerful tool to search for 45 interaction patterns for pairwise SNP interactions. Although only binary outcome models were discussed in this study, it can be extended to various outcome data types, such as numeric and time-to-event data. The promising interaction pairs identified by SIPI can be included in a risk prediction model with other significant individual SNPs, other known clinical risk factors, and biomarkers in order to increase prediction accuracy.
Figure 1. Power comparisons of the SNP Interaction Pattern Identifier (SIPI) and other four methods for Models 1-3
1Proportion of the outcome event in the genotype combination of the 3x3 table; a lowercase letter denotes the minor allele, and an
uppercase letter denotes the major allele. 2 MDR (Multifactor dimensionality reduction), AA_Full, Geno_Full (full interaction model
and each SNP is treated as an additive or genotypic mode), and SNPassoc R package
Figure 2. Power comparisons of the SNP Interaction Pattern Identifier (SIPI) and other four methods for Models 4-6
1
Proportion of the outcome event in the genotype combination of the 3x3 table; a lowercase letter denotes the minor allele, and an uppercase letter denotes the major allele. 2 MDR (Multifactor dimensionality reduction), AA_Full, Geno_Full (full interaction model
and each SNP is treated as an additive or genotypic mode), and SNPassoc R package
Model/ Pattern Pr(outcome)1
Power comparisons2
N=1,000
Power comparisons2
N=5,000 Model 1
RR_int_rr rrSNP1*rrSNP2
SNP1\ SNP2 BB Bb bb
AA 0.3 0.3 0.2
Aa 0.3 0.3 0.2
aa 0.2 0.2 0.2
Model 2 DD_int_oo dSNP1*dSNP2
SNP1\ SNP2 BB Bb bb
AA 0.2 0.2 0.2
Aa 0.2 0.3 0.3
aa 0.2 0.3 0.3
Model 3 RD_int_rr rrSNP1*rdSNP2
SNP1\ SNP2 BB Bb bb
AA 0.3 0.2 0.2
Aa 0.3 0.2 0.2
aa 0.2 0.2 0.2
0.0 0.2 0.4 0.6 0.8 1.0
(0.5,0.3) (0.5,0.2) (0.5, 0.05)
p
o
we
r
MAF of SNP1 and SNP2 SIPI MDR AA_Full Geno_Full SNPassoc 0.0 0.2 0.4 0.6 0.8 1.0
(0.5,0.3) (0.5,0.2) (0.5, 0.05)
p
o
we
r
MAF of SNP1 and SNP2 SIPI MDR AA_Full Geno_Full SNPassoc 0.0 0.2 0.4 0.6 0.8 1.0
(0.5,0.3) (0.5,0.2) (0.5, 0.05)
p
o
we
r
MAF of SNP1 and SNP2 SIPI MDR AA_Full Geno_Full SNPassoc 0.0 0.2 0.4 0.6 0.8 1.0
(0.5,0.3) (0.5,0.2) (0.5, 0.05)
p
o
we
r
MAF of SNP1 and SNP2 SIPI MDR AA_Full Geno_Full SNPassoc 0.0 0.2 0.4 0.6 0.8 1.0
(0.5,0.3) (0.5,0.2) (0.5, 0.05)
p
o
we
r
MAF of SNP1 and SNP2 SIPI MDR AA_Full Geno_Full SNPassoc 0.0 0.2 0.4 0.6 0.8 1.0
(0.5,0.3) (0.5,0.2) (0.5, 0.05)
p
o
we
r
MAF of SNP1 and SNP2 SIPI MDR AA_Full Geno_Full SNPassoc Model/ Pattern Pr(outcome)1
Power comparisons2
N=1,000
Power comparisons2
N=5,000 Model 4
DD_M1_int_o1 dSNP1, dSNP1*dSNP2
SNP1\ SNP2 BB Bb bb
AA 0.2 0.2 0.2
Aa 0.3 0.4 0.4
aa 0.3 0.4 0.4
Model 5 AA_full
aSNP1, aSNP2, aSNP1*aSNP2
SNP1\ SNP2 BB Bb bb
AA 0.08 0.13 0.21
Aa 0.13 0.33 0.62
aa 0.21 0.62 0.91
Model 6 RD_int_oo rSNP1*dSNP2 (revised based on rs10488141 & rs6994019)
SNP1\ SNP2 BB Bb bb
AA 0.18 0.18 0.18
Aa 0.18 0.18 0.18
aa 0.18 0.29 0.29
0.0 0.2 0.4 0.6 0.8 1.0
(0.5,0.3) (0.5,0.2) (0.5, 0.05)
p
o
we
r
MAF of SNP1 and SNP2 SIPI MDR AA_Full Geno_Full SNPassoc 0.0 0.2 0.4 0.6 0.8 1.0
(0.5,0.3) (0.5,0.2) (0.5, 0.05)
p
o
we
r
MAF of SNP1 and SNP2 SIPI MDR AA_Full Geno_Full SNPassoc 0.0 0.2 0.4 0.6 0.8 1.0
(0.5,0.3) (0.5,0.2) (0.5, 0.05)
p
o
we
r
MAF of SNP1 and SNP2 SIPI MDR AA_Full Geno_Full SNPassoc 0.0 0.2 0.4 0.6 0.8 1.0
(0.5,0.3) (0.5,0.2) (0.5, 0.05)
p
o
we
r
MAF of SNP1 and SNP2 SIPI MDR AA_Full Geno_Full SNPassoc 0.0 0.2 0.4 0.6 0.8 1.0
(0.5,0.3) (0.5,0.2) (0.5, 0.05)
p
o
we
r
MAF of SNP1 and SNP2 SIPI MDR AA_Full Geno_Full SNPassoc 0.0 0.2 0.4 0.6 0.8 1.0
(0.5,0.3) (0.5,0.2) (0.5, 0.05)
p
o
we
r
Figure 3. Comparisons of Type I errors of the SNP Interaction Pattern Identifier (SIPI) and other four methods
1Proportion of the outcome event in the genotype combination of the 3x3 table; a lowercase letter denotes the minor allele, and an
uppercase letter denotes the major allele. 2 MDR (Multifactor dimensionality reduction), AA_Full, Geno_Full (full interaction model
and each SNP is treated as an additive or genotypic mode), and SNPassoc R package
Table 4. SNP-SNP interaction models associated with prostate cancer aggressiveness
Univariate model Multivariable model2
Unadjusted
OR (95% CI) 1
p-value adjusted
OR (95% CI)1
p-value
rs10488141+ rs6994019, TT+ AC/AA vs. others 1.7 (1.4-2.1) 4.5x10⁻⁶ 1.8 (1.4-2.6) 6.3x10⁻⁷
rs2058502+ rs4947972, GG+ GG vs. others 0.8 (0.7-0.9) 5.8x10⁻⁶ 0.8 (0.7-0.9) 5.2x10⁻⁵
rs723527+ rs845555, GG+ AG/AA vs. others 1.2 (1.1-1.3) 3.1x10⁻⁴ 1.1 (1.0-1.3) 1.6x10⁻²
rs2075110+ rs7538029, AA/AG+ CC vs. others 0.9 (0.8-0.9) 2.6x10⁻⁵ 0.9 (0.8-0.9) 6.9x10⁻⁴
1 Odds ratio (95% confidence interval)
2 all four SNP pairs and the first five principal components of European ancestry were included in the multivariable model.
Acknowledgements
Model/ Pattern Pr(outcome)1
Type I error comparisons2
N=1,000
Type I error comparisons2
N=5,000 Null Model
SNP1\ SNP2 BB Bb bb
AA 0.2 0.2 0.2
Aa 0.2 0.2 0.2
aa 0.2 0.2 0.2 0.00
0.10 0.20 0.30 0.40 0.50
(0.5,0.3) (0.5,0.2) (0.5, 0.05)
MAF of SNP1 and SNP2 SIPI MDR AA_Full Geno_Full
SNPassoc
0.00 0.10 0.20 0.30 0.40 0.50
(0.5,0.3) (0.5,0.2) (0.5, 0.05)
MAF of SNP1 and SNP2 SIPI MDR AA_Full Geno_Full
SNPassoc
Ty
pe
I
error
Ty
pe
I
We thank our anonymous reviewers for their valuable comments, which have led to many improvements to this article. This study was supported by the National Cancer Institute (R01CA128813, PI: Park, JY and R21CA202417, PI: Lin, HY).
Conflict of Interest: none declared.
References
Al Olama, A.A., et al. A meta-analysis of 87,040 individuals identifies 23 new susceptibility loci for prostate cancer. Nat Genet
2014;46(10):1103-1109.
Amin Al Olama, A., et al. Risk Analysis of Prostate Cancer in PRACTICAL, a Multinational Consortium, Using 25 Known Prostate Cancer Susceptibility Loci. Cancer Epidemiol Biomarkers Prev
2015;24(7):1121-1129.
Bonaccorsi, L., et al. Altered endocytosis of epidermal growth factor receptor in androgen receptor positive prostate cancer cell lines. J Mol Endocrinol 2007;38(1-2):51-66.
Boulesteix, A.L., et al. Multiple testing for SNP-SNP interactions. Stat. Appl. Genet. Mol. Biol. 2007;6:Article37.
Cordell, H.J. Detecting gene-gene interactions that underlie human diseases. Nat. Rev. Genet. 2009;10(6):392-404.
Davidson, B., et al. High levels of MMP-2, MMP-9, MT1-MMP and TIMP-2 mRNA correlate with poor survival in ovarian carcinoma. Clin Exp Metastasis 1999;17(10):799-808.
Eeles, R.A., et al. Identification of 23 new prostate cancer susceptibility loci using the iCOGS custom genotyping array. Nat Genet
2013;45(4):385-391, 391e381-382.
Espinosa, I., et al. CSF1 expression in nongynecological
leiomyosarcoma is associated with increased tumor angiogenesis. Am J Pathol 2011;179(4):2100-2107.
Gayan, J., et al. A method for detecting epistasis in genome-wide studies using case-control multi-locus association analysis. BMC Genomics
2008;9:360.
Gonzalez, J.R., et al. SNPassoc: an R package to perform whole genome association studies. Bioinformatics 2007;23(5):644-645.
Hadchouel, A., et al. Matrix metalloproteinase gene polymorphisms and bronchopulmonary dysplasia: identification of MMP16 as a new player in lung development. PLoS One 2008;3(9):e3188.
Ioannidis, J.P., Castaldi, P. and Evangelou, E. A compendium of genome-wide associations for cancer: critical synopsis and reappraisal. J. Natl. Cancer Inst. 2010;102(12):846-858.
Jung, M., et al. mRNA expression of the five membrane-type matrix metalloproteinases MT1-MT5 in human prostatic cell lines and their down-regulation in human malignant prostatic tissue. Prostate
2003;55(2):89-98.
Kacinski, B.M. CSF-1 and its receptor in breast carcinomas and neoplasms of the female reproductive tract. Mol Reprod Dev
1997;46(1):71-74.
Leotoing, L., et al. Crosstalk between androgen receptor and epidermal growth factor receptor-signalling pathways: a molecular switch for epithelial cell differentiation. J Mol Endocrinol 2007;39(2):151-162. Lin, E.Y., et al. Colony-stimulating factor 1 promotes progression of mammary tumors to malignancy. J Exp Med 2001;193(6):727-740. Lin, F., et al. Inhibitory effects of miR-146b-5p on cell migration and invasion of pancreatic cancer by targeting MMP16. J Huazhong Univ Sci Technolog Med Sci 2011;31(4):509-514.
Lin, H.Y., et al. SNP-SNP Interaction Network in Angiogenesis Genes Associated with Prostate Cancer Aggressiveness. PLoS ONE
2013;8(4):e59688.
Lin, H.Y., et al. TRM: a powerful two-stage machine learning approach for identifying SNP-SNP interactions. Annals of human genetics
2012;76(1):53-62.
Lin, H.Y., et al. Comparison of multivariate adaptive regression splines and logistic regression in detecting SNP-SNP interactions and their application in prostate cancer. Journal of Human Genetics
2008;53(9):802-811.
Migliaccio, A., et al. Crosstalk between EGFR and extranuclear steroid receptors. Ann N Y Acad Sci 2006;1089:194-200.
Moore, J.H. The ubiquitous nature of epistasis in determining susceptibility to common human diseases. Hum. Hered. 2003;56(1-3):73-82.
Moore, J.H. and Williams, S.M. New strategies for identifying gene-gene interactions in hypertension. Annals of medicine 2002;34(2):88-95. Motsinger-Reif, A.A. The effect of alternative permutation testing strategies on the performance of multifactor dimensionality reduction.
BMC Res. Notes 2008;1:139.
Onay, V.U., et al. SNP-SNP interactions in breast cancer susceptibility.
BMC Cancer 2006;6:114.
Pei, B., et al. [Expression of colony-stimulating factor 1 in lung adenocarcinoma and its prognostic implication]. Zhonghua Zhong Liu Za Zhi 2015;37(2):113-118.
Piegorsch, W.W., Weinberg, C.R. and Taylor, J.A. Non-hierarchical logistic models and case-only designs for assessing susceptibility in population-based case-control studies. Stat. Med. 1994;13(2):153-162. Purcell, S., et al. PLINK: a tool set for whole-genome association and population-based linkage analyses. Am. J. Hum. Genet. 2007;81(3):559-575.
Pyonteck, S.M., et al. Deficiency of the macrophage growth factor CSF-1 disrupts pancreatic neuroendocrine tumor development. Oncogene
2012;31(11):1459-1467.
Ritchie, M.D., Hahn, L.W. and Moore, J.H. Power of multifactor dimensionality reduction for detecting gene-gene interactions in the presence of genotyping error, missing data, phenocopy, and genetic heterogeneity. Genet. Epidemiol. 2003;24(2):150-157.
Ritchie, M.D., et al. Multifactor-dimensionality reduction reveals high-order interactions among estrogen-metabolism genes in sporadic breast cancer. Am J Hum Genet 2001;69(1):138-147.
Rundhaug, J.E. Matrix metalloproteinases and angiogenesis. J Cell Mol Med 2005;9(2):267-285.
Schwarz, G. Estimating the Dimension of a Model. Annals of Statistics
1978;6(2):461-464.
Su, W.H., et al. How genome-wide SNP-SNP interactions relate to nasopharyngeal carcinoma susceptibility. PLoS ONE 2013;8(12):e83034. Van den Broeck, T., et al. The role of single nucleotide polymorphisms in predicting prostate cancer risk and therapeutic decision making.
Biomed Res Int 2014;2014:627510.
Van Meter, T.E., et al. Induction of membrane-type-1 matrix metalloproteinase by epidermal growth factor-mediated signaling in gliomas. Neuro Oncol 2004;6(3):188-199.
Wan, X., et al. BOOST: A fast approach to detecting gene-gene interactions in genome-wide case-control studies. Am. J. Hum. Genet.
2010;87(3):325-340.
Wang, Y., et al. Identifying novel prostate cancer associated pathways based on integrative microarray data analysis. Comput Biol Chem
2011;35(3):151-158.
Yang, Y. Can the strengths of AIC and BIC be shared? A conflict between model indentification and regression estimation. Biometrika