ScholarlyCommons
Publicly Accessible Penn Dissertations
1-1-2015
Essays on the Role of Knowledge in Recent
Chinese Development
Jie Bai
University of Pennsylvania, [email protected]
Follow this and additional works at:http://repository.upenn.edu/edissertations Part of theBusiness Commons, and theOther Economics Commons
This paper is posted at ScholarlyCommons.http://repository.upenn.edu/edissertations/1009 For more information, please [email protected].
Recommended Citation
Abstract
Chapter 1: Earlier studies have consistently found evidence for productivity externalities of FDI through backward linkages. However, most studies do not use direct measures of backward linkages, nor do they further investigate what exactly generates these productivity externalities. Using a unique dataset from the Chinese automotive industry, which provides direct supply linkage measures, this study shows that compared with suppliers that only sell to domestic brands, the total factor productivity premium is about 16.7 percent for auto parts suppliers that sell to at least one foreign brand. Employing difference-in-differences estimation, a causal link from backward linkages to the suppliers' productivity growth is also established. Specifically, auto parts suppliers' productivity grows by 25.5 percent in the first year after formal supply relationships are forged with foreign joint venture automakers, and productivity continues to grow at least over the next two years. The case study further identifies knowledge transfer from joint venture automakers as an important source of productivity gains in local suppliers. It also offers three caveats that need to be taken into account when interpreting the observed productivity externalities in the econometric analyses.
Chapter 2: Intellectual property piracy is widely believed, by authorities in both U.S. industry and government, to be rampant in China. Because we lack evidence on the rate at which unpaid consumption displaces paid consumption, we know little about the size of the effect of pirate consumption on the volume of paid consumption. We provide direct evidence on both the volume of unpaid consumption and the rate of sales displacement for movies in China using two surveys administered in late 2008 and mid-2009. First, using a survey of Chinese college students' movie consumption and an empirical approach parallel to a similar recent study of U.S. college students, we find that three quarters of movie consumption is unpaid and that each instance of unpaid consumption displaces 0.14 paid consumption instances. Second, a survey of online Chinese consumers reveals similar patterns of paid and unpaid movie consumption but a displacement rate of roughly zero. We speculate on the small displacement rate finding relative to most of the piracy literature.
Degree Type Dissertation
Degree Name
Doctor of Philosophy (PhD)
Graduate Group Applied Economics
First Advisor Howard Pack
Keywords
Automotive Industry, Backward Linkages, China, Foreign Direct Investment, Movie Piracy, Productivity Externalities
Business | Economics | Other Economics
ESSAYS ON THE ROLE OF KNOWLEDGE IN RECENT CHINESE DEVELOPMENT
Jie Bai
A DISSERTATION
in
Applied Economics
For the Graduate Group in Managerial Science and Applied Economics
Presented to the Faculties of the University of Pennsylvania
in
Partial Fulfillment of the Requirements for the
Degree of Doctor of Philosophy
2015
Supervisor of Dissertation
_____________________
Howard Pack, Professor, Business Economics and Public Policy
Graduate Group Chairperson
______________________
Eric Bradlow, Professor, Marketing, Statistics, and Education
Dissertation Committee
Howard Pack, Professor, Business Economics and Public Policy
Santosh Anagol, Assistant Professor, Business Economics and Public Policy
ESSAYS ON THE ROLE OF KNOWLEDGE IN RECENT CHINESE DEVELOPMENT
COPYRIGHT
2015
To my husband,
Liang Wang,
who has been holding my hands through all the joys and tears.
To my parents,
Mandou Bai and Yali Wang,
who always believe in me and do their best to love me.
To my daughter,
Baiyi (Tutu) Wang,
who never fails to inspire me for each passing day.
献给我亲爱的爸爸白满斗,妈妈王亚利,
丈夫王亮和女儿王白衣.
To the One
ACKNOWLEDGEMENT
It is still like a dream for me now. I cannot believe that I did it! Without the generous support
and continuous encouragement from Howard, my academic advisor, I could not have done it. I
cannot thank him more! I am very grateful for his guidance and advice at every single step of the
dissertation process. He has great interest in real-life questions and encouraged me to conduct
my own field study in China to learn how things work in reality. It turned out to be a very fruitful
and enjoyable experience. Howard is the most knowledgeable person I’ve ever met. His genuine
interest in people and his ability to talk to everyone truly amazed me. Howard, as well as Janet
(Howard’s beautiful wife), treat me as a friend. They care not only about my academic
performance, but also about me as a person. I appreciate it that he gave me enough time and
space to make my own mistakes, allowing me to learn from my errors. On a side note, the most
beautiful scene I had ever seen at Penn is Howard and Janet walking down the Locust Walk,
holding each other’s hands.
I am also grateful to two other faculty members on my committee, Dr. Anagol Santosh and Dr.
Qiaowei Shen, for being interested in my work outside of their fields and for excellent comments
that have substantially improved my thesis. Professor Joel Waldfogel, my co-author of the second
paper, is very insightful and passionate about research. He has the “magic” to turn a casual topic
into a paper. Our idea to study the movie piracy in China sprouted from a chat during a lunch
break in a conference. He provided much practical advice and encouragement as I made my way
from initial research questions to a paper.
I want to take this opportunity to give special thanks to Professor James Tybout at Penn
State, where I did my graduate study. It was in his international trade class where I found my
interest in the area of international industrial policy and decided to pursue the study at Wharton.
Taking his class was one of my unforgettable memories. It was very challenging and equally
rewarding. I had a tough start, but Jim bore with me by answering each question (sometimes very
me. Professor Mark Roberts, for whom I had been a teaching assistant at Penn State, was one of
the kindest persons I had ever met. I am greatly indebted to him for supporting my decision to
leave for Penn so that I could live with my husband while continuing my graduate study.
My field trips to China were impossible without the tremendous support from many people in
the China’s automotive industry. Song Wei, Li Xin, Dong Ming, Sun Ping, and Gan Quan in
Beijing, Li Yun, Wu Zhiping, and Wang Youzhao in Shanghai were all generous with their time.
They patiently helped me understand the industry and provided me with the information that is the
basis for the case study part of my dissertation. I was deeply humbled by their expertise and
creativity in practice. My friends, Wang Gang, Liu Jia, Qiu Tian, and Lu Yan in China, never
hesitated to lend a helping hand during my stay. My gratitude also goes to the wonderful staff
team at Wharton BEPP, Diana, Jennifer, Beth, Louis. They welcomed me back as a family
member and provided timely help anytime when I need. I also want to thank Maggie, Danielle,
and Mallory, at the Wharton PhD office, for their excellent assistance.
I was surrounded with tons of love and prayers by many. I only wish I did not miss any of
them. Thank you, my dear sisters and brothers: Chen Lihang, Cheng Xiao, Han Lining, He
Andong, He Xia, Heng Junyao, Hu Jing, Hu Jinsheng, Huang Sijia, Irene, Jin Ye, Li Xuxiao, Liu
Yiqin, Mao Rui, Rao Yunjie, Wang Min, Wang Xiaozhou, Yu Yuezhao, and Zhang Hui in Hawaii,
and Chen Qi, Wang Fenfen, Wang Qian, Wang Xue, and Ying Mingjie in Philadelphia. My dear
friends, Liu Yunxian, Su Shu, and Zhang Shijing, have me in their hearts and tireless prayers no
matter how far we are apart. Thank you, Pastor Simon Lee, for your love and prayers for our
family. Helen and Zhongjie Liang, Philip and Anya Siu are my spiritual mentors, in whom I always
trust in times of troubles and confusion.
I am now writing this acknowledgement in the living room of my friends’ home. Gong Bo and
Xie Dawei, as well as Cao Kui and Huang Yijing, generously open their home to me during my
brief stay in Philadelphia. They treat me like a family member. Indeed, we are a family! I would
like to thank my dear sister Li Ning, who had warmly welcomed me to her office at the University
partner. I also want to thank Dr. Kwok Fai Cheung at the Ocean and Resources Engineering
Department of UH-Manoa, for generously allowing me to share office with Li Ning at the HIG
building.
Thank you, Baba and Mama! You are such wonderful parents! You walked through this long
journey with me and never lost your faith in me. Your love sustains me and gives me courage to
keep going. Thank you, my in-laws, for your constant support and prayers. You treat me like your
own daughter and offer help whenever we need. Thank you, my dear daughter, Wang Baiyi
(Tutu)! You have brought so much joy into my and daddy’s life. Your smiles truly brightened many
dark days. I cherish every moment with you! One of the reasons why I did not give up midway is
that I wanted to learn how to overcome my deep-rooted fears so that one day I could teach you
how to battle with your own fears. With each passing day, the most important thing of which I’ve
become more and more certain is that I have the best husband―wise, insightful, eloquent,
passionate, steadfast, trustworthy, responsible, supportive, gentle, humble, humorous, … and
handsome!How wonderful that we could hold hands and grow into maturity together!
Three and a half years ago, it was the first time when I travelled from Hawaii back to
Philadelphia, leaving my 8-month-old daughter at home. Without data, case study evidence, or
any materials which could be used in my dissertation, I was completely hopeless. I did not know
how to proceed. While I was weeping on the plane, this passage came into my sight, “those who
sow in tears shall reap with shouts of joy! He, who goes out weeping, bearing the seed for sowing,
shall come home with shouts of joy, bring his sheaves with him.” At that moment, I burst into tears
again, but tears of hope this time. For the next three and a half years, it was His faithfulness and
mercy that sustained me until this very moment. This morning (on the day of my defense), when I
woke up, instead of being fearful, I felt complete peace. I knew it was He who had caused my fear
to fly. Thank you, my dear Lord, for never leaving me or forsaking me. If there is only one thing
ABSTRACT
ESSAYS ON THE ROLE OF KNOWLEDGE IN RECENT CHINESE
DEVELOPMENT
Jie Bai
Howard Pack
Chapter 1: Earlier studies have consistently found evidence for productivity externalities
of FDI through backward linkages. However, most studies do not use direct measures of
backward linkages, nor do they further investigate what exactly generates these
productivity externalities. Using a unique dataset from the Chinese automotive industry,
which provides direct supply linkage measures, this study shows that compared with
suppliers that only sell to domestic brands, the total factor productivity premium is about
16.7 percent for auto parts suppliers that sell to at least one foreign brand. Employing
difference-in-differences estimation, a causal link from backward linkages to the
suppliers’ productivity growth is also established. Specifically, auto parts suppliers’
productivity grows by 25.5 percent in the first year after formal supply relationships are
forged with foreign joint venture automakers, and productivity continues to grow at least
over the next two years. The case study further identifies knowledge transfer from joint
venture automakers as an important source of productivity gains in local suppliers. It also
offers three caveats that need to be taken into account when interpreting the observed
Chapter 2: Intellectual property piracy is widely believed, by authorities in both U.S.
industry and government, to be rampant in China. Because we lack evidence on the rate
at which unpaid consumption displaces paid consumption, we know little about the size
of the effect of pirate consumption on the volume of paid consumption. We provide
direct evidence on both the volume of unpaid consumption and the rate of sales
displacement for movies in China using two surveys administered in late 2008 and
mid-2009. First, using a survey of Chinese college students’ movie consumption and an
empirical approach parallel to a similar recent study of U.S. college students, we find that
three quarters of movie consumption is unpaid and that each instance of unpaid
consumption displaces 0.14 paid consumption instances. Second, a survey of online
Chinese consumers reveals similar patterns of paid and unpaid movie consumption but a
displacement rate of roughly zero. We speculate on the small displacement rate finding
TABLE OF CONTENTS
AKNOWLEDGEMENT………...iv
ABSTRACT……….vii
LIST OF TABLES……….………..x
LIST OF FIGURES………...xii
CHAPTER 1………..1
LIST OF TABLES
Chapter 1 Tables
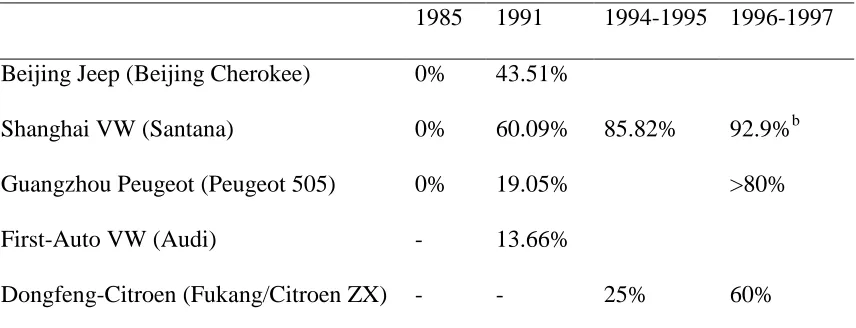
Table 1: Local Content Rates of Joint Venture: 1985-1997……59
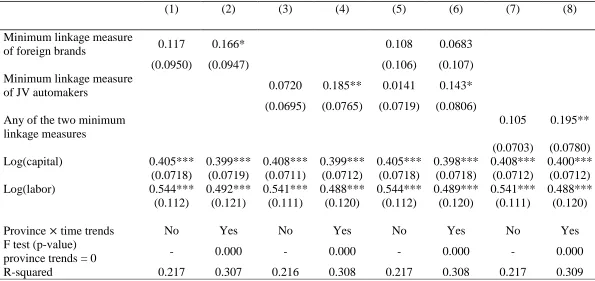
Table 2: The Production Function Estimations with Direct Backward Linkage
Measures, Initial Estimates……60
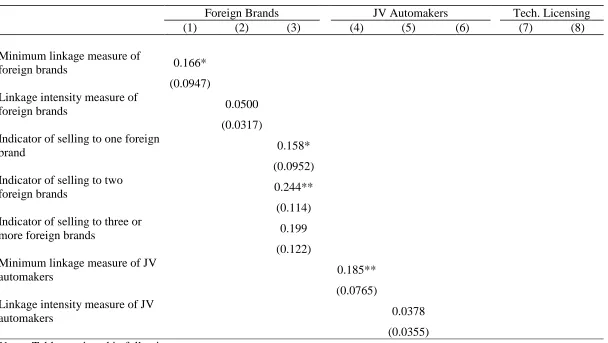
Table 3: The Production Function Estimations with a Variety of Direct Backward
Linkage Measures……61
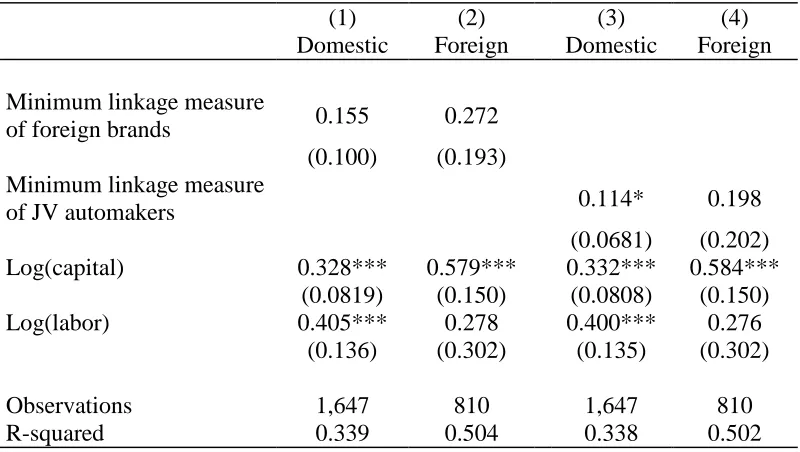
Table 4: The Production Function Estimations with Direct Backward Linkage
Measures, by Supplier Firms’ Ownership Type……63
Table 5: The Production Function Estimations with Backward Linkage Measures of
Foreign Brands, by Supplier Firms’ Age……64
Table 6: The Production Function Estimations with Backward Linkage Measures of
Foreign Brands, by Intermediate Product Category and Region……65
Table 7: The Production Function Estimations with Backward Linkage Measures,
Controlling for Agglomeration and Competition Effects……66
Table 8: The Production Function Estimations with Backward Linkage Measures
with Leads and Lags……68
Table A. 1: Summary of Variables……69
Table A. 2: The Production Function Estimations with Backward Linkage Measures
Table A. 3: The Production Function Estimations with Backward Linkage Measures
of JV Automakers, by Intermediate Product Category and Region……72
Chapter 2 Tables
Table 1: Summary of Respondents’ Characteristics……110
Table 2: Respondent Movie Viewings, by Mode (Student sample)……112
Table 3: Respondent Movie Viewings, by Movie Type (Student Sample)……113
Table 4: Respondent Movie Viewings, by Movie Type (Online Sample)……114
Table 5: Paid and Unpaid Movie Consumption……115
Table 6: Cross Sectional Regressions with Different Observables……116
LIST OF FIGURES
Chapter 1 Figures
Figure 1: Entry Timeline of Joint Venture Brands: 1984-2004…….18
Figure 2: Changes of Minimum Linkage Measures over Years, 1998-2004……22
Figure 3: Estimated impact of backward linkages on supplier firms’ productivity for
years before, during, and after suppliers began to sell to foreign brands……32
Figure 4: Joint Venture Automaker B and Its Local Suppliers……42
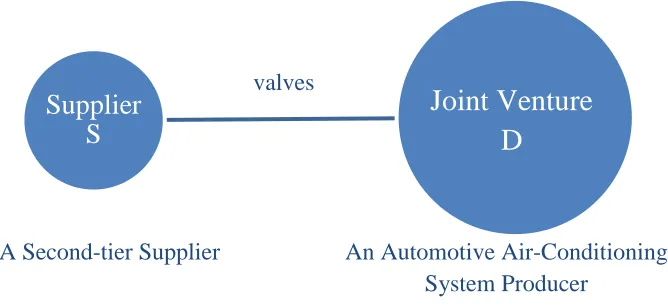
Figure 5: Joint Venture D and its Local Supplier S……47
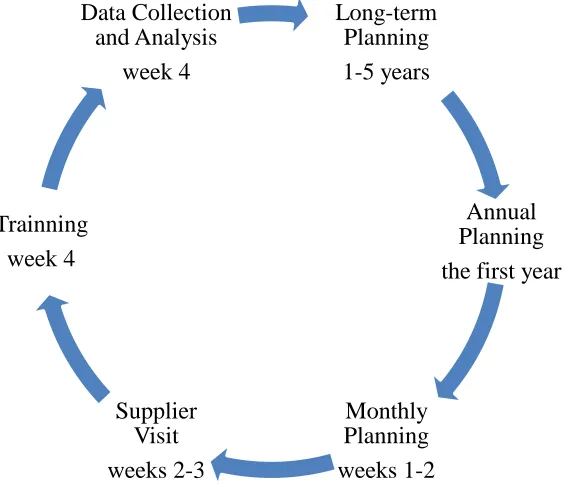
Figure 6: Company D’s Standard Operating Mode of Supplier Continuous
Improvement (Source: Company D’s report) ……48
Figure B. 1: Cycle Times of Working Stations before the Kaizan Improvement……73
Figure B. 2: Cycle Times of Working Stations after the Kaizan Improvement……79
Chapter 2 Figures
Productivity Externalities of FDI through Backward Linkages with
Local Suppliers: The Case of the Chinese Automotive Industry
1
Introduction
Many countries strive to attract foreign direct investment (FDI), which is taken as
a catalyst for industrial development. Expecting FDI inflows to bring a package of capital,
technology, and management skills, host countries tend to offer multinationals many
favorable conditions, such as subsidies, tax holidays, policy loans, and so on. Extensive
research efforts are devoted to examining FDI externalities and understanding its
mechanisms in order to justify, or to provide guidance for, policy implementation. This
study focuses on a specific kind of FDI externalities, the backward externalities, which
take place when the domestic suppliers’ productivity increases through their interaction
with their downstream multinational customers and the value of these benefits are not
fully internalized by multinationals.
The purpose of this study is twofold. First, it examines whether the productivity of
local suppliers is enhanced by their backward linkages―partnerships with multinational
affiliates in the host country. The analysis departs from the recent literature by using a
direct measure of backward linkage―whether a local supplier sells to multinational
customers―which is rarely observed in previous studies. This direct backward linkage
measure makes it possible to conduct a causality test to investigate whether foreign
investors in downstream sectors actually bring about the higher productivity levels of
their local suppliers. However, economic policy intervention may not be warranted in
not necessarily constitute evidence for pure externalities or knowledge spillovers. These
suppliers' productivity may improve for reasons other than knowledge transfer, as Keller
(2010) points out. Therefore, the second goal of this study is to explore the sources of the
observed productivity externalities through backward linkages. Drawing upon fieldwork,
this study first examines how backward linkages manifest themselves in the automotive
industry and focus on various forms of technology transfers from multinational buyers to
their local suppliers. Then concrete measures are provided for cost reduction and
productivity increases in some auto parts suppliers as a direct consequence of knowledge
transfer through backward linkages.
Unlike previous studies that have looked at entire manufacturing sectors,1 this paper
focuses on a particular industry―the Chinese automobile industry―broadly defined as
also including automobile parts and components suppliers. This setting provides two
main advantages for researchers. First, certain features of theautomobile industry suggest
it may be a major beneficiary of FDI's externalities through backward linkages. The
flows of FDI in the automotive industry have been among the largest in the
manufacturing sector, and the globalization of production has been most extensive. In the
vertical direction, multinationals worked closely with suppliers in the host country to
increase those suppliers' productivity (Moran 2005). Second, using the richer dataset of
the Chinese automobile component industry, it is possible to overcome the significant
data restrictions faced by earlier researchers. Previously, researchers have lacked detailed
information on customer-supplier linkages, resorting to industry input-output tables to
compute an industry-level proxy for the foreign presence in the industries that are being
supplied by a particular industry. This conventional estimator is “best interpreted as the
effect of an increase in the availability of technology on the average productivity of
sellers in a particular industry in a particular region” (Blalock and Gertler 2008, 410).
With firm-specific supply linkage information, it is possible to conduct a direct test as to
whether suppliers selling to multinational car producers are more productive than those
selling to indigenous carmakers. This is a more ideal measure of backward linkage, since
it is based on the actual supply linkages of foreign buyers2 to local suppliers and thus
captures the extent of potential interactions between them.
Two results are presented in the econometric analyses. First, supplier firms’ total
factor productivity is positively correlated with their backward linkages with
multinational buyers. Compared with suppliers that only sell to domestic brands, the total
factor productivity premium is about 16.7 percent for auto parts suppliers that sell to at
least one foreign brand. This productivity premium varies little after adding the control
variables of firm age, agglomeration, and competition; it also remains positive in most
cases across various groups of suppliers according to firm age, foreign ownership,
product categories, and region. Second, a causal link from backward linkages to the
growth of the suppliers’ productivity is established in a productivity trajectory analysis of
suppliers' productivity growth before and after selling to foreign brands. Employing
difference-in-differences estimation, auto parts suppliers’ productivity grows by 25.5
percent in the first year after forging partnerships with foreign brands, and it continues to
grow in the following few years.
Although suppliers’ productivity improves if they are linked with multinational
customers, the econometric analyses do not identify any particular sources of the
observed productivity externalities. Case evidence from a joint venture automotive
manufacturer and several local suppliers is used to supplement the econometric analysis
by providing a real-life picture of knowledge transfer from joint venture automakers to
local suppliers and how the transferred knowledge manifests itself in terms of enhanced
productivity.
The case study identifies knowledge transfer from joint venture automakers as an
important source of productivity gains in local suppliers. First, joint venture automakers
have incentives to transfer technical knowledge and management practice to their
suppliers in the rapid localization process. Second, the knowledge transfer is not a
one-way diffusion from foreign investors to their suppliers; instead, it takes many forms both
before and after actual production begins. Specifically, joint venture automakers provide
a combination of direct knowledge transfer, inducement mechanisms for internal efforts,
and platforms on which knowledge can be shared, or even created, through interactions
among suppliers. Third, the examples of two suppliers provide evidence for the suppliers’
enhanced productivity, quality improvement, and cost reduction as direct consequences
of knowledge transfer from their joint venture automakers.
However, three caveats, revealed in the case study, need to be taken into
econometric analyses. First, knowledge transfer from joint venture customers to their
suppliers may be costly; thus knowledge transfer may not constitute externalities. Second,
the case study also finds several other sources of observed productivity externalities
related to backward linkages, which, unlike knowledge spillovers, are not necessarily true
externalities. Third, an important feature about product launch in joint venture
automakers’ local suppliers―a one to two year lag between the procurement contract and
the actual production―is identified in the case study. During this period of time,
substantial knowledge diffusion and absorption could take place, but was not captured in
the econometric analysis. For that reason, the aggregate productivity-enhancing effect of
supplying joint venture automakers tends to be underestimated.
The rest of the paper is structured as follows. Section 2 reviews literature on FDI’s
productivity spillovers through backward linkages. Industry background is provided in
Section 3 to explain why unique evidence from the Chinese automobile industry's
experience with FDI helps in addressing the research questions. Section 4 describes the
data and empirical specifications, followed by the econometric results. Section 5 is
devoted to case evidence gathered from industry interviews to explore the sources of
observed productivity externalities through backward linkages. Concluding remarks are
in Section 6.
2
Literature Review
In the literature, researchers have identified multiple channels of productivity
externalities of FDI through backward linkages, but econometric studies—at best—
review of the multiple channels of productivity externalities of FDI through backward
linkages that researchers have identified. After that, the common econometric method
and proposed possible improvements are described.
2.1 Channels of Productivity Externalities through Backward Linkages
FDI can be a source of productivity externalities, including both pure and pecuniary
externalities. Knowledge spillover is a form of pure externality that the market fails to
take into account. Pecuniary externalities take place through market transactions. A few
theoretical studies have explored the mechanisms of productivity externalities through
backward linkages; some empirical work also has highlighted the importance of
particular mechanisms.
Direct Knowledge Transfer
A number of scholars have argued that multinationals may transfer technology to
suppliers as part of a strategy to build an efficient, high quality supply base in the host
economy (to name a few, Javorcik 2004; Pack and Saggi 2001). However, if the benefits
of knowledge transfer are internalized through input price reduction or direct consultant
payment, the transferred knowledge does not generate productivity externalities. Thus, it
is necessary to examine the features of knowledge transfer when relating it to pure
externality. Pack and Saggi (2001) propose a mechanism through which knowledge
transfer from multinationals may generate social benefits. They suggest that
multinationals may have incentives to diffuse technology deliberately to upstream
encourage entry into the supplier market so that these multinationals may reap the
benefits of increased competition and a reduced input price in the upstream sector.
Competitive pressure
Enhanced competition in the consumer good market forces suppliers to engage more
in innovative activity and to improve productivity, but competitive effects differ among
suppliers. Chung, Mitchell, and Yeung (2003) find that downstream FDI by Japanese
auto manufacturers by and large has a positive effect on upstream suppliers in the US
automotive components industry, but tie-in relationships did not particularly increase the
productivity of supplier firms. Without systematic analysis, Chung et al. simply attribute
competitive pressure as the primary cause of overall productivity growth.
Demand-scale effect
The entry of multinationals creates demands for domestic intermediate goods
providers. Under an assumption of increasing returns to scale, the productivity of local
firms would rise as they spread their fixed costs over a larger market, helping them move
down their average cost curves (Markusen and Venables 1999). Javorcik (2004) estimates
this scale effect by including the demand for intermediates calculated from information
on sourcing patterns from the input and output matrix as well as the value of production
in using sectors. She finds a positive correlation between demand in downstream sectors
and firm productivity.
Input variety
Rodriguez-Clare (1996) proposes another mechanism through which the demand
is love of variety for inputs in the production of final goods and that inputs are produced
with increasing returns to scale. This increased demand for inputs allows a final-good
firm to create a greater variety of specialized inputs, and this in turn leads to an increase
in the productivity of domestic suppliers. Compared to local final-good firms,
multinationals are more likely to generate a positive linkage effect because the products
multinationals produce are more complex.
Quality Linkage
Javorcik (2004) mentions another channel of positive productivity externality from
MNCs to suppliers. Multinationals impose more stringent quality requirements for
process and product, providing incentives for domestic suppliers to improve their
technologies or management. In their interviews, Rodriguez-Clare and Alfaro (2004) find
that local firms had decided to upgrade the quality of their production processes in order
to become MNC suppliers, even though these upgrades required significant investment.
Presumably, the quality upgrading by suppliers would be reflected in an increase in their
measured total factor productivity (TFP).
2.2 Review of Current Econometric Methodology
The general empirical model specified below is the most frequently encountered in
econometric tests of FDI spillovers through backward linkages. The empirical strategy is
to calculate a backward linkage measure and to examine the correlation between firm’s
productivity and the linkage measure. A positive coefficient on the backward linkage
For example, consider a foreign-invested automaker (the buyer) and a local bumper
producer. Suppose that selling bumpers to the foreign-invested automaker improves the
bumper producer's productivity. It could be the case when the automaker assists its
bumper suppliers at a cost below market value, or when the pressure from the automaker
elicits best efforts from its bumper supplier. Regardless of the mechanisms, the enhanced
productivity due to customer relationships with foreign-invested producers is counted as
positive FDI spillovers through backward linkages.
As Gorg and Strobl (2005) argue, such an empirical specification does not consider
spillover channels explicitly. Any externalities from interactions between suppliers and
their customers of foreign brands are accounted for in the production function estimation.
The coefficient on the backward linkage measure picks up a net effect of FDI―a
combined effect of knowledge transfer, competition, scale effect, and linkage effects, as
reviewed above.3
(1)
stands for the real output of firm operating in sector at time , which is usually
calculated by priced-adjusted production output or value added. is defined as the
value of fixed assets at the beginning of the year, deflated by investment price index.
is the total number of employees; it is also expressed in terms of efficiency units, which
are computed by dividing the wage bill by the minimum wage (B. S. Javorcik 2004). In
3
some cases, measures of materials are also included in the specifications. Backward
linkage is measured by the share of the total output of an industry that is sold to
downstream foreign buyers across all industries. Specifically, it is defined as in Blalock
and Gertler (2008) and (B. S. Javorcik 2004):
where is a proxy for horizontal spillovers, represents the proportion of the
total output of a given industry in a given year4 produced by all foreign affiliates. It is
defined as below:
This captures the extent of foreign presence in sector at time and assumes that
technology spillovers from foreign firms to local rivals increase when there is an increase
in either the output of foreign investment enterprises or the share of foreign equity in
these firms.
is the proportion of sector j′s output supplied to sector k. The common approach
to approximating is to use the input-output coefficients taken from the host country’s
input-output tables. These tables show the amount that firms in one industry purchase
from each of the other industries. Together with the information on the share of output in
4
industry j that is produced by foreign-owned firms (horizontal spillover measures), a
measure of backward linkage can be constructed, which is the sum of the output shares
purchased by other industries multiplied by the share of foreign output in each purchasing
industry.
Instead of being a direct measure of potential spillovers through backward linkages,
as Blalock and Gertler (2008) point out, this industry-level measure captures “the
availability of buyers’ foreign technology to sellers in a particular industry” (p. 410). This
measurement choice, adopted by almost every prior paper in the literature, is largely
driven by the data limitations because researchers rarely observe the specific supply
relationship from local suppliers to foreign investors, not to mention the intensity of
knowledge flow.
This industry-level linkage measure has some limitations which may result in
measurement errors. First, the input-output tables are compiled for the entire national
economy, usually every five years. Most studies use coefficients in one such table for
computing backward linkage measures across years. Thus varies only across
industries. In some cases, the backward linkage measures are defined at 20 NACE 2-digit
industries (B. S. Javorcik 2004). The most disaggregated level can be up to 145
manufacturing industries (Lileeva 2010).
Second, this industry-level measure is built upon several strong assumptions that are
very likely to be violated in reality. These assumptions include the following: 1) the share
of firms’ demand in a sector for a particular input is proportional to its output share. This
measure ; 2) the input sourcing pattern is invariant across domestic firms
and foreign multinationals of different nationalities. This assumption is the result of using
input-output coefficients as demand measures of intermediate product (as in ). Barrios,
Görg, and Strobl (2011) argue against the validity of these assumptions. Rodriguez-Clare
and Alfaro (2004) also provide evidence that multinationals’ sourcing patterns are not the
same as those of domestic firms. Biased linkage measure could potentially lead to biased
estimates of the impact of backward linkages on productivity; moreover, there is no clear
prior knowledge regarding the direction of the bias.
Recent studies find evidence for prominent productivity externalities through
backward linkages from downstream foreign firms to upstream suppliers. Using panel
data for Lithuania from 1996 through 2000, Javorcik (2004) finds evidence for the
existence of productivity externalities from FDI taking place through contacts between
foreign affiliates and their local suppliers in upstream sectors. Specifically, a
one-standard-deviation increase in the foreign presence in the sourcing sectors is associated
with a 15-percent rise in output of each domestic firm in the supplying industry. Blalock
and Gertler (2008) find the evidence for positive backward externalities in Indonesian
manufacturing establishments from 1988 through 1996. Firm output increases almost 9%
as the share of foreign ownership downstream rises from zero to one. Two recent papers
that investigate vertical FDI spillovers by Du, Harrison, and Jefferson (2011) and Lin,
Liu, and Zhang (2009) focus particularly on Chinese manufacturing sectors. Using an
much larger backward linkage spillover effect than was found in previous studies of other
countries.
In contrast to studies using industry-level backward linkage measures, two papers
stand out by employing direct measures of backward linkages. Javorcik and Spatareanu
(2009) combine firm-level panel data on balance sheets with an enterprise survey that
identifies the specific supplying relationships with MNCs. With direct measures, they are
able to distinguish self-selection from learning effects. Using Probit and Linear
Probability models, they find that more productive firms are more likely to supply MNCs.
Using an IV approach, they find evidence for Czech suppliers learning from their
relationships with multinational customers. Most specifications suggest that MNC
suppliers are 12%-15% more productive than other firms.
Focusing on the US auto-component industry, Chung, Mitchell, and Yeung (2003)
carefully identify firm-specific supply relationships between Japanese auto-transplants
and their local US component suppliers, what they called “tie-in” relationships. Their
findings stand in stark contrast to Javorcik and Spatareanu (2009) and the aforementioned
studies using industry-level linkage measures. First, they find evidence for adverse
selection: tie-in firms tended to be less productive than non-tie-in firms before tie-in
relationships began, suggesting that transplants chose less productive local firms as
suppliers. Second, they found no evidence for direct technology transfer. US firms that
supplied Japanese manufacturers did not increase productivity more than suppliers that
The different results probably arise from the fact that Chung, Mitchell, and Yeung
(2003) study the US automotive industry, where the advanced state of physical
technology reduces the potential for technology transfer, while Javorcik and Spatareanu
(2009) study the manufacturing sectors in a developing country, where levels of both
physical technology and production methods are relatively low compared to their foreign
entrants.
3
FDI in the Chinese Automobile Sector and the Development of Local
Suppliers
The Chinese automobile industry is an attractive setting for research on FDI’s
spillovers from backward linkages for two reasons. First, the Chinese automobile
industry received a tremendous amount of foreign investment in past three decades,
which played a crucial role for the sector development. Second, local supply linkages
have become rather extensive, thanks to FDI and local efforts. Thus, it is more likely to
generate productivity spillovers, if there are any, through backward linkages.
There are two developmental stages of auto industry. The first, beginning from early
1980s, is a combination of trade protection, openness to FDI, and local content
requirements. Since a few years before access to WTO, it gradually moves away from the
protectionist approach and invites competition, both domestic and international, to be the
transforming force in the industry.
From 1982 to 2013, China accumulatively absorbed a total of $2557.1 billion in FDI.
For many years in the 1990s, China claimed to be the world’s second largest recipient of
(World Development Indicators 2015). Reliance on foreign investment is the defining
feature of the development path of the Chinese automobile sector. China opened the
domestic market in exchange for technology and managerial skills embodied in foreign
investment (Thun 2006, 63).
As China began to open itself to world trade in the late 1970s, multinational firms
were lured by the China’s population and market potential. A distinct feature of FDI in
the Chinese auto sector is “market-seeking”, as Thun (2006) puts it. As Chinese citizens’
disposable income increased dramatically since early 1980s, they desired to have cars in
their consumption bundle. Previously prohibited from using private vehicles, government
officials began to enjoy the privilege to use cars. In addition, China then began to open
itself to international tourism and foreign business. All these contributed to an increasing
demand for taxis and other passenger cars (Harwit 2001).
Besides openness to foreign direct investment, the Chinese auto sector had initially
been nurtured in a protectionist environment before entering the WTO. Foreign investors
can produce automobiles in China only through partnership with state-owned enterprises;
and foreign ownership is restricted to less than 50% (State Planning Committee 1994, art.
32). This gives the Chinese partners leverage to negotiate for technology transfer as part
of any agreement. In addition, tariffs were as high as 200% in the 1980s and, with import
quotas, only 30,000 vehicles were annually allowed from foreign carmakers. Foreign
participation was also constrained in sales and distribution (Gao 2002, 148).
Believing that a rapidly rising local content rate was a key factor in the early success
Local content requirements (LCRs), one of such efforts, were embedded in China’s
approach to the automobile industry. The LCR policy was designed to create
technological linkages to the component industries. It combined with a varied tariff rates
according to the local content ratio of assembled vehicles. For passenger cars whose local
contents exceeded 80%, the tariff rate on imported parts and components is 40%; for
local contents of 60%-80% and below 60%, the tariff is 60% and 75%, respectively
(Zhang 1997, 389).
It would be futile to pressure joint venture automakers to use local parts if local
suppliers could not provide components of the desired quality. Some municipal
governments made combined efforts to create local supply capabilities. In Shanghai, a
Localization Office was formed directly underneath the mayor’s office to deal with the
local supply sector on a daily basis. The Office identified the most likely components to
be replaced by local factories, selected potentially capable factories, and worked with
managers of supply firms who hoped to form linkages with Shanghai Santana through
upgrading their technical capabilities.5 Moreover, it provided supply firms with access to
investment funds at preferential rates to import foreign technology and equipment. The
massive funds were collected through the so-called “localization tax,” which was levied
by the Shanghai government and was amounted to 16 percent of Santana’s retail price at
the time. Between 1988 and 1994, the localization tax in Shanghai reached over RMB 5
billion (Huang 2003, 266). The Localization Office was extremely effective in helping
local suppliers manufacture components that met Santana’s standards.
The technical standards of Chinese automobile component suppliers in mid-1980s
were three decades behind international component suppliers. As the managing director
of Shanghai Volkswagen claimed, “in the beginning there wasn’t a single local parts
supplier which could produce a part we could assemble into the Santana.” (People’s
Daily Press 1988). Despite the low starting point, the manufacturing capability of the
supply sectors increased sharply over the course of the next decade. As Table 1 shows,
local content rates of various JV brands began to rise very quickly. Shanghai Santana
achieved the highest possible local content rate, 92.9%, in 1997.6 Thun (2006) points out
that a virtuous circle links production volumes to the health of a supply network: “local
suppliers made it possible to raise volumes (due to restrictions on foreign exchange) and
high volumes created the economies of scale that made a components business viable.”
Initially nurtured in a highly protective environment, the Chinese automotive industry
was gradually exposed to increasing domestic competition as a result of a dramatic
increase in FDI and impending accession to the WTO. By 2006, import tariffs were cut
from 100% to 25% for passenger cars and from 24% to 10% for auto components. Quotas
on automobile imports would be phased out by 2005 (UNCTAD 2000, 54). Although
trade barriers were not lowered until 2005, an increase in the number of joint ventures
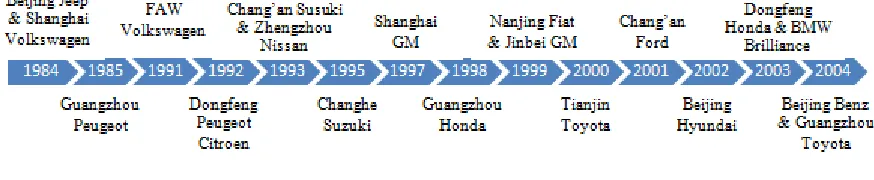
raised the level of domestic competition. After Beijing Jeep and Shanghai Volkswagen
became the first two joint-venture car producers in 1983, major global car producers
followed their steps and set up production facilities in China in the following two decades
(see Figure 1).
Figure 1: Entry Timeline of Joint Venture Brands: 1984-2004.
Increased domestic competition brought down the price of automobiles considerably
in China. Nearly every car brand reduced its selling price (China Economic Information
Network 2004, 48-50). The price of a Volkswagen Jetta, had fallen by one-third in the
past three years since 2002, to 100,000 yuan ($12,000) in late 2004 (Economist 2005).
Competitive forces became an impetus for supply firms to raise productivity and to
reduce prices constantly. In the highly competitive environment, assembly plants were
facing many alternatives which did not exist in the initial stage. If a supplier did not meet
the quality, price, and service needs of a customer, the assembly could import the
necessary components or turn to wholly foreign-owned suppliers. The data sample in the
following analysis, ranging from 1998 to 2004, covers this competitive development
4
Econometric Analysis
4.1 Data Sources
The analysis here is based on data from the China Automotive Industry Yearbook
(CAIY).7 Since the early 1990s, the China Automotive Technology & Research Center
(CATARC) has conducted an annual cross-industry survey of automotive manufactures,
including automakers and their automobile parts suppliers. CAIY’s last chapter is
devoted to an enumeration of thousands of automotive manufacturers. Variables include
output, value added, assets, and employment, which are ingredients to compute firms’
total factor productivity. Most importantly, the data set contains unique information as to
which brands each supplier made sales. It is the key to constructing direct backward
linkage measures. In addition, the CAIY data set is supplemented with the China Annual
Survey of Manufacturing Firms (CASMF) database, which covers firms’ characteristics
information, such as founding year, ownership (state-owned, joint venture, or
foreign-owned, and so on), and industrial classifications. Additional characteristics information is
available for about one half of the suppliers in the data sample. The analysis covers the
years, 1998 to 2004, a period of time when these variables were recorded consistently.8
The panel data set consists of 1,017 supplier firms in 3,450 firm-year combinations. A
complete summary of variables can be found in Table A. 1.
7 CAIY is published by the China Automotive Technology & Research Center (CATARC) and the China Association of Automotive Manufacturers (CAAM).
8
The CAIY data set does not specify whether a domestically manufactured automobile
brand is produced by a joint venture automaker or a domestic one. Thus a mapping table
was compiled, connecting hundreds of brands with their manufacturers and sorting these
brands and automakers according to their characteristics.9 Key information includes
whether a brand is a foreign brand10 or indigenous one and whether an automaker is
domestic or a joint venture with a foreign car producer.
Although the automobile manufacturing industry is broadly defined as including
passenger car producers, commercial car producers, motorcycles producers, and car
remodeling companies, analysis is limited within a sample of suppliers of passenger cars.
Given the fact that the majority of foreign direct investment takes place in the production
of passenger cars, if there are productivity spillovers, firms supplying passenger car firms
are most likely to be the beneficiaries. Therefore, when interpreting the spillover results,
the estimate is an upper bound of backward productivity spillover effect.
4.2 Empirical Framework
In order to identify the effect of supplying a joint venture automaker on productivity,
this study examines whether auto component suppliers which have a supplier relationship
with joint venture automakers were more productive, ceteris paribus. This effect is
estimated using log-linear production functions at the firm level with backward linkage
measures and a few dummies. The production function controls for input levels and scale
9 The information about brands and automakers are hand-collected from online public sources.
effects. Fixed-effects models of the form are estimated on a sample of auto component
and parts suppliers:
(2)
where the dependent variable is log output of firm at time , proxied by firms’ value
added. and indicate capital and labor of firm at time , proxied by
end-of-year total assets and end-of-end-of-year total employment. Value added and total assets are
nominal values deflated to 1991 RMB.11 In addition to backward linkage measures ,
all estimates include a fixed effect for firm , that control for time-invariant
unobservable firm characteristics, such as managerial ability, and year dummies , that
control for changes common to all firms in a particular year. Most models also include
linear province trends―the province-by-year dummy variables―to control for changes
common to all supplier firms in a province at a particular time. These province-specific
time trends take into account the uneven economic development across provinces. They
control for any shocks that affect all firms in a given province equally. Standard errors
are clustered at the firm level to correct within-firm serial correlation.
4.3 Direct Backward Linkage Measures
A unique feature of the CAIY dataset of the China’s automobile industry is
supplier-buyer linkage information. In each single year between 1998 and 2004, we observe that
automobile parts and component suppliers sold certain intermediate products to some
automobile brands or automakers. Thus it is possible to construct direct measures of
backward linkage between part suppliers and the auto brands to which they sold. One of
such linkage measures is the so-called minimum linkage of foreign brands, an indicator
which equals one if the supplier sold to at least one domestically produced foreign brand
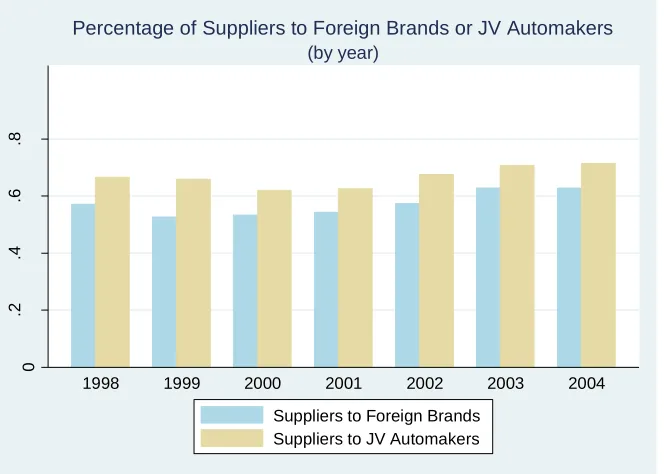
in a particular year. Figure 2 shows that over half of suppliers sold to at least one foreign
brand and over sixty percent sold to at least one joint venture automaker. The ratio
remained rather stable during the period of 1998 and 2004.
Figure 2: Changes of Minimum Linkage Measures over Years, 1998-2004
By using the minimum linkage measure, it is assumed that the effect of interacting
with foreign auto brands is similar across auto component suppliers, no matter how many
foreign brands to which they sold. This is apparently a very strong assumption.
Presumably, the more frequent the interactions with foreign brands, the higher the
benefits are (if there are any).
Linkage intensity, the second linkage measure, intends to capture the intensity of
interactions between suppliers and its foreign customers. In the data, the interaction
0
.2
.4
.6
.8
1998 1999 2000 2001 2002 2003 2004
(by year)
Percentage of Suppliers to Foreign Brands or JV Automakers
intensity is measured by the number of foreign brands which a supplier sells to in a
particular year.12 This assumes the effect of foreign linkages is linear, while most benefits
may occur during the initial cooperation experience with a foreign brand. The physical
amount of sold auto products is not used because hundreds of components are not
comparable without converting to monetary terms, and component prices are not
available.
Each automobile brand corresponds to a certain automaker. It should be noted that not
every foreign brand is produced by a joint venture automaker. A couple of foreign brands
are actually produced by domestic automakers under licensing agreements; thus the
nature of the interaction is different from those with joint venture carmakers.13 In order to
check whether the linkage effects differ between joint venture automakers and foreign
brands, another set of linkage measures are also included. The minimum linkage measure
of joint venture automakers is an indicator of whether a supplier sold to a joint venture
automaker, while the linkage intensity measure of joint venture automakers is the number
of joint venture automakers to which a supplier sells.
12 It is almost impossible to measure precisely the interaction intensity in firm-level data, because it could be of many dimensions. In one case, an automaker may send a task-force team to a local component supplier to assist them to build up production capacity; in another case, suppliers are regularly summoned by their customer to keep up with up-to-date quality standard or operation practice. In both cases, a certain amount of technical knowledge is transferred to suppliers and potentially improves their productivity. But this level of detailed information can only exist in survey data or case study.
4.4 Initial Estimates
Initial estimates of the equations are found in Table 2. Each column presents a
regression of the log of supplier firms’ output on inputs, firm and time dummies,
province time trend (in even-numbered columns), and minimum linkage measures, which
are equal to one if a given supplier firm is associated with at least one foreign brand or
joint venture automaker in a given year, and zero otherwise. The first two columns
contain the estimated impact of selling to at least one foreign brand on supplier firms’
productivity level. The coefficient of 0.117 in column 1 indicates that after removing
time-invariant firm fixed effect and common year effects, firm productivity grew by
approximately 11.7 percent more in suppliers selling to at least one foreign brand. The
second column adds 2714 province-specific time trends to the model, increasing the point
estimate slightly to 16.6 percent and reducing the SE. An F-test of the hypothesis that the
province trends are jointly zero is strongly rejected by the data; hence these province
trends are employed in most specifications.
Comparable models estimated with linkage measures of joint venture automakers are
found in columns 3-4. The point estimates present similar patterns: firms selling to at
least one joint venture automaker are approximately 7 percent more productive than
suppliers to domestic automakers (col. 3). The premium increases to 18.5 percent when
province trends are included (col. 4). Columns (5) and (6) of Table 2 estimate the impact
of the two linkage measure simultaneously. The point estimate for linkage measure of
joint venture automaker is only minimally affected by the inclusion of the other linkage
measure. Its coefficient of 14.3 remains robust after controlling province trends. By
contrast, the linkage measure of foreign brands appears less important to supplier firms’
productivity, even after including province trends. The last two columns of Table 2 show
that merely having any of the two minimum linkage measures has a significant impact on
supplier firms’ productivity.
4.5 Estimates with a Varity of Linkage Measures
The results in Table 2 suggest that association with at least one foreign brand or JV
automaker has a positive impact on supplier firms’ productivity. Do suppliers associated
with more foreign brands demonstrate higher productivity? Do automakers under
technology licensing agreement with foreign brands generate backward linkage spillovers
to their parts suppliers? These questions are addressed in this subsection, which begins
with the specification from columns 2 and 4 of Table 2, and then introduces in Table 3 a
variety of measures of backward linkages between automobile part suppliers and their
joint venture customers. The second and fifth columns of Table 3 show that merely
associating with more foreign brands or joint venture automakers does not necessarily
improve suppliers’ productivity. Indeed, the first relationship with either a foreign brand
or a JV automaker improves auto parts suppliers’ productivity (col.3 and col.6); the
productivity effect is even more enhanced with connection to a second foreign brand.
However, selling to three or more brands or JV automakers does not have a significant
impact on suppliers’ productivity. This diminishing feature of the backward linkage
their customers. If the self-selection hypothesis dominates, there would be a positive
relationship between parts suppliers’ productivity and the number of foreign brands or JV
automakers to which they sold. Column 7 of Table 3 reveals that selling to a brand under
technology licensing agreement has little impact on parts suppliers’ productivity; merely
having any of the three minimum linkages has no impact either (col.8). It appears that the
linkage measure of brands and automakers―as opposed to the license linkage
measure―matters.
4.6 Estimates by Supplier Firm’s Ownership, Age, Region, and Intermediate Product Category
The robustness of the results was tested by estimating over a variety of subgroups
according to supplier firms’ ownership structure, firm age, region, and their product
category. Estimates are found in table 4-6. A first specification check explores whether
backward linkage spillover effects differ between domestic and foreign-invested parts
suppliers.15 Results of Table 4 show that domestic suppliers to foreign brands or JV
automakers are more productive than other domestic suppliers (col.1 and 3); while in the
group of foreign-invested parts suppliers, the correlation is higher, but insignificant (col.2
and 4). There is no strong evidence that foreign ownership matters for spillovers through
backward linkages. Capital coefficients of foreign-owned suppliers is as high as 0.58,
while it is only 33 percent in domestic suppliers. It is interesting that a wide range of
capital intensity level is maintained among suppliers, regardless of the low wage rate in
China. As (Sutton 2005) points out, a low level of capital intensity makes it more difficult
to reach acceptable quality standards. On the one hand, in order to make sales to foreign
brands of higher quality requirements, suppliers need to attain some threshold level of
capital intensity, however low the local wage level. On the other hand, for suppliers of
domestic brands, they can take advantage of low wage rate, because domestic brands
usually require a less demanding quality standard.
Do backward linkage spillovers exist in a particular age group of parts suppliers?
Column 1 of Table 5 adds the supply firm’s age16 to the baseline specification. The point
estimate of 0.513 indicates that older supplier firms are more productive than younger
ones. By adding a quadratic age variable in column 2, it becomes clear that productivity
grows at an increasing rate as supplier firms become older. In columns 3-5, separate
production function estimations with backward linkage measures are made by three age
groups. Old suppliers are those established before 1970, the middle-aged are between
1970 and 1995, and young suppliers are after 1995. 1970 and 1995 are the two cutoff
points of firm age tertile. Results show that, in spite of being more productive than young
suppliers (col.1), productivity spillovers through backward linkages in old suppliers are
no greater than in young suppliers (col.3 and 5). The spillover effect is less by half in
middle-aged suppliers than in young ones. In Table A. 2, another linkage measure of
automakers shows a significantly positive coefficient only within the group of young
suppliers, indicating that productivity of young suppliers associated with JV automakers
are more productive than their counterparts only associated with domestic automakers.
Apparently young suppliers are major beneficiaries of backward linkage spillovers. They
could adjust and learn faster from their multinational customers.
The data is subdivided to check the consistency of positive productivity spillovers
through backward linkages. Two such tests are discussed here. The top panel of Table 6
presents estimates of the baseline model across subgroups of five intermediate product
categories. The point estimates present a consistent picture: the coefficient of the
backward linkage measure is positive in four out of five categories. In the lower panel of
Table 6 are estimates of the base specification for each of the six geographic regions.
Results show that in four of six regions, parts suppliers selling to at least one foreign
brand are more productive than those selling only to domestic brands. In Table A. 3, the
minimum linkage measure of JV automakers shows similar patterns across five
intermediate product categories and seven regions.
4.7 Exploring the Agglomeration and Competition Effect
This subsection concentrates on two other factors which may influence parts suppliers’
productivity, agglomeration and competition. Agglomeration economies are generally
assumed to improve firms’ productivity through economies that come from localization
and urbanization. The former, proposed by Marshall (1920), focuses on the geographical
concentration of an industry. The latter emphasizes the importance of urban diversity,
which fosters cross fertilizations of different industries within a geographical area (Jacobs
1969). Localization is often proxied by the amount of employment in neighboring firms
in the same industry and same area (Holmes 1999; Martin, Mayer, et al. 2011).
Localization economies: to deal with intra-industry externalities. It is defined as the
number of other employees working in the same industry in the same area.
Index , , , , represents firm, sector, county, and time respectively.
Urbanization economies: to capture the scale of economic activity outside own
industry.
Predictions of the theoretical literature on the impact of competition on productivity
are ambiguous. Competition may force firms to innovate or fail (Porter 1990). In this
view, competitive pressure improves productivity. On the other hand, competition may
decrease productivity because of incomplete appropriation of the returns from innovation
(Glaeser et al. 1992). The inverse of Herfindahl index measures the competition effect.
The Herfindahl index of industry , region , time is defined as below,
To construct agglomeration and competition variables, employment and sales
information of firms are needed within the same industry and outside the industry of
suppliers in the same geographical area. Thus, the original CAIY data was merged with
the Chinese Manufacturing Firms Annual Survey data set according to firm names; the
latter includes all state-owned enterprises and non-stated firms with annual sales of more
than 5 million Yuan.17 After merging, the sample size was reduced from 2,985 to 1,902,
and the reduction is biased towards smaller firms18 due to the sampling strategy of the
manufacturing firm survey.
The baseline specification was considered over a matched subsample of parts
suppliers. Coefficients of linkage measures (col.1 and 5 of Table 7) are slightly different
from the full sample estimation in columns 2 and 6 of Table 2. Table 7 introduces the
agglomeration and competition variables. Columns 2 and 6 show that increasing the
number of other workers of the same industry-area by 10% (localization) and keeping the
size of the other sectors in the area constant decreases supplier firms’ productivity by
0.3%. Urbanization appears to have little impact on firms’ productivity. Competition is
added in columns 3 and 7. The coefficient of competition is positive and statistically
significant, suggesting that more competition is associated with productivity
improvement, consistent with Nickell (1996) that competition tends to increase total
factor productivity growth. Furthermore, including a measure of competition in the
estimation significantly reduces the importance of localization externalities. To test
whether competition effect varies according to backward linkages, an interaction term
between competition and backward linkage measures is added in columns 4 and 8.
Interestingly, although it is possible that competitive pressure may extend beyond
passenger car industry to its supply sectors, the insignificant coefficients on the
interaction terms indicate that the productivity-enhancing impact of competition is no
greater among suppliers selling to foreign brands than those who only sold to domestic
brands; rather, competition exerts positive influence on suppliers in general.
4.8 Inferring Causality via the Timing of Becoming Suppliers to Foreign Brands
The estimations above show that auto parts suppliers to foreign brands are more
productive than their counterparts to domestic brands. But the positive correlation does
not necessarily imply that becoming suppliers of foreign brands causes productivity gains.
Plausible arguments can be made for reverse causality: relatively more productive parts
suppliers are more likely to be selected by foreign brands which hold higher productivity
and quality requirements for their local suppliers. To explore this possibility, a
difference-in-differences model is estimated to compare a group of parts suppliers which
only began to sell to foreign brands between 1998 and 2004 (new suppliers to foreign
brands) with a group of suppliers which only sold to domestic brands, augmented with
leads and lags of their supply status change. Specifically, indicator variables were added
for 1, 2, and 3 years before they began to sell to foreign brands, years 0-2 after selling to
foreign brands, and year 3 forward.
The first column of Table 8 presents the base specification, using foreign brand
linkage measures, augmented with the leads and lags. Three interesting findings emerge.
First, the coefficients on the entrance leads are significantly positive, showing evidence
for selection; that is, foreign brands tend to select more productive suppliers of domestic
brands. Second, in the year immediately before selling to foreign brands, suppliers’
over the subsequent 3 and more years after interacting with their multinational customers,
these parts suppliers’ productivity continues to grow by a rate between 42.9% and 68.6%.
An F-test of the hypothesis that these entrance lags are jointly zero is strongly rejected by
the data, indicating that these new suppliers of foreign brands improve in their
productivity through interactions with their multinational customers. This pattern is
depicted by Figure 3. The subsequent columns of Table 8 repeat the above estimates,
using JV automaker linkage measures and over a subsample of domestic suppliers. The
pattern of coefficients is comparable in each case, only not as statistically significant as
using foreign brand linkage measures (column 1).
Figure 3: Estimated impact of backward linkages on supplier firms’ productivity for
years before, during, and after suppliers began to sell to foreign brands
-.5
-.3
-.1
.1
.3
.5
TFP
i
n
l
o
g
p
o
in
ts
3 Years Prior 2 Years Prior 1 Year Prior Year of Entrance 1 Year After 2 Years After 3 or More Years After
Time passage relative to the beginning year to sell to foreign brands