Energy comparison of MPPT techniques for PV
Systems under different atmospheric Conditions
Hamidreza Khezri
[email protected]
Mojtaba Farzaneh
[email protected]
Abstract— This article compares maximum power point tracking (MPPT), which plays an important role in Solar Photovoltaic (SPV). Fluctuation in electricity or power generation economically is not marketable and therefore electricity production must be kept at maximum power point (MPP) all the time. The cost of electricity from the PV array is more expensive, mainly due to the fact that its production is not very efficient than other electricity generation from non-renewable resources. Therefore, MPPT controllers are applied to improve the performance of PV systems with different requirements and conditions. The photovoltaic system is connected to a DC/DC boost converter to increase the output voltage. To extract the maximum power from a PV system, MPPT algorithms are implemented. In this project, we present a comparative simulation study of three MPPT techniques: Fuzzy Logic (FL), Incremental Conductance (InC), and Perturb & Observe (P&O) based MPPT controller under constant and variable environmental conditions. The simulation results show that FL based MPPT can track the MPP with faster response and good performance compared to the conventional (P&O) and (InC) algorithms by continuously adjusting the duty cycle of the DC/DC converter to track the maximum power of the solar cell. Thus, increasing the efficiency of the entire system. MATLAB/Simulink toolbox is used to develop and design the model of the PV solar system equipped with the proposed MPPT controller.
Keywords— Solar Photo Voltaic (SPV), Maximum Power Point Tracking (MPPT), DC/DC boost converter, MATLAB/Simulink.
I. INTRODUCTION
As we know, energy is a vital role in our lives and the economy. Energy demand has increased in many industrial applications. Unfortunately, in recent years, greenhouse gas emissions, according to conventional energy production
[1]. System Photovoltaic (PV) has a major research area for future energy needs. Thus, researchers have attracted much attention and seem to be one of the most stable sources of renewable energy. Solar energy is due to the lack of moving parts, security, lower maintenance, clean production and no sound [2] [3] [4]. However, two important factors affect the implementation of PV systems. These initial cost and low-efficiency solar panels because of unrealistic sun, cloud and shadow effects. Therefore, due to the I-V and P-V characteristics of PV panels, to increase efficiency we should always try to use the maximum power. In other words, the PV modules with the maximum voltage and current at the maximum power point indicate that the PV depends on the atmospheric conditions. PV systems have the following properties and technical challenges:
1. Depending on the irradiance and temperatures produce more power.
2. The large size of PV panels. 3. The cost of setting the PV system.
4. Difficulty in modelling the PV system behaviour. 5. The space it takes to put the PV panel.
6. The efficiency of the PV system.
A boost converter is a DC/DC power converter that steps up the voltage from its input to its output [5]. The main purpose of this work is to compare three types of MPPT algorithm and find the best one to control the boost converter and gain maximum power of PV panels.
In summary, in this paper, a comparative study of the majority of conventional controllers, perturbation and observation (P&O) and incremental conductance (InC) with fuzzy logic control (FLC), and analyzes them under various conditions such as radiation.
GSJ: Volume 7, Issue 8, August 2019, Online: ISSN 2320-9186
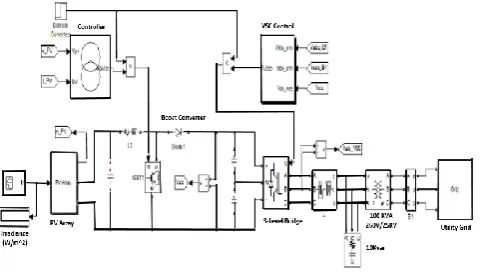
to dealing with imprecise inputs, are not required a detailed mathematical model and nonlinear manipulation, fast convergence and low oscillations around MPP [6]. Suggest the circuit block diagram in Figure 1 is shown.
Fig. 1. Block diagram of the PV system with MPPT
II. THEPHOTOVOLTAIC(PV)SYSTEMMODELING
A solar cell is essentially a p-n semiconductor junction. Figure 2 shows an ideal solar cell with serial and parallel resistance, Rs and Rp, respectively [7].
Fig. 2. Equivalent electrical circuit of a single PV module
The symbols in Figure 2 are defined as follows: Rs : series resistance;
Rp : parallel resistance;
V : output voltage; Iph : photocurrent;
Id : current of parallel diode;
IRp : parallel current;
I : output current;
The current-voltage equation for the equivalent circuit,
I = Iph – Id – IRp (1)
Here, Iph represents the light-generated current in the
cell, Id represents the voltage-dependent current lost to
recombination, and IRp represents the current loss due to shunt resistances [7]. The electrical parameters of the PV 100 KW
module are shown in Table I (T=25 0C and solar irradiation Go=1000 W/m2).
Table I. Electrical parameters of the PV module. (SunPower SPR-305-WHT)
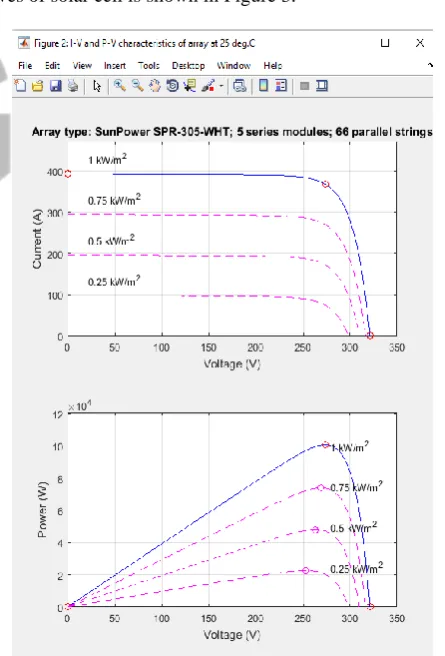
The nonlinear current-voltage (I-V) and power-voltage (P-V) curves of solar cell is shown in Figure 3.
Fig. 3. I-V and P-V Characteristic of the PV array.
All these processes are taken from the PV 100 KW system, in MATLAB/SIMULINK/Simpowersystems software.
III. MPPTALGORITHM
PV system is a nonlinear P-V and I-V characteristics that vary with the temperature and radiant intensity [8]. Therefore, to create PV cells that keep giving maximum power under different operating conditions, a Maximum Power Point Tracking (MPPT) strategy is required [9]. The proposed is to obtain high performance through the MPPT of the PV array by controlling the duty cycle of the boost converter. The MPPT algorithm is essential and represents the heart of the controller. MPPT techniques are classified depending on characteristics like:
- The complexity of the technique, and the number of variables.
- The type of the control method used. - The practical applications of the technique. - The stability and efficiency of the method.
A lot of research has done in the past to improve the efficiency and quality of power PV system. One way to increase the efficiency of PV systems is to operate on its MPPs [10]. The following acceptable MPPT techniques that applied on Various PV applications like space satellites, solar vehicles and solar water pumps, and so on [11].
1. Curve-Fitting (CF) Technique
2. Short-Circuit Current (FSCI) Technique 3. Open-Circuit Voltage (FOCV) Technique
4. Feedback of Power Variation with Voltage (FPVV) Technique
5. Feedback of Power Variation with Current (FPVC) Technique
6. Perturbation and Observation (P&O) and Hill-Climbing Technique
7. Incremental Conductance (InC) Technique 8. Intelligent MPPT Techniques:
i. Fuzzy Logic (FLC) Based MPPT Technique.
ii. Artificial Neural Network (ANN) Based MPPT Technique iii. Particle Swarm Optimization Based MPPT (PSO-MPPT) Technique.
And many other methods. Analyzing all of these MPPT techniques is difficult to study with individual structures because each method has advantages and disadvantages. MPPTs can only be analyzed by comparing them according to the classification, advantages, disadvantages, control strategy, control variables, circuit and applications [11].
Most of these methods are local maximum and some, like the open-circuit voltage or the, short-circuit current, is approximately the same MPP which is not accurate [12]. Among these techniques, the Perturbation and Observation (P&O) and the Incremental Conductance (InC) algorithms are the most common that have the advantage of easy implementation and known as traditional methods.
A. MPPT USING P&O
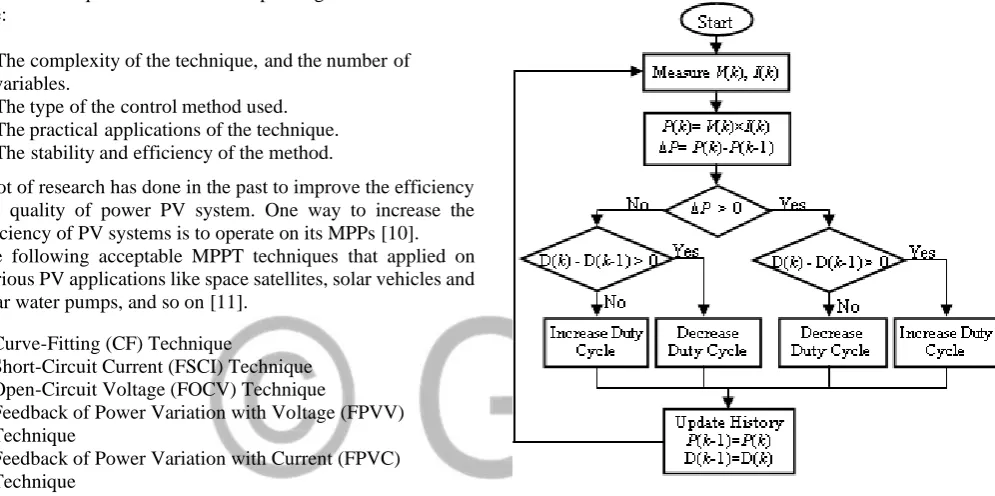
The P&O method is a simple method and can be run easily, so it's commonly used in PV applications. The P&O algorithm involves changing the operating point of the PV module by increasing or decreasing the cycle of the dc/dc converter to measure output power before and after the disruption. In this case, the amount of power converted from the panel is measured [12][13]. If this value is greater than the predetermined size, the voltage reference constant increases equally and if not decreases [13]. This process is stopped when the MPP is located. The P&O algorithm can be easily understood by studying the flow diagram shown in Figure 4.
Fig. 4. Flow chart of P&O algorithm.
Compares the proposed control p[k] and p[k-l], defines the operating point, whether the maximum curvature point of the PV is placed on the left or right side [4] [13] in Figure 3, Thus changing the work cycle.
B. MPPT USING InC
Incremental Conductance (InC) method uses the information of the output current and voltage of the PV system to find the desired operating point (MPP). With respect to Figure 3, the slope of the P-V curve is zero at maximum point [4] [6]. The relationship between dI/dV and I/V of the PV are as follows;
dP/dV=I+V dI/dV (2)
where,
dI/dV = -I/V , if the operating point is at MPP (3)
dI/dV > -I/V , if the operating point is at left of MPP (4)
The flow chart of the incremental conductance is shown in Figure 5.
Fig. 5. Flow chart of InC algorithm.
C. MPPT USING FLC
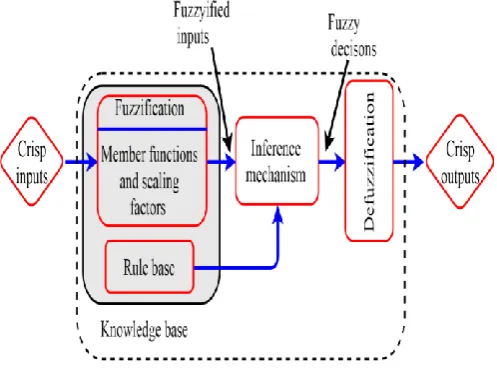
Fuzzy logic began in 1965 by Lotfi A. Zadeh, professor of electrical engineering and computer sciences at the University of California and Fuzzy logic controller (FLC) has been one of the best control strategies in the last decade for MPPT [14].FLC is stronger than a conventional nonlinear controller.Figure. 6 shows the basic structure of the typical FLC based MPPT controller.
Fig. 6. The structure of fuzzy logic controller.
FLC has two inputs, the Error E and the variation of the error (change of error) CE at sampled times k which are defined by:
E(K) = P(K) - P(K-1) / V(K) – V(K-1) (6)
CE(K) = E(K) – E(K-1) (7)
D(K) = D(K-1) + ∆D(K) (8)
Where P(K) and V(k) are the instant power and the voltage of the PV module, respectively. The output of the FLC is the duty cycle D(K). ∆D(K) is change in duty ratio which is used as the output of the FLC control to calculate the actual value of the D(K) of the DC/DC converter at sampling K. Fuzzy logic control operations can be divided into three basic elements, which are fuzzification, rule base, inference mechanism and defuzzification [9] [16].
1) Fuzzification
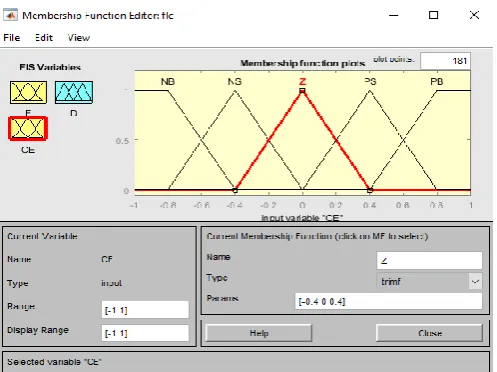
Membership functions for inputs and output are: NB (negative big), NS (negative small), Z (zero), PS (positive small), and PB (positive big). The partition of membership functions, which can adapt shape up to appropriate system, are shown in Figure 7, Figure 8 and Figure 9.
Fig. 8. The fuzzy member ship function for Change Error.
Fig. 9. The fuzzy member ship function for D.
2) Fuzzy Rules and Inference mechanism
The inference mechanism uses fuzzy rules to produce a suitable control signal (∆D). In this work, 25 fuzzy IF-THEN rules are used and the main idea of the rules is the location of the operating point of the MPP. If the operating point moves away from the MPP, the change in the duty ratio (∆D) will be increased or decreased largely and vice versa, if the operating point converges toward the MPP. The proposed fuzzy rules which are carried out by using Madani’s method are shown in Table II.
Table II. FLC RULES
CE
E NB NS Z PS PB
NB Z Z PB PB PB
NS Z Z PS PS PS
Z PS Z Z Z NS
PS NS NS NS Z Z
PB NB NB NB Z Z
3) Defuzzification
The center of gravity defuzzification method in a system of rules by formally given by:
n n
∆D =
∑[
∆Di * µ(∆Di)] /
∑
µ
(∆Di) (9)i=1 i=1
The output is denormalized by substituting it in (8), the actual duty ratio D(k) can be calculated. Figure 10 shows the FLC output surface using Matlab/Simulink simulation, which represents the relationship between the inputs (E, CE) and output (D) of the FLC used.
Fig. 10. Rule surface of FLC
The advantages of these controllers (FLC), working with imprecise inputs, not needing an accurate mathematical model and handling nonlinearity, are fast convergence and minimal oscillations around the MPP [14]. Furthermore, they have been shown to perform well under conditions of changing irradiance.
IV. SIMULATIONANDRESULTS
In the simulation results, the 100KW SPR-305-WHT solar PV of the parameters listed in Table I is modeled using Matlab M-file. The module is connected with a constant resistive load through a boost DC/DC converter with the MPPT controller. Figure 11 shows the MATLAB Simulink model of the proposed system. The MPPT control employs the MPP algorithms to locate the MPP continuously by adjusting the duty cycle in such a way as to verify the load matching and maximum power transfer.
The input of the amplifier is the output stream of the PV model and the voltage amplifier converter depends on the switching time of the IGBT switch. It is on and off by the pulse given by the controller. Compares the proposed control p[k] and p[k-l], defines the operating point, whether the maximum curvature point of the PV is placed on the left or right side [17] in Figure 3, Thus changing the work cycle. The signal builder block for the production of radiation signals was used to evaluate the performance of control.
Fig. 11. The PV system simulation in MATLAB/Simulink.
The three MPPT algorithms explained in section III are simulated and compared in terms of their dynamic (transient) and steady (stability) behaviors in tracking capability. The simulation is performed at rapidly variable irradiation (G) from 1000 W/m² to 200 W/m², assuming the PV temperature is kept constant at 25ºC, as shown in Figure. 12, Figure. 13 and Figure. 14 represent the responses to the power that can be achieved from the module using three tracking algorithms at the different atmospheric conditions.
Fig. 12. MPP tracking with a P&O under irradiation changes
from 1000 to 200 W/m2.
Fig. 14. MPP tracking with a FLC under irradiation changes
from 1000 to 200 W/m2.
For each MPPT technique and for each input, the energy supplied by the PV system was calculated over a time interval of 3s.
TABLE III. Measured Wasted Power of the MPPT.
The FLC technique tracks the MPP with high efficiencies as well as losing less energy.
In contrast, the P&O and the InC techniques have slow tracking on irradiation change and show significant loss of energy as seen in Table III. This leads to a severe drop in the power obtained from the PV array because the MPP is not tracked fast. On the other hand, traditional techniques do not succeed in tracking the MPP with high speed and high precision in rapid irradiation changes.
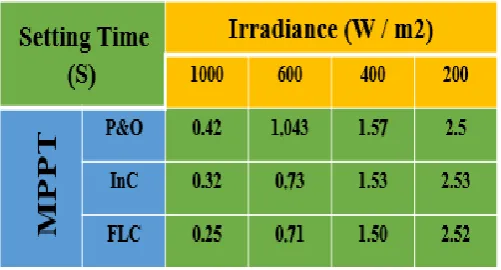
TABLE IV. Measured Setting Time of the MPPT.
It can be seen that the FLC reduces the response time of the PV system in different irradiation.
All these results confirm that FLC has excellent performance and show intelligent controllers can provide more accurate values than traditional controllers with some of the other benefits provided below:
1. Fuzzy logic provides quick response time with virtually no over-rhythm, better stability and more precise control.
2. The input and output limits can be divided into functional requirements and can be applied to different treatments.
3. Control rules can be added to cover important interactions between variables.
4. Suitable for rapid irradiance and temperature variations.
5. Supports multi-objective optimization. 6. Good for “noisy” environments.
7. The fluctuations in the steady state are considerably reduced.
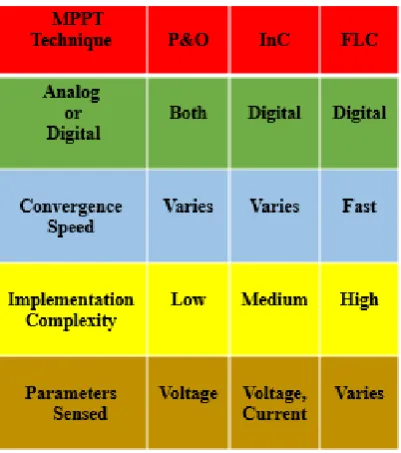
Table V. Major characteristics of MPPT techniques
The choice of the algorithm depends on the time complexity the algorithm takes to track the MPP, implementation cost and the ease of implementation. Among these techniques, the P&O and the InC algorithms are the most common and have an easy implementation.
V. CONCLUSION
The importance of using alternative energies, including solar energy, is needed for more research in the field of the development of efficient systems. The proposed method for solar energy systems, especially for isolated systems, is significant. It is very important to control a lot of power distribution and provide maximum power in a very unstable situation.
In order to improve the efficiency of PV systems, under different radiation, the intelligent control method was used to tracking the maximum power point in this work.
In this paper, a comparison of different Maximum Power Point Tracking (MPPT) techniques to obtain MPP in solar PV has been discussed with the irradiance change from 1000W/m2 to 200W/m2. All components of the PV system were modeled in Matlab/Simulink (PV module, Boost converter, P&O, InC and FL controllers).
P&O and InC methods are commonly used where low cost is a crucial factor. The Incremental Conductance (InC) MPPT method has a better steady-state response and slightly less oscillation than the P&O method, the oscillation of the operating point around MPP, leads to wastage of available power and decreases the PV module’s efficiency. The simulation results indicate that the proposed MPPT methods can put the operating point in MPP in different environmental conditions and show that the FLC had better performance and the energy taken from PV is greater when used with the FLC technique.
On the other hand, the tests confirmed fuzzy controller has an excellent performance than traditional methods under normal and varying atmospheric condition.
REFERENCES
[1] J. H. Jung and S. Ahmed, “Model construction of single crystalline Photovoltaic panels for real-time simulation,” 2010, pp. 342-349.
[2] V. M. Elena and Papadopoulou, “Photovoltaic industrial systems: An environmental approach,” Green Energy and Technology, Springer Heidelberg Dordrecht London New York, 2011.
[3] Marcelo Gradella Villalva, Jonas Rafael Gazoli and Ernesto Ruppert Filho (2009),”Comprehensive Approach to Modeling and Simulation of Photovoltaic Arrays”,IEEE Transactions On Power Electronics,Vol.24, No.5,pp 1198-1208.
[4] I. Hadj Mahammed, A. Hadj Arab, F. Youcef Ettoumi, S. Berrah, A. Boutelhig and Y. Bakelli,"A Comparative Study to Select a Mathematical Model for IV Characteristics Accuracy under Outdoor Conditions", sienr 2010 ghardaia.
[5] Chetan Singh Solanki," Solar Photo Voltaics ", PHI Learning pvt Ltd, 2009.
[6]M. El-yadri, R. Saadani, Li. Zorkani and M.Rahmoune,"Propre.Ma” Project: Modeling and simulation of Grid connected photovoltaic system for Meknes Climate",2nd International Renewable and Sustainable Energy Conference IRSEC14, Ouarzazate, Morocco – October 17-19, 2014
[7] S Geoff Walker, “Evaluating MPPT Converter Topologies using a MATLAB PV Model”.
[8] Karami, N.; Moubayed, N.; Outbib, R. General review and classification of different MPPT Techniques. Renew. Sustain. Energy Rev. 2017, 68,18.
[9] Ammar Ghalib Al-Gizi, Sarab Jwaid Al-Chlaihawi," Study of FLC Based MPPT in Comparison with P&O and InC for PV Systems",978-1-4673-9575- 5/16/ ©2016 IEEE [11] Youcef Soufi, Mohcene Bechouat, Sami Kahla,"
Maximum power point tracking using fuzzy logic control for photovoltaic system", 978-1-4799-0/14©2014IEEE [12]P. Lynn and Wiley, Electricity from the Sunlight , “An
Introduction to Photovoltaics, ” Sussex, U.K:, 2010. [13]International Energy Agency, "Key Word Energy
Statistics," International Energy Agency, 2016.
[14]E.D.Coyle and P.A.Simmons, "Understanding the Global Energy Crisis", Indiana: Prdue University Press, 2014. [15]Y. Hamakawa, “Recent advances in solar photovoltaic
technology and its new role for environmental issue,”
Renewable energy, vol. 5, no. 1, pp. 34–43, 1994.
[17]H. Ravaee, F. Saeid, and S. Faramarz, “Artificial neural network based model of photovoltaic thermal (pv/t) collector, ” Journal of Mathematics and Computer Science, vol. 4, no. 3, pp. 411–417, 2012.
[18]G. K. Singh, “Solar power generation by pv (photovoltaic) technology: A review, ” Energy, vol. 53, no. 1, pp. 1– 13,2013.