GSJ: Volume 6, Issue 2, February 2018, Online: ISSN 2320-9186
www.globalscientificjournal.comMITIGATION
OF
RAIN
ATTENUATION
IN
A
FIXED
WIRELESS
MICROWAVE
LINK
USING
AN
ADAPTIVE
TRANSMIT
POWER
CONTROL
(ATPC)
Dr. Omijeh .o. Bourdillon, Nwanekwu Johnfrancis
Key words: AGC,ATPC, BER, FMT, ITU-R, MTBF, NiMet, PIMT, PHIA, SNR, VSAT.
ABSTRACT
1.0 INTRODUCTION
The shortcoming of satellite communication comes from rainfall and an obstructed Line of
Sight (LOS). (Cheon-in oh, 2006) This rainfall becomes very high and prevalent in a
tropical country like Nigeria which have greater period of rainy/wet seasons (April to October) than dry seasons (November to March). The heavy occurrence of rainfall leads to degradation of microwave communication as the frequency of microwave increases beyond 10GHz. Communications operating at a frequency above 10GHz are susceptible to rain attenuations in the lower layer of the atmosphere because rainfall is the prevalent form of
attenuation at above 10GHz. (Yeo, Lee et al, 2011)
The attenuation becomes worse in the hot climate regions of the world like Nigeria which experiences higher rainfall rates and bigger water droplets due to the tropical climate.
(Marki, 2001). Rain attenuation affects the worth of analogue transmissions and increases the error rate of digital transmissions from the Nigcomsat-1r satellite to PHIA earth station. It led to an increase in power consumption of microwave systems, link unavailability, signal
interference and poor quality of services (QoS).
However, a mitigation approach involving the use of ATPC was built by engineers and adopted in compensating for the rain fades in the channel of communication. ATPC when installed in Nigcomsat-1r satellite systems and PHIA earth station systems will reduce the Bit Error Rate (BER), increase the link availability, Signal to Noise Ratio (SNR) and reduces the power consumption of the microwave stations. It carries this out by temporarily increasing the transmitter output power during rainy conditions or reducing the noise level of the receiver. In the absence of no rainfall, the ATPC reduces the transmitter output power to a nominal power that will be used for transmission between Nigcomsat-1r satellite and PHIA earth station. The ATPC does the aforementioned task automatically without the help of satellite operators to cater for rainy and clear sky conditions to promote the reliability, availability and the quality of the link.
2.1 Adaptive Transmit Power Control (ATPC)
ATPC is a feedback control system that temporarily increases the transmitter output power of a satellite system during rainy conditions to reduce the outcomes of atmospheric impairments of rain, fog, precipitation and decreases the output power of a transmitter to a nominal power during non-rainy conditions. The ATPC is an automatic system that requires no satellite operator to operate it. ATPC has reduced the average power consumed, extended the mean time between fades (MTBF), eliminated the upfade problems in the receivers and enhances the performance outages caused by co-channel interference. With the usage of ATPC in communication system, BER has being reduced in addition with the receiver noise while the SNR has being increased to a greater extent.
Fig1: Structure of an ATPC
The figure above shows the structure of an ATPC which consists of a signal generator, programmable attenuator, spectrum analyzer and driver circuit. When the received power level falls below the threshold it is indicated by the AGC level and the driver circuit produces the control signal for the gain margin. The attenuator programmed has an attenuation that is
decreased so that the transmit output power will be increased.
2.2 Nigcomsat-1r Satellite Network
Nigcomsat-1r is a geostationary satellite operator and service providers considered leading in
Africa. It is an enhancement of the Nigcomsat-1 that was de-orbited on the 10th of November,
2008 as a result of the malfunctioning of the Solar Array Deployment Assembly (SADAR).
Nigcomsat-1r is positioned at 42oE (42.5oE) comprising of 7 antennas and 28 active
transponders which are reliable for the stronger and centre beams of the African European and Asian continent.
2.3 Port Harcourt International Airport (PHIA) Earth Station
In Nigeria, the satellite communication network comprises of 8 earth stations installed in Lagos, Kano, Abuja, Port Harcourt, Ilorin, Jos, Sokoto and Maiduguri. Kano and Lagos constitutes the hub stations whereas the other 6 stations in which Port Harcourt falls into are the remote nodes. PHIA earth station, Omagwa is a VSAT remote node that is deployed by the Airline for hotline voice communication between Air Traffic Controller and
Air-to-Ground (RCAG) extended range VHF radio communication system. (NAMA, 2014). PHIA
earth station has a longitude of 6.950289oE, 29.0m height above the sea level, 37182.87 km
2.0 METHODOLOGY
The methodology for the research of this paper is in stages of collection of rainfall readings for a period of five (5) years from NiMet, mathematical modelling of rain attenuation and simulation.
The methodology of achieving the set objectives is set out in the sequence of events listed below:
i. Selecting Port Harcourt region as my case study when choosing the microwave
links of Nigcomsat-1r satellite and PHIA earth station.
ii. Obtaining the monthly rainfall amount of 0.01% distribution for a time of 5 years
beginning from 2012 to 2016 from NiMet.
iii. Modelling of the rain attenuation
iv. The model of an ATPC fixed wireless link
MathlabTM software was the simulink tool used in implementing this methodology.
3.1 Selecting the Microwave Link as the Case Study
Nigcomsat-1r (42.50E) is the satellite used in the orbit. It uses a frequency beyond 10GHz
and a Ka-band EIRP of 58dBW. The transmit antenna gain is17dB/K for its Ka-band. The
VSAT terminal at PHIA was used as the receiving terminal. It has a longitude of 6.950289OE,
height above the sea level of 29.0m and 37182.87km distance from the satellite. PHIA has an
angle of elevation of 48.38o, azimuth of 96.97o and latitude of 4.43. Port Harcourt was used
as the case study in this work for the reason of its high rain rate, bigger rain drops and precipitation rate. Port Harcourt rainfall is considered as a convective type.
3.2 Obtaining the Monthly Rainfall Amount of Five (5) Years from NiMet
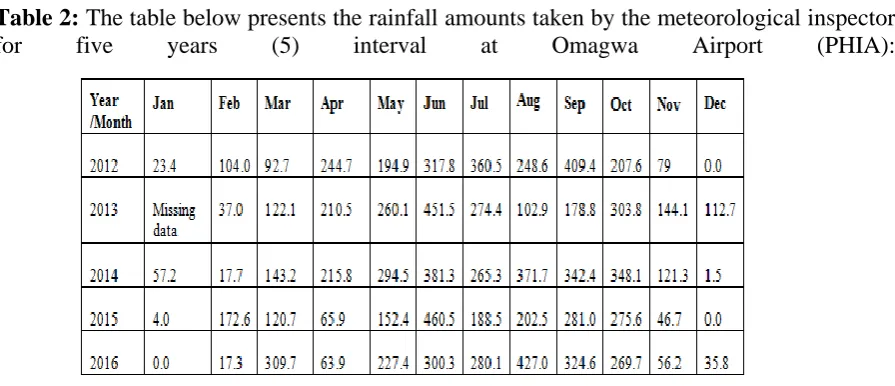
Table 2: The table below presents the rainfall amounts taken by the meteorological inspector
for five years (5) interval at Omagwa Airport (PHIA):
3.3 Mathematical Modelling Of the Rain Attenuation
The modelling employed in this work is the ITU-R model. The ITU-R model was used for the reason of it been verifiable and provides reliability and conformity when compared to other models. It also provides the most précised statistical estimate of attenuation on slant paths. This model employs the following climatic parameters like:
I. Average year of point rainfall rate for 0.01% (R0.01) in mm/hr.
II. The height above sea level of the earth (H) in km
III. Elevation angle (ɵ) in degrees
IV. The latitude and longitude of the earth station in degrees
V. Frequency (f) of operation (GHz) in gigahertz
VI. The effective radius of the earth (Re) in km
The rain attenuation Cumulative Distribution Frequency (CDF) is computed as follows using the step by step procedures shown below:
1st Step
1
Where
is the freezing height in km
is the 0oc isotherm height above mean sea level in km
2nd step
2
Where
is the slant path length below the rain height in (km) is the freezing height during rain in km
is the earth station altitude above sea level
is the elevation angle between the slant path and the horizontal projections in degrees.
3rd step
3
Where
is the horizontal projection of slant path length in km. is the slant path length (km)
is the elevation angle between the slant path and the horizontal projections in degrees.
4th step
Obtaining of the R0.01 point rainfall rate surpassed for 0.01% of an average year rain rate data
5th step
γ0.01 = kR0.01 α 4
Where
γ0.01 is the specific attenuation for 0.01% of time in dB/km
R0.01 is the rain rate exceeded for 0.01% in mm/hr
K and α are the coefficients depended on frequency for computing specific attenuation provided from ITU-R p. 838-3
6th step
√ ( ) 5
Where
ϒk0.01 is the horizontally adjusted reduction factor of the path
f is the operating frequency in GHz
Therefore, the horizontally adjusted slant path is computed by
for ρ˃ɵ 6 Otherwise
for ρ≤ɵ 7
Where
⁄ 8
7th step
√ * ( )√ +
9
Where
is the vertical reduction factor for 0.01% of time f is the operating frequency
And
σ = 36- /ϕ/, for /ϕ˂36o or σ = 0, for
/ϕ/≥36o 10
8th step
Leff = Lh0.o1 ϒv0.01 11
Where
Lk0.01 is the horizontally adjusted slant-path
ϒv0.01 is the reduction factor vertically
Therefore, the forecasted slant path attenuation surpassed for 0.01% of an regular year is
A0.01=γ0.01 Leff 12
The predicted attenuation exceeded for other percentages % ρ of an average year may be
provided from the value of A0.01 by making using the extrapolations (ITU-R, 2009)
Aρ%= A0.01(p/0.01)-[0.655+0.33lnp-0.045lnA0.01-zsinɵ(1-p)] 13
Where p connotes the percentage probability of interest and z is considered as
For
p≥1.0%, z=0 14
For p˂1.0%, z={ 0; for / ϕ/≥36
o
{ z = -0.005(/ϕ – 36/)+1.8-4.25sinɵ, for ɵ˂25
oand /ϕ/˂36
o{ z= -0.005(/ϕ-36/)+1.8-4.25 sinɵ, for ɵ˂25
oand / ϕ/˂36
o15
3.4
Mathematical modelling of the ATPC
The ATPC algorithm is a method of computing the transmitter gain factor GT required at the transmitter end of a link in other to reach a desired average power at the receiver end.
The rain attenuation factor G is a factor that is computed from the rain attenuation A (in dB) as follows:
The transmission gain factor GTx at the transmitter is initially set equal to 1 (this correspond
to a value of 0dB in power increase) and is modified periodically by the ATPC control loop based on the average received power. The average received power is available at the output of a digital narrowband low pass filter. Let Pr[n] denote the estimated average received power. Based on the value Pr[n], the ATPC algorithm computes a power step.
Where g() denotes a non-linear function which is which is essentially the combination of a dead zone and a two-level quantizer.
The parameters of this non-linear function depend on pre-specified power steps that are used to increase or decrease power at the transmitter.
The ATPC algorithm then proceeds to compute the value of the new required transmitter power as follows:
The value needs to be saturated in order not to exceed the maximum allowable transmit power. In the ATPC model, the algorithm has a 30dB range, with the minimum transmitted power set to 1 (0dB) and the maximum transmitted power equal to 1000 (30dB). Finally the
4.0 RESULTS AND DISCUSSIONS
4.1 Results and Discussions
The simulation methods used in this thesis work is predominantly MatLab simulink. It is the software used for carrying out the computations and the plotting of the predicted rain attenuation, slant-path attenuation, rain rate and the slant path length. When run, the individual subsystems each are executed producing results that are combined to give a desired end result.
Fig.2: A graph of the slant-path attenuation predicted (dB) against year.
The figure above depicts the predicted slant-path attenuation against a period of five (5) years beginning from 2012 to 2016. From the representation, the predicted slant-path attenuation was at its peak value between 8.55dB and 8.6dB during the year 2014. The slant-path attenuation experienced is in the year 2015 giving a value between 8.3dB and 8.35dB. It was increased in the year 2012 with value between 8.45 to 8.5dB and then reduced in the year 2013 between 8.4 to 8.45dB.
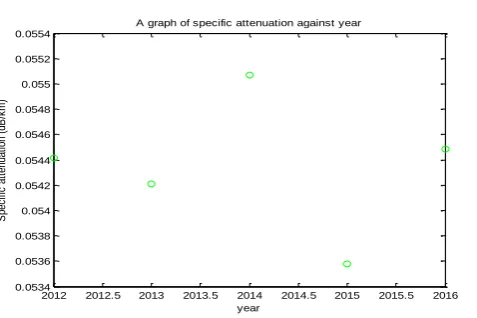
Figure 3: A graph of the specific attenuation (dB/km) against year
The figure above shows the graph of specific attenuation (dB/km) against year. From the representation, the specific attenuation was highest in 2014 with a value slightly above 0.055dB/km. It had its lowest value of 0.0536dB/km in the year 2015 while specific attenuation of 2016 was slightly greater than the attenuation of 0.0544dB/km for the year 2012.
2012 2012.5 2013 2013.5 2014 2014.5 2015 2015.5 2016 8.3 8.35 8.4 8.45 8.5 8.55
8.6x 10
-4 year P re di ct ed s la nt -p at h at te nu at io n (d B )
A graph of predicted slant-path attenuation against year
2012 2012.5 2013 2013.5 2014 2014.5 2015 2015.5 2016 0.0534 0.0536 0.0538 0.054 0.0542 0.0544 0.0546 0.0548 0.055 0.0552 0.0554 year S pe ci fic a tt en ua tio n (d B /k m )
Figure 4: A graph of the predicted attenuation predicted against year
The figure above shows the graph of predicted attenuation against a period beginning from 2012 to 2016. The attenuation predicted is at its peak in 2014 between predicted attenuations of 8.55 and 8.6 whereas it fell in 2015 between predicted attenuations of 8.3 to 8.35. The graph of figure 3, 4 and 5 shows that the slant path attenuation, specific attenuation and the predicted attenuation all increased to its peak in the year 2014 and reduced drastically to its minimum in 2015. This shows that 2015 had the worst attenuation on signals transmitted via satellite system posing greater harm to radio wave communication than in 2015.
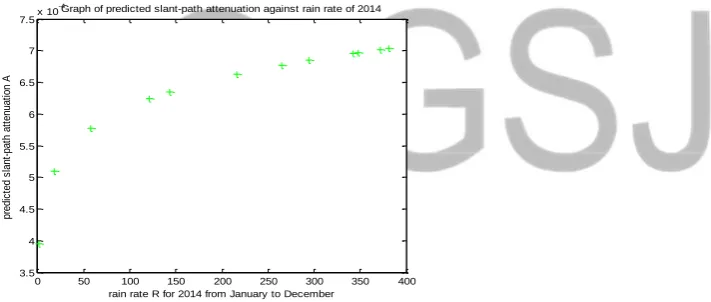
Figure 5: A graph of predicted slant-path attenuation against the rain rate of 2014.
The graph above shows the predicted slant-path attenuation against the rainfall rates of 2014 which is characterized by the highest forecasted slant-path attenuation. In the graph of figure 4.3, a peak slant-path attenuation of 7dB in the month of October was represented and a lowest slant path attenuation of about 4.5dB was obtained proving correctly the rainfall data collated by NiMet which had the month of October experience the highest rainfall rate of 348.1 in 2014. Therefore, the slant path attenuation increases as the rainfall rate increases.
2012 2012.5 2013 2013.5 2014 2014.5 2015 2015.5 2016 8.3 8.35 8.4 8.45 8.5 8.55
8.6x 10
-4 year P re d ic te d a tt e n u a tio n
A graph of Predicted attenuation against year
0 50 100 150 200 250 300 350 400 3.5 4 4.5 5 5.5 6 6.5 7 7.5x 10
-4Graph of predicted slant-path attenuation against rain rate of 2014
p re d ic te d s la n t-p a th a tt e n u a ti o n A
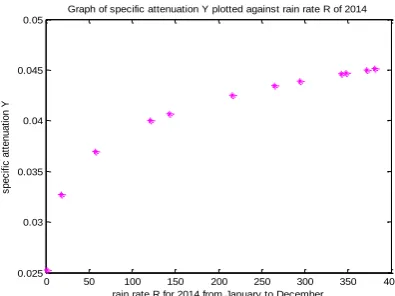
Figure 6: A graph of specific attenuation Y (dB/km) plotted against the rain rate of 2014.
The graph above shows the specific attenuation Y plotted against the rain rate of 2014 from January to December. From the graph, the specific attenuation was lowest at 0.025dB/km in January 2014 and highest at a value of 0.045dB/km in the month of October. Therefore, the specific attenuation increases as the rain rate of 2014 increases.
4.2
Mitigation Effects of ATPC
The mitigation effect of the ATPC was evidenced from the graph of the average transmitter power Pt plotted against the predicted slant-path attenuation for 2014 shown below. The transmitter output power was increased for the ATPC to mitigate the predicted slant-path attenuation.
Figure 7: A graph of the average transmitter power Pt plotted against slant path attenuation for 2014.
The graph above shows the average transmitter power Pt plotted against slant path attenuation for the year 2014. Here, the ATPC mitigates the slant path attenuation to a minimal level as the transmitter power is increased during rainy conditions.
0 50 100 150 200 250 300 350 400 0.025
0.03 0.035 0.04 0.045 0.05
Graph of specific attenuation Y plotted against rain rate R of 2014
s
p
e
c
if
ic
a
tt
e
n
u
a
ti
o
n
Y
rain rate R for 2014 from January to December
3.5 4 4.5 5 5.5 6 6.5 7
50 100 150 200 250 300 350 400
A graph of average transmitter power Pt plotted against predicted slant-path attenuation A for 2014
av
er
ag
e
tr
an
sm
itt
er
p
ow
er
P
t
Figure 8: A graph of the Gain plotted against the predicted slant path attenuation for the year 2014.
The graph above shows the Gain plotted against the predicted slant-path attenuation for the year 2014. From the graph, the ATPC reduces the slant-path attenuation to a minimal level to level that will require the efficient transmission of signals. Months like October, and November characterized by heavy precipitations are considered better for signal propagation.
Figure 9: A graph of the average transmitter power Pt plotted against the specific attenuation of 2014.
The graph above shows the average transmitter power Pt plotted against specific attenuation for 2014. From the graph, the specific attenuation was mitigated as the average power of the transmitter is increased during rainy conditions.
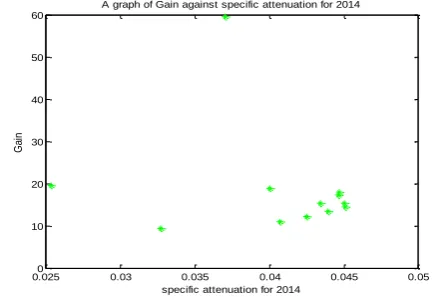
Figure 10: A graph of the Gain plotted against the specific attenuation for 2014.
The graph above shows the Gain plotted against the specific attenuation for 2014. From the graph, the specific attenuation was mitigated to obtain a considerable gain required for signal
3.5 4 4.5 5 5.5 6 6.5 7
0 10 20 30 40 50 60
A graph of Gain plotted against the slant path attenuation for 2014
G
a
in
slant-path attenuation for 2014
0.025 0.03 0.035 0.04 0.045 0.05 50
100 150 200 250 300 350 400
A graph of average power of the transmitter plotted against the specific attenuation for 2014
av
er
ag
e
tr
an
sm
itt
er
p
ow
er
P
t
specific attenuation for 2014
0.0250 0.03 0.035 0.04 0.045 0.05 10
20 30 40 50 60
G
a
in
propagation. Here, the ATPC mitigates the precipitation agents of rainfall which distorts the propagation path and signals.
From the results of the graphs plotted it showed that the year 2014 among other years (2012-2016) produced the highest predicted slant-path attenuation, specific attenuation and predicted attenuation whereas the year 2015 produced the lowest attenuation. The adoption of the ATPC in the signals propagated during rainfall showed a drastically improvement as the ATPC mitigated the specific attenuation and slant-path attenuation for the year 2014 which was considered to be the worst year of rainfall for Port Harcourt region according to the NiMet rain data. Furthermore, the gain at the transmitter reduced both attenuation for the same year enabling the efficient propagation of signals during rainy conditions.
4.0CONCLUSION
The mitigation of attenuation in a stationary wireless link (Nigcomsat-1r and VSAT earth station in PHIA) using ATPC was a huge success because from the graphs plotted, it was seen that the forecasted slant-path attenuation, the specific attenuation and the forecasted attenuation were highest in 2014 and smallest in 2015. The attenuation of the slant path increases as the rainfall rate increases and reduces as it reduces while the rainfall rate increases as the synoptic hours increases. This means that rain attenuation whether predicted or measured degrades the value of our signals in its entirety and tends to be reduced to the barest minimum when the ATPC is added in the microwave links thus enhancing better signal quality during wet and dry conditions. With the adoption of ATPC, a cost effective way of eliminating the attenuation caused by rainfall has been provided thus eliminating the complexity and complications of the links to provide link availability and reduction of power consumption.
ACKNOWLEDGEMENT
Dr Omijeh O. Bourdillon and Nwanekwu Johnfrancis (M.ENG) wishes to thank their family for contributing enormously to this project in making it a success and we want to in a special way thank the University of Port Harcourt for providing the enabling environment for this work.
REFERENCE
1. Assis, M.S., and C. M. Einloft (1977), A simple method of estimating rain attenuation
distributions, paper presented at Open Symposium, Union Radio Science International La Baule, France.
2. Cheon-in oh et al (2006), “Analysis of the Rain fading channel and the system
Applying MIMO”, IEEE Journal (ISCIT 2006), pp.507-210.
3. Crane, R.K. (1980), Prediction of attenuation by rain, IEEE Trans. Commun., 28,
1717-1733, doi:10.1109/TCIM. 1980.1094844.
4. Dissanayake et al (October 1997),‟A Prediction Model that Combines Rain
5. Garcia-Lopez, J.A., J.M. Hernando, and J. M. Selga (1988), Simple rain attenuation prediction method for satellite radio links, IEEE Trans. Antenna Propag., 36, 444-448,
doi: 10.1109/8. 192129. CrossRef/ Web of Science (R) Times Cited: 10/ADS.
6. Harris, R.A (2002), COST 255 final report: Radiowave Propagation Modelling for
Satcom Services at Ku-band and above report, ESA publication Div., Noordwijk, Netherlands.
7. ITU-R p.618-10(2009),‟ propagation data and prediction methods required for the
design of Earth-space telecommunication Systems”, pp.6-9.
8. Maki M. et al (2001),‟ Characteristics of the raindrop size Distribution in Tropical
Continental square lines Observed in Darwin, Australia”, Journal of Applied Meterology, pp.1393-1412.
9. Mandeep, J.S. and K Tanaka (2007),‟Effects of atmospheric parameters on satellite
link,” Int. Journal of Infrared Millimeter Waves, Vol.28, pp. 789-795.
10.NAMAhttp://www.nama.gov.ng/load.php.pg = electrocomms.
11 NIGCOMSAT (2017): Nigcomsat-1R www.nigcomsat.gov.ng/fleet.php.
11.Ramachandran, V., and V. Kumar (2006), Modified rain attenuation model for
tropical regions for Ku-band signals, Int. J. Satellite Communication Network, 25,
53-67, doi: 10. 1002/sat.846 Wiley Online Library (Web of Sciences (R) Times Cited 3).
12.Stutzman W.L. and K.M. Yon (1986),‟ A Simple Rain Attenuation Model for