https://doi.org/10.5194/amt-11-459-2018 © Author(s) 2018. This work is distributed under the Creative Commons Attribution 3.0 License.
Absolute, pressure-dependent validation of a calibration-free,
airborne laser hygrometer transfer standard (SEALDH-II) from
5 to 1200 ppmv using a metrological humidity generator
Bernhard Buchholz1,2,aand Volker Ebert1,2,3
1Physikalisch-Technische Bundesanstalt Braunschweig, Braunschweig, Germany 2Physikalisch Chemisches Institut, Universität Heidelberg, Heidelberg, Germany 3Center of Smart Interfaces, Technische Universität Darmstadt, Darmstadt, Germany
acurrently at: Department of Civil and Environmental Engineering, Princeton University, Princeton, USA
Correspondence:Volker Ebert ([email protected])
Received: 21 December 2016 – Discussion started: 23 February 2017
Revised: 8 November 2017 – Accepted: 4 December 2017 – Published: 23 January 2018
Abstract.Highly accurate water vapor measurements are in-dispensable for understanding a variety of scientific ques-tions as well as industrial processes. While in metrology water vapor concentrations can be defined, generated, and measured with relative uncertainties in the single percentage range, field-deployable airborne instruments deviate even un-der quasistatic laboratory conditions up to 10–20 %. The novel SEALDH-II hygrometer, a calibration-free, tuneable diode laser spectrometer, bridges this gap by implementing a new holistic concept to achieve higher accuracy levels in the field. We present in this paper the absolute validation of SEALDH-II at a traceable humidity generator during 23 days of permanent operation at 15 different H2O mole fraction
levels between 5 and 1200 ppmv. At each mole fraction level, we studied the pressure dependence at six different gas pres-sures between 65 and 950 hPa. Further, we describe the setup for this metrological validation, the challenges to overcome when assessing water vapor measurements on a high accu-racy level, and the comparison results. With this validation, SEALDH-II is the first airborne, metrologically validated hu-midity transfer standard which links several scientific air-borne and laboratory measurement campaigns to the inter-national metrological water vapor scale.
1 Introduction
Water vapor affects, like no other substance, nearly all atmo-spheric processes (Ludlam, 1980; Möller et al., 2011; Ravis-hankara, 2012). Water vapor not only represents a large direct feedback to global warming when forming clouds but also plays a major role in atmospheric chemistry (Held and So-den, 2000; Kiehl and Trenberth, 1997). Changes in the water distribution, as vapor or in condensed phases (e.g., in clouds), have a large impact on the radiation balance of the atmo-sphere. This is the reason that water vapor is often mentioned as the most important greenhouse gas and one of the most important parameters in climate research (Maycock et al., 2011). Water vapor measurements are often needed for other in situ atmospheric analyzers to correct for their water va-por cross interference. The high (spatial and temva-poral) vari-ability of atmospheric water vapor, its large dynamic range (typically 3–40 000 ppmv1), and its broad spectroscopic fin-gerprint typically require complex multidimensional tions, in particular for spectroscopic sensors. These calibra-tions often embrace the water vapor content of the gas flow to be analyzed as one of the key calibration parameters even
1SEALDH-II native unit for H
2O concentration measurement is
when the instrument (e.g., for CO2)is not intended to
mea-sure water vapor at all.
In particular for field weather stations, water vapor analyz-ers often are seen as part of the standard instrumentation in atmospheric research. This seems reasonable due to several reasons: slow H2O mole fraction change over hours, the
typ-ical mid-range humidity levels (approx. above 5000 ppmv), no significant gas pressure or temperature change, target ac-curacy often only on the order of 5–15 % relative devia-tion, and the absence of “non-typical atmospheric compo-nents” such as soot or hydrophobic substances. Water va-por measurements under these conditions can be performed by a variety of different devices (Wiederhold, 1997): capaci-tive polymer sensors (e.g., Salasmaa and Kostamo, 1986) are frequently deployed in low-cost (field) applications. Small-scale-produced, commercially available spectral absorption devices (e.g., Petersen et al., 2010) are often used in re-search campaigns. Dew- and frost-point mirror hygrometers (D/FPH) are known for their high accuracy. However, this is only true if they are regularly calibrated at high-accuracy (transfer) standards in specialized hygrometry laboratories such as in metrology institutes (Heinonen et al., 2012).
As soon as hygrometers have to be deployed in harsh envi-ronments (e.g., on airborne platforms), this situation changes entirely: the ambient gas pressure (10–1000 hPa) and gas temperature (−90–40◦C) ranges are large and both values change rapidly; the required H2O measurement range is set
by the ambient atmosphere (typically 3–40 000 ppmv); me-chanical stress and vibrations occur; and the sampled air contains additional substances from condensed water (ice, droplets), particles, or even aircraft fuel vapor (e.g., on ground). These and other impacts complicate reliable, ac-curate, long-term stable H2O measurements and briefly
out-line why water vapor measurements remain difficult in situ measurements in the field, even if they are nearly always needed in atmospheric science. Usually, the availability and coverage of observations limit model validation studies in the first place but also the lack of sufficient accuracy may have limited important scientific interpretations (Krämer et al., 2009; Peter et al., 2006; Scherer et al., 2008; Sherwood et al., 2014).
Over the last decades, numerous hygrometers were devel-oped and deployed on aircraft (Busen and Buck, 1995; Cerni, 1994; Desjardins et al., 1989; Diskin et al., 2002; Durry et al., 2008; Ebert et al., 2000; Gurlit et al., 2005; Hansford et al., 2006; Helten et al., 1998; Hunsmann et al., 2008; Karpechko et al., 2014; Kley and Stone, 1978; May, 1998; Meyer et al., 2015; Ohtaki and Matsui, 1982; Roths and Busen, 1996; Salasmaa and Kostamo, 1986; Schiff et al., 1994; Silver and Hovde, 1994b, a; Thornberry et al., 2015; Webster et al., 2004; Zöger et al., 1999a, b) (non-exhaustive list). While for some atmospheric questions the quality level of the data often is sufficient (e.g., typically climatologies), there are also a variety of questions, especially validation of atmo-spheric models, where the required absolute accuracy,
preci-sion, temporal resolution, long-term stability, comparability, etc. needs to be higher. These problems can be grouped into two major categories: accuracy-linked problems and time-response-linked problems. The latter is particularly impor-tant for investigations in heterogeneous regions in the lower troposphere as well as for investigations in clouds. In these regions, even two on average agreeing instruments with dif-ferent response times yield local, large, relative deviations on the order of up to 30 % (Smit et al., 2014). It is important to keep in mind that the total time response of a system is a superposition of the time response components of the instru-ment itself as well as of the sampling inlet. These typically depend on numerous parameters like the type of inlet, inlet pipe length, pipe coating, pipe temperature, pipe heating, gas flow, and input air humidity level.
In contrast to time response studies, accuracy-linked prob-lems in flight are difficult to isolate since they are always covered by the spatial variability (which leads to temporal variability for moving aircraft) of atmospheric H2O
distribu-tion. Comparing hygrometers in flight, such as in Rollins et al. (2014), does not facilitate a clear accuracy assessment.
Therefore, in 2007 an international intercomparison ex-ercise named AquaVIT (Fahey et al., 2014) was carried out to compare airborne hygrometers under quasistatic, laboratory-like conditions for upper-tropospheric and lower-stratospheric humidity levels. AquaVIT (Fahey et al., 2014) encompassed 22 instruments from 17 international research groups. The instruments were categorized in well-validated, oft-deployed “core” instruments (APicT, FISH, FLASH, HWV, JLH, CFH) and “younger” non-core instruments. AquaVIT revealed, in the important 1 to 150 ppmv H2O
electron-ics and mechanelectron-ics and for the deviating ambient operation temperature from the ambient validation temperature (hangar vs. laboratory). Even more prone to deviations are calibra-tion sources installed inside the aircraft due to changing am-bient conditions such as cabin temperature, cabin pressure, and orientation angle of instrument (important if liquids are used for heating or cooling). Second, the gas stream with a highly defined amount of water vapor has to be conveyed into the instrument. Especially for water vapor, which is a strongly polar molecule, this gas transport can become a crit-ical step. Changing from high to low concentrations or even just changing the gas pressure or pipe temperature can lead to signal creep due to slow adsorption and desorption processes, which can take long to equilibrate. In metrology, this issue is solved by a long validation and calibration time (hours up to weeks, depending on the H2O mole fraction level), a
genera-tor without any connecgenera-tors or fittings (everything is welded), and piping made out of electropolished stainless steel to en-sure that the equilibrium is established before the actual cali-bration process is started. However, this calicali-bration approach is difficult to deploy and maintain for aircraft and field op-erations due to the strong atmospheric variations in gas pres-sure and H2O mole fraction, which usually leads to a
multidi-mensional calibration pattern (H2O mole fraction, gas
pres-sure, sometimes also gas temperature) in a short amount of calibration time (hours). Highly sensitive, frequently flown hygrometers like Zöger et al. (1999b) are, by their physical principle, not as long-term stable as it would be necessary to take advantage of a long calibration session. Besides the time issue to reach a H2O equilibrium between source and
instrument, most calibration principles for water vapor are influenced by further issues. A prominent example is the sat-uration of air in dilution- and satsat-uration-based water vapor generators: gas temperature and pressure defines the satura-tion level (described, e.g., by Sonntag’s equasatura-tion; Rollins et al., 2014); however, it is well-known that 100.0 % saturation is not easily achievable. This might be one of the impact fac-tors for a systematic offset during calibrations in the field. The metrology community solves this for high humidity lev-els with large, multistep saturation chambers which decrease the temperature step-wise to force the water vapor to con-dense in every following step. These few examples of typ-ical field-related problems show that there is a reasonable doubt that deviations in field situations are norm-distributed. Hence, the mean during AquaVIT might be biased, i.e., not the correct H2O value.
The instruments by themselves might actually be more accurate than AquaVIT showed, but deficiencies of the dif-ferent calibration procedures (with their difdif-ferent calibration sources etc.) might mask this. To summarize, AquaVIT doc-umented a span of up to 20 % relative deviation between the world’s best airborne hygrometers – but AquaVIT could nei-ther assess absolute deviations nor explain them, since a link to a metrological H2O primary standard (i.e., the definition
of the international water vapor scale) was missing.
Aqua-VIT focused primarily on the stratospheric H2O range (from
0 to 150 ppmv) whereas the Selective Extractive Airborne Laser Diode Hygrometer (SEALDH-II) is a wide-range in-strument (3–40 000 ppmv). It is nevertheless evident that the large overlap region (from 5 to 150 ppmv) among our val-idation, AquaVIT’s, and SEALDH-II’s concentration range will allow us to infer new and sustainable statements from our validation results.
Therefore, we present in this paper the first comparison of an airborne hygrometer (SEALDH-II) with a metrologi-cal standard for the atmospheric relevant gas pressure (65– 950 hPa) and H2O mole fraction range (5–1200 ppmv). We
will discuss the validation setup, procedure, and results. Based on this validation, SEALDH-II is by definition the first airborne transfer standard for water vapor which links labo-ratory and field campaigns directly to metrological standards.
2 SEALDH-II
2.1 System description
This paper focuses on the metrological accuracy validation of the SEALDH-II. SEALDH-II is the airborne successor of the proof-of-concept spectrometer (SEALDH-I) study published in Buchholz et al. (2014), which showed the possibility and the achievable accuracy level for calibration-free dTDLAS hygrometry. The publication (Buchholz et al., 2014) demon-strates this for the 600 to 20 000 ppmv range at standard ambient pressure. The instruments SEALDH-I, SEALDH-II, and HAI (Buchholz et al., 2017) are all built with the design philosophy that every single reported value of the instrument should have a “related boundary/operation condition snap shot”, allowing us to exclude the possibility of any instru-mental malfunction during the measurement. SEALDH-II is from this perspective the most extensive approach (capturing much more boundary condition data; Buchholz et al., 2016), while HAI can serve as a multichannel, multiphase hygrom-eter for a broader variety of scientific questions.
temperature exchanger, multiple temperature sensors, a flow regulator, and two gas pressure sensors.
Approximately 80 different instrument parameters are controlled, measured, or corrected by SEALDH-II at any time to provide an almost complete supervision and detection of the spectrometer status – we termed this concept “holis-tic dTDLAS spectroscopy”. This extensive set of monitoring data ensures reliable and well-characterized measurement data at any time. The knowledge about the instruments status strongly facilitates metrological uncertainties calculations. SEALDH-II’s calculated linear part of the measurement un-certainty is 4.3 %, with an additional offset unun-certainty of ±3 ppmv (further details in Buchholz et al., 2016). The pre-cision of SEADLH-II was determined via the Allan variance approach and yielded 0.19 ppmv (0.17 ppmv×m×Hz−1/2) at 7 Hz repetition rate and an ideal precision of 0.056 ppmv (0.125 ppmv×m×Hz−1/2) at 0.4 Hz. In general,
SEALDH-II’s time response is limited by the gas flow through the White-type multi-pass measurement cell with a volume of 300 mL. With the assumption of a bulk flow of 7 SLM at 200 hPa through the cell, the gas exchange time is 0.5 s.
SEALDH-II’s measurement range covers 3–40 000 ppmv. The calculated mixture fraction offset uncertainty of ±3 ppmv defines the lower detection limit. This offset uncer-tainty by itself is entirely driven by the capability of detecting and minimizing parasitic water vapor absorption. The con-cept, working principle, and its limits are described in Buch-holz and Ebert (2014). The upper limit of 40 000 ppmv is de-fined by the lowest internal instrument temperature, which has to always be higher than the dew-point temperature to avoid any internal condensation. From a spectroscopic per-spective, SEALDH-II could handle mole fractions up to ap-prox. 100 000 ppmv before spectroscopic problems like satu-ration limit the accuracy and increase the relative uncertainty beyond 4.3 %.
2.2 Calibration-free evaluation approach
SEALDH-II’s data treatment works differently from nearly all other published TDLAS spectrometers. Typically, instru-ments are set up in a way that they measure the absorbance or a derivative measurand of absorbance and link it to the H2O
mole fraction. This correlation together with a few assump-tions about long-term stability, cross interference, gas tem-perature dependence, and gas pressure dependence is enough to calibrate a system (Muecke et al., 1994). In contrast, a calibration-free approach requires a fully featured physical model describing the absorption process entirely. The follow-ing description is a brief overview; for more details see, e.g., Buchholz et al. (2014, 2016), Ebert and Wolfrum (1994), and Schulz et al. (2007).
In a very simplified way, our physical absorption model uses theextendedLambert–Beer Eq. (1), which describes the relationship between the initial light intensity I0(λ) before
the absorption path (typically being in the few mW range)
and the transmitted light intensityI (λ).
I (λ)=E (t )+I0(λ)·Tr(t )·exp
−S (T )·g (λ−λ0)
·N·L] (1)
The parameter S(T ) describes the line strength of the se-lected molecular transition. In SEADLH-II’s case, the spec-troscopic multi-line fit takes into account 19 transition lines in the vicinity of the target line at 1370 nm (energy levels: 110–211; rotation–vibrational combination band). The other parameters are the line shape functiong(λ−λ0), the absorber
number densityN, the optical path lengthL, corrections for light-type background radiationE(t ), and broadband trans-mission losses Tr(t).
Equation (1) can be enhanced with the ideal gas law to calculate the H2O volume mole fractionc:
c= − kB·T S (T )·L·p
Z ln
I (ν)−E (t )
I0(ν)·Tr(t )
dν
dtdt. (2)
The additional parameters in Eq. (2) are constant entities like the Boltzmann constantkB; the optical path length L;
molecular constants like the line strength S(T ) of the se-lected molecular transition; the dynamic laser tuning coef-ficient dν/dt, which is a constant laser property; and con-tinuously measured entities such as gas pressure (p), gas temperature (T), and photodetector signal of the transmit-ted light intensityI (ν)as well as the initial light intensity
I0(ν), which is retrieved during the evaluation process from
the transmitted light intensityI (ν).
The fundamental difference between a calibration approach and this stringent concept is that only effects which are part of our physical model are taken into account for the final H2O
mole fraction calculation. All other effects like gas pressure or temperature dependencies, which cannot be corrected with a well-defined physical explanation, remain in our final re-sults even if this has the consequence of slightly uncorrected results deviations. This strict philosophy leads to measure-ments which are very reliable with respect to accuracy, pre-cision, and the instrument’s overall performance. The down-side is a relatively computer-intensive, sophisticated evalua-tion. As SEALDH-II stores all the raw spectra, one could – if needed for whatever reason – also calibrate the instrument by referencing it to a high-accuracy water vapor standard and transfer the better accuracy, e.g., of a metrological standard onto the instrument. Every calibration-free instrument can be calibrated since pre-requirements for a calibration are just a subset of the requirements for a calibration-free instrument. However, a calibration can only improve the accuracy for the relatively short time between two calibration cycles by adding all uncertainty contributions linked to the calibration itself to the system. This is unpleasant or even intolerable for certain applications and backs our decision to develop a calibration-free instrument to enable a first-principles, long-term stable, maintenance-free, and autonomous hygrometer for field use, e.g., at remote sites or aircraft deployments.
3 SEALDH-II validation facility 3.1 Setup
Figure 1 right shows the validation setup. As a well-defined and highly stable H2O vapor source, we use the commercial
Thunder Scientific model (TSM) 3900, similar to Thunder Scientific model 2500 (2016). This source saturates pre-dried air at an elevated gas pressure in an internally ice-covered chamber. The gas pressure in the chamber and the chamber’s wall temperature are precisely controlled and highly stable and thus define the absolute water vapor concentration via the Sonntag equation (Sonntag, 1990). After passing through the saturator, the gas expands to a pressure suitable for the subsequent hygrometer. The pressure difference between the saturation chamber pressure and the subsequent step give this principle its name “two pressure generator”. The stable H2O
mole fraction range of the TSM is 1–1300 ppmv for these specific deployment conditions. This generator provides a stable flow of approximately 4–5 SLM. Roughly 0.5 SLM are distributed to a D/FPH (MBW 373; MBW Calibration Ltd., 2010). SEALDH-II is fed with approx. 3.5 SLM, while 0.5 SLM is fed to an outlet. This setup ensures that the dew-point mirror hygrometer (DPH)2 operates close to the am-bient pressure, where its metrological primary calibration is
2The dew-point mirror hygrometer used here can measure far
below 0◦C; therefore, it is a dew-point mirror > 0◦C and a
frost-valid, and that the gas flow is sufficiently high in any part of the system to avoid recirculation of air. The vacuum pump is used to vary the gas pressure in SEALDH-II’s cell with a minimized feedback on the flow through the D/FPH and the TSM. This significantly reduces the time for achieving a sta-ble equilibrium after any gas pressure change in SEALDH-II’s chamber. SEALDH-SEALDH-II’s internal electronic flow regula-tor limits the mass flow at higher gas pressures and gradually opens towards lower pressures (vacuum pumps usually con-vey a constant volume flow, i.e., the mass flow is pressure dependent). We termed this entire setup “traceable humidity generator” (THG) and will call it such throughout the text. 3.2 Accuracy of THG
The humidity of the gas flow is set by the TSM generator but the absolute H2O values are traceably determined with
the D/FPH. The D/FPH, with its primary calibration, thus guarantees the absolute accuracy in this setup. The D/FPH is not affected by the pressure changes in SEADLH-II’s mea-surement cell and operates at standard ambient gas pressure and gas temperature where its calibration is most accurate. The D/FPH was calibrated (Fig. 2) at the German national standard for mid-range humidity (green, 600–8000 ppmv) as well as at the German national standard for low-range hu-midity (blue, for lower values 0.1–500 ppmv). The two na-tional standards work on different principles: the two pres-sure principle (Buchholz et al., 2014) currently supplies the lower uncertainties (green, “±” values in Fig. 2). Uncer-tainties are somewhat higher for the coulometric generator (Mackrodt, 2012) in the lower humidity range (blue). The1
values in Fig. 2 show the deviations between the readings of the D/FPH and the “true” values of the national primary standards.
4 SEALDH-II validation procedure
4.1 Mid-term multi-week permanent operation of SEALDH-II
Figure 1. (a) Photo of SEALDH-II, the Selective Extractive Airborne Laser Diode Hygrometer (width: 19 in. rack; height: 4 rack units=17.8 cm).(b)Setup for the metrological absolute accuracy validation. The combination of a H2O source together with a traceable
dew-point hygrometer (DPH) is used as a transfer standard – a traceable humidity generator (THG).
Figure 2.Calibration of the D/FPH (dew- and frost-point mirror hy-grometer, MBW 373 LX, which is used as part of the THG) at the national primary water vapor standards of Germany. The standard for the higher H2O mole fraction range (orange) is a “two pres-sure generator” (Buchholz et al., 2014); for the lower concentration range (blue) a “coulometric generator” (Mackrodt, 2012) is used as a reference. The deviations between reference and DPH are labeled with “1”. The uncertainties of every individual calibration point are stated as green numbers below every single measurement point.
H2O mole fraction levels between 2 and 1200 ppmv. At each
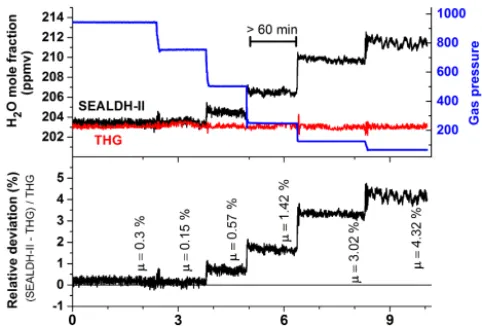
mole fraction level, the gas pressure was varied in six steps (from 65 to 950 hPa) over a range which is particularly inter-esting for instruments on airborne platforms operating from troposphere to lower stratosphere, where SEALDH-II’s un-certainty (4.3 %±3 ppmv) is suitable. Figure 3 (top) shows the comparison between SEALDH-II (black line) and the THG setup (red). Figure 3 (bottom) shows the gas pressure (blue) and the gas temperature (green) in SEALDH-II mea-surement cell. The gas temperature increase in the second
Figure 3.Overview showing all data recorded over 23 days of val-idation experiments. Measurements of the traceable humidity gen-erator (THG) are shown in red, SEALDH-II data in black, and gas pressure and gas temperature in SEALDH-II’s measurement cell in blue and green. Note: SEALDH-II operated the entire time with-out any malfunctions. The THG did not save data in the 35 ppmv section. The temperature increase during the 75 ppmv section was caused by a defect of the air conditioning in the laboratory.
Figure 4.Detailed plot of the validation at 200 ppmv with six gas pressure steps from 50 to 950 hPa. Each individual pressure level was maintained for at least 60 min in order to avoid any dynamic or hysteresis effects and to facilitate clear accuracy assessments. The µ values define the averaged relative deviation on every gas pressure level.
SEALDH-II. This deviation is correlated to the absolute gas pressure level and can be explained by deficiencies of the Voigt lines shape used to fit SEALDH-II’s spectra (Buchholz et al., 2014, 2016). The Voigt profile, a convolution of Gaus-sian (for temperature broadening) and Lorentzian (pressure broadening) profiles used for SEALDH-II’s evaluation, does not include effects such as Dicke narrowing, which become significant at lower gas pressures. Neglecting these effects cause systematic but long-term stable and fully predictable deviations from the reference value in the range from sub-percent at atmospheric gas pressures to less than 5 % at the lowest gas pressures described here. We have chosen not to implement any higher-order line shape (HOLS) models as the spectral reference data needed are not available at suf-ficient accuracy. Further, HOLS would force us to increase the number of free-fitting parameters, which would destabi-lize our fitting procedure, and lead to reduced accuracy and reliability (i.e., higher uncertainty) as well as significantly increased computational efforts. This is especially important for flight operation where temporal H2O fluctuations
(spa-tial fluctuations result in temporal fluctuations for a moving device) occur with gradients up to 1000 ppmv s−1.
These well-understood, systematic pressure-dependent de-viations will be visible in each further result plot of this pa-per. The impact and methods of compensation are already discussed in Buchholz et al. (2014). The interested reader is referred to this publication for a more detailed analysis and description.
SEALDH-II’s primary target areas of operations are harsh field environments. Stability and predictability are to be bal-anced with extra levels of accuracy which might not be re-quired or reliably achievable for the intended application.
HOLS models are therefore deliberately traded for a sta-ble, reliasta-ble, and unified fitting process under all atmospheric conditions. This approach leads to systematic, predictable deviations in the typical airborne accessible atmospheric gas pressure range (125–900 hPa) of less than 3 %. One has to compare these results for assessment of the non-systematic deviations of 20 % revealed during the mentioned AquaVIT comparison campaign (Fahey et al., 2014). Hence, for field and airborne purposes, the 3 % instrument uncertainty seems to be fully acceptable – especially in airborne environments where the water vapor content is locally very inhomoge-neous (leads to rapid temporal variations) and therefore the sampling system enhances the instrument uncertainty signif-icantly.
This comparison with AquaVIT should just provide a frame to embed the 3 %. The H2O mole fraction range
of Aquavit (0–150 ppmv) versus this validation range (5– 1200 ppmv) and the instruments configuration at Aqua-VIT (mainly (upper) stratospheric hygrometers) versus SEALDH-II as a wide-range instrument (3–40 000 ppmv) do not allow a direct comparison. Sadly, there is no other reli-able (representative for the community, externally reviewed, blind submission, etc.) comparison exercise such as Aqua-VIT for higher concentration ranges.
4.2 Assessment of SEALDH-II’s mid-term accuracy: dynamic effects
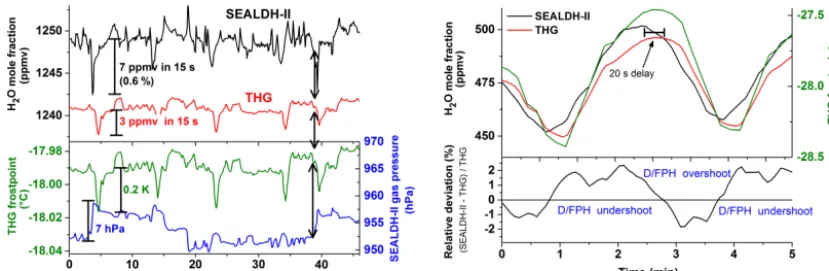
Besides the pressure dependence discussed above, SEALDH-II’s accuracy assessment is exacerbated by the dif-ferences in the temporal behavior between the THG’s D/FPH and SEALDH-II: Fig. 5 (left) shows an enlarged 45 min long section of measured comparison data. SEALDH-II (black) shows a fairly large water vapor variation compared to the THG (red). The precision of SEALDH-II (see Sect. 2) is 0.056 ppmv at 0.4 Hz (which was validated at a H2O mole
fraction of 600 ppmv; Buchholz et al., 2016) yielding a signal-to-noise ratio of 10 700. Therefore, SEALDH-II can very precisely detect variations in the H2O mole fraction.
In contrast, the working principle of a D/FPH requires an equilibrated ice or dew layer on the mirror. Caused by the inertial thermal adjustment process, the response time of a D/FPH has certain limitations due to this principle (the dew-and frost-point temperature measurement is eventually used to calculate the final H2O mole fraction), whereas the optical
Figure 5.Short-term H2O fluctuations in the generated water vapor flow measured by SEALDH-II and the dew- and frost-point mirror hygrometer (D/FPH) of the traceable humidity generator (THG). The different dynamic characteristics of SEALDH-II (fast response time) and THG (quite slow response) lead in a direct comparison to artificial noise. Oscillating behaviors like in the right figure occur when the THG is not equilibrated. We did not use such data segments for the accuracy assessments.
compared to SEALDH-II, which detects changes approx. 20 s faster. This signal delay is also clearly visible between minutes 32 and 40, where the water vapor variations detected by SEALDH-II are also visible in the smoothed signals of the THG. Figure 5 (right) shows such a variation in detail (5 min). The delay between the THG and SEALDH-II is here also approximately 20 s. If we assume that SEALDH-II measures (due to its high precision) the true water vapor fluctuations, the relative deviation can be interpreted as overshooting and undershooting of the D/FPH’s controlling cycle, which is a commonly known response behavior of slow regulation feedback loops to fast input signal changes. The different time responses lead to “artificial” noise in the mole fraction differences between SEALDH-II and THG. Theoretically, one could characterize this behavior and then try to correct or shift the data to minimize this artificial noise. However, a D/FPH is fundamentally insufficient for a dynamic characterization of a fast response hygrometer such as SEALDH-II. Thus, the better strategy is to keep the entire system as stable as possible and calculate mean values by using the inherent assumption that under- and overshoots of the DPH affect the mean statistically and equally. With this assumption, the artificial noise can be seen in the first order as Gaussian distributed noise within each pressure step (Fig. 4) of at least 60 min. The error induced by this should be far smaller than the above-discussed uncertainties of the THG (and SEALDH-II).
5 Results
The results of this validation exercise are categorized in three sections according to the following conditions in atmo-spheric regions: mid-tropoatmo-spheric range of 1200–600 ppmv (Fig. 6), upper-tropospheric range of 600–20 ppmv (Fig. 7), and lower-stratospheric range of 20–5 ppmv (Fig. 8). This categorization is also justified by the relative influence
of SEALDH-II’s calculated offset uncertainty of±3 ppmv (Buchholz and Ebert, 2014): at 1200 ppmv, its relative con-tribution of 0.25 % is negligible compared to the 4.3 % linear part of the uncertainty of SEALDH-II. At 5 ppmv, the rela-tive contribution of the offset uncertainty is 60 % and thus dominates the linear part of the uncertainty. Before assess-ing the followassess-ing data, it should be emphasized again that SEALDH-II’s spectroscopic first-principles evaluation was designed to rely on accurate spectral data instead of a cal-ibration. SEALDH-II was never calibrated or referenced to any kind of reference humidity generator or sensor.
5.1 The 1200–600 ppmv range
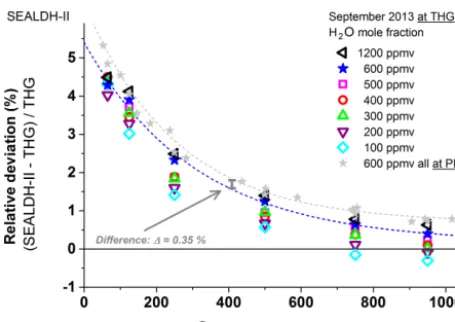
Figure 6 shows the summary of the pressure-dependent val-idations in the 1200–600 ppmv range. Each of the 48 data points represents the mean over one pressure measurement section of at least 60 min (see Fig. 4). A cubic polynomial curve fitted to the 600 ppmv results (blue) serves as an in-ternal quasi-reference to connect with the following graphs. The 600 ppmv data (grey) are generated via a supplemen-tary comparison at a different generator: the German national primary mid-humidity generator (PHG). These primary gen-erator data at 600 ppmv indicate a deviation between PHG and THG of about 0.35 %, which is compatible with the un-certainties of the THG (see Sect. 3.1) and the PHG (0.4 %) (Buchholz et al., 2014). The PHG comparison data also al-low a consistency check between the absolute values of (see Fig. 2) the PHG (calibration-free), the THG (D/FPH cali-brated), and SEALDH-II (calibration-free).
5.2 The 600–20 ppmv range
be-Figure 6.Gas-pressure-dependent comparison between SEALDH-II and THG over a H2O mole fraction range from 600 to 1200 ppmv
and a pressure range from 50 to 950 hPa. The 600 ppmv values (in grey) are measured directly at the national primary humidity genera-tor (PHG) of Germany; all other H2O mole fraction values are
mea-sured at and compared to the traceable humidity generator (THG). All SEALDH-II spectra were evaluated with a calibration-free first-principles evaluation based on absolute spectral parameters. No ini-tial or repetitive calibration of SEALDH-II with respect to any “wa-ter reference” source was used.
ing caused by SEALDH-II’s offset variation and will be dis-cussed in the 20–5 ppmv range.
5.3 The 20–5 ppmv range
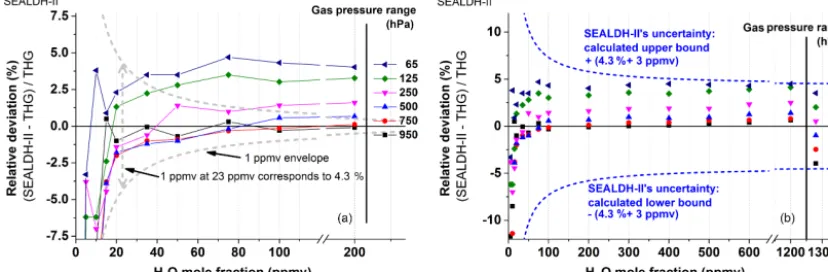
The results in this range (Fig. 8) are dominated by the offset uncertainty. It is important to mention at this point that the ±3 ppmv uncertainties are calculated based on assumptions, design innovations, and several independent, synchronous measurements which are automatically done while the instru-ment is in operation mode (see Buchholz et al., 2016; Buch-holz and Ebert, 2014). Hence, the calculated uncertainties resemble an upper uncertainty threshold; the real deviation could be lower than 3 ppmv. A clear assessment is fairly dif-ficult since at low concentrations (i.e., low optical densities) several other effects occur together such as optical interfer-ence effects like fringes caused by the very long coherinterfer-ence length of the laser used. However, Fig. 9a allows a rough as-sessment of the offset instability. This plot shows all the data below 200 ppmv, grouped by the gas pressure in the surement cell. If one ignores the 65 hPa and 125 hPa mea-surements, which are clearly affected by HOLS effects (see above), the other measurements fit fairly well in a±1 ppmv envelope function (grey). In other words, SEALDH-II’s com-bined offset “fluctuations” are below 1 ppmv H2O. All
vali-dation measurements done with SEALDH-II during the last years consistently demonstrated a small offset variability so that the observed offset error is around 0.6 ppmv – i.e., only 20 % of the calculated±3 ppmv.
Figure 7.Comparison results as in Fig. 6 but for the 200–600 ppmv range.
Figure 8. Comparison results as in Figs. 6 and 7 but for the 5–20 ppmv range. All spectra are determined with a calibration-free first-principles evaluation concept. The major contribution to the higher fluctuations at lower concentrations is the accuracy of the offset determination (for details see text).
5.4 General evaluation
Figure 9 presents a summary of all 90 analyzed mole fraction–pressure pairs during the 23 days of validation. The calculated uncertainties (linear 4.3 % and offset±3 ppmv) of SEALDH-II are plotted in purple. This uncertainty calcu-lation does not include line shape deficiencies and is there-fore only valid for a pressure range where the Voigt profile can be used to represent all major broadening effects of ab-sorption lines (Dicke, 1953; Maddaloni et al., 2010). This is the case above 250 hPa. The results at 950, 750, 500, and 250 hPa show that the maximum deviations, derived from these measurements, can be described by linear+2.5 % and offset−0.6 ppmv.
Figure 9.Direct comparison of SEALDH-II versus THG for H2O mole fractions between 5 and 200 ppmv and gas pressures from 65 to
950 hPa. Both panels show the relative deviations between SEALDH-II and THG grouped and color-coded by gas pressure.(a)Relative deviations of SEALDH-II versus THG below 200 ppmv; the grey line indicates the computed relative effect in SEALDH-II’s performance caused by±1 ppmv offset fluctuation. This line facilitates a visual comparison between an offset impact and the 4.3 % linear part of the uncertainty of SEALDH-II.(b)Relative deviations for all measured data in the same concentration range. Also shown is SEALDH-II’s total uncertainty of 4.3 %±3 ppmv (calculated for 1013 hPa) as a dashed line.
process. This is a significantly different approach between calibration-free instruments such as SEALDH-II and other classical spectroscopic instruments which rely on sensor calibration. SEALDH-II provides correctness of measure-ment values within its uncertainties because any effect which causes deviations has to be included in the evaluation model – otherwise it is not possible to correct for it.
As mentioned before, any calibration-free instrument can be calibrated too (see, e.g., Buchholz et al., 2013). How-ever, by doing so, one must accept to a certain extent loss of control over the system, especially in environments which are different from the calibration environment. For example, if a calibration was used to remove an instrumental offset, one has to ensure that this offset is stable long-term, which is usually quite difficult, as shown by the example of para-sitic water offsets in fiber-coupled diode laser hygrometers (Buchholz and Ebert, 2014). Another option is to choose a recalibration frequency that is high enough, i.e., minimiz-ing the drift amplitude by minimizminimiz-ing the time between two calibrations. This, however, reduces the usable measurement time and leads to considerable investment of time and money into the calibration process. For the case of SEALDH-II, a calibration of the pressure dependence – tempting and easy to do – would directly “improve” SEALDH-II’s labo-ratory overall performance level from ±4.3 %±3 ppmv to ±0.35 %±0.3 ppmv. At first glance, this “accuracy” would then be an improvement by a factor of 55 compared to the mentioned results of AquaVIT (Fahey et al., 2014). However, it is extremely difficult – if not impossible – to guarantee this performance and the validity of the calibration under harsh field conditions; instead, SEALDH-II would “suffer” from the same typical calibration associated problems in stability and in predictability. Eventually, the calibration-free evalua-tion would define the trusted values and the “improvement”,
achieved by the calibration, would have to be used very care-fully and might disappear eventually.
6 Conclusion and outlook
The SEALDH-II instrument, a recently developed, compact, airborne, calibration-free hygrometer (Buchholz et al., 2016) which implements a holistic, first-principle dTDLAS ap-proach, was stringently validated at a traceable water va-por generator at the German National Metrology Institute (PTB). The pressure-dependent validation covered a H2O
range from 5 to 1200 ppmv and a pressure range from 65 to 950 hPa. In total, 90 different H2O mole fraction–pressure
lin-ear +2.5 % and offset−0.6 ppmv. If we suppress this sys-tematic pressure dependence, the purely statistical deviation is described by linear scatter of±0.35 % and an offset uncer-tainty of±0.3 ppmv.
Due to its extensive internal monitoring and correction infrastructure, SEALDH-II is very resilient against a broad range of external disturbances and has an output signal tem-perature coefficient of only 0.026 % K−1, which has already been validated earlier (Buchholz et al., 2016). Therefore, these results can be directly transferred into harsh field envi-ronments. With this metrological validation presented here, SEALDH-II is the first directly deployable, metrologically validated, airborne transfer standard for atmospheric water vapor. Having already been deployed in several airborne and laboratory measurement campaigns, SEALDH-II thus directly links, for the first time, scientific campaign results to the international metrological water vapor scale.
For future applications, the measurement path length of 1.5 m and hence SEALDH-II’s sensitivity could be relatively quickly enhanced by a factor of 5–10 by implementing a longer path absorption cell. A linear increase of the ab-sorption path yield a proportional scaling of the SEALDH-II’s dynamic range (currently at 1.5 m: 3–40 000 ppmv; lower limit defined by the calculated offset uncertainty of ±3 ppmv). With this fairly simple adaption SEALDH-II could be adapted to lower H2O mole fraction ranges, which
would make SEALDH-II more suitable for stratospheric ap-plications. The calculated offset uncertainty of SEALDH-II is reciprocally correlated with the optical path length. Therefore, an increase of the current 1.5 m optical path length to, e.g., 30 m or more with different cell designs such as McManus et al. (1995) or Tuzson et al. (2013) would allow us to reduce the offset uncertainty to 0.15 ppmv; the above-discussed laboratory offset deviation performance could reach levels of down to±0.015 ppmv.
Data availability. The underlying data for the results shown in this paper are raw spectra (time vs. photocurrent), which are compressed to be compatible with the instruments data storage. In the com-pressed state the total amount is approximately 6 GB of binary data. Uncompressed data size is approx. 60 GB. We are happy to share these data on request.
Author contributions. BB and VE conceived and designed the ex-periments. BB performed the experiments; BB and VE analyzed the data and wrote the paper.
Competing interests. The authors declare that they have no conflict of interest.
Acknowledgements. Parts of this work were embedded in the EM-PIR (European Metrology Program for Innovation and Research)
projects METEOMET-1 and METEOMET-2. The authors want to thank Norbert Böse and Sonja Pratzler (PTB Germany) for operating the German primary national water standard and the traceable humidity generator. Last but not least, the authors thank James McSpiritt (Princeton University) for the various discussions about reliable sensor designs and Mark Zondlo (Princeton Uni-versity) for sharing his broad knowledge about atmospheric water vapor measurements.
Edited by: Dietrich G. Feist
Reviewed by: two anonymous referees
References
Buchholz, B. and Ebert, V.: Offsets in fiber-coupled diode laser hygrometers caused by parasitic absorption effects and their prevention, Meas. Sci. Technol., 25, 75501, https://doi.org/10.1088/0957-0233/25/7/075501, 2014.
Buchholz, B., Kühnreich, B., Smit, H. G. J., and Ebert, V.: Val-idation of an extractive, airborne, compact TDL spectrome-ter for atmospheric humidity sensing by blind inspectrome-tercomparison, Appl. Phys. B, 110, 249–262, https://doi.org/10.1007/s00340-012-5143-1, 2013.
Buchholz, B., Böse, N., and Ebert, V.: Absolute validation of a diode laser hygrometer via intercomparison with the German na-tional primary water vapor standard, Appl. Phys. B, 116, 883– 899, https://doi.org/10.1007/s00340-014-5775-4, 2014. Buchholz, B., Kallweit, S., and Ebert, V.: SEALDH-II – An
Autonomous, Holistically Controlled, First Principles TDLAS Hygrometer for Field and Airborne Applications: Design– Setup–Accuracy/Stability Stress Test, Sensors 2017, 17, 68, https://doi.org/10.3390/s17010068, 2016.
Buchholz, B., Afchine, A., Klein, A., Schiller, C., Krämer, M., and Ebert, V.: HAI, a new airborne, absolute, twin dual-channel, multi-phase TDLAS-hygrometer: background, design, setup, and first flight data, Atmos. Meas. Tech., 10, 35–57, https://doi.org/10.5194/amt-10-35-2017, 2017.
Busen, R. and Buck, A. L.: A High-Performance Hygrometer for Aircraft Use: Description, Installation, and Flight Data, J. Atmos. Ocean. Tech., 12, 73–84, https://doi.org/10.1175/1520-0426(1995)012<0073:AHPHFA>2.0.CO;2, 1995.
Cerni, T. A.: An Infrared Hygrometer for Atmospheric Research and Routine Monitoring, J. Atmos. Ocean. Tech., 11, 445–462, https://doi.org/10.1175/1520-0426(1994)011<0445:AIHFAR>2.0.CO;2, 1994.
Desjardins, R., MacPherson, J., Schuepp, P., and Karanja, F.: An evaluation of aircraft flux measurements of CO2, water
vapor and sensible heat, Bound.-Lay. Meteorol., 47, 55–69, https://doi.org/10.1007/BF00122322, 1989.
Dicke, R.: The effect of collisions upon the Doppler width of spectral lines, Phys. Rev., 89, 472–473, https://doi.org/10.1103/PhysRev.89.472, 1953.
Diskin, G. S., Podolske, J. R., Sachse, G. W., and Slate, T. A.: Open-path airborne tunable diode laser hygrometer, in: Proc. SPIE 4817, Diode Lasers and Applications in Atmospheric Sensing, 4817, 196–204, 2002.
Phys. B, 90, 573–580, https://doi.org/10.1007/s00340-007-2884-3, 2008.
Ebert, V. and Wolfrum, J.: Absorption spectroscopy, in: OPTI-CAL MEASUREMENTS-Techniques and Applications, edited by: Mayinger, F., 273–312, https://doi.org/10.1007/978-3-642-56443-7_13, 1994.
Ebert, V., Fernholz, T., Pitz, H., and Ebert, V.: In-situ monitoring of water vapour and gas temperature in a coal fired power-plant us-ing near-infrared diode lasers, Laser Appl. Chem. Environ. Anal., 26, 4–6, https://doi.org/10.1364/LACEA.2000.SaB4, 2000. Fahey, D. W., Gao, R.-S., Möhler, O., Saathoff, H., Schiller, C.,
Ebert, V., Krämer, M., Peter, T., Amarouche, N., Avallone, L. M., Bauer, R., Bozóki, Z., Christensen, L. E., Davis, S. M., Durry, G., Dyroff, C., Herman, R. L., Hunsmann, S., Khaykin, S. M., Mack-rodt, P., Meyer, J., Smith, J. B., Spelten, N., Troy, R. F., Vömel, H., Wagner, S., and Wienhold, F. G.: The AquaVIT-1 intercom-parison of atmospheric water vapor measurement techniques, At-mos. Meas. Tech., 7, 3177–3213, https://doi.org/10.5194/amt-7-3177-2014, 2014.
Gurlit, W., Zimmermann, R., Giesemann, C., Fernholz, T., Ebert, V., Wolfrum, J., Platt, U. U., and Burrows, J. P.: Lightweight diode laser spectrometer “CHILD” for balloon- borne measure-ments of water vapor and methane, Appl. Optics, 44, 91–102, https://doi.org/10.1364/AO.44.000091, 2005.
Hansford, G. M., Freshwater, R. A., Eden, L., Turnbull, K. F. V., Hadaway, D. E., Ostanin, V. P., and Jones, R. L.: Lightweight dew-/frost-point hygrometer based on a surface-acoustic-wave sensor for balloon-borne atmospheric water vapor profile sounding, Rev. Sci. Instrum., 77, 014502, https://doi.org/10.1063/1.2140275, 2006.
Heinonen, M., Anagnostou, M., Bell, S., Stevens, M., Benyon, R., Bergerud, R. A., Bojkovski, J., Bosma, R., Nielsen, J., Böse, N., Cromwell, P., Kartal Dogan, A., Aytekin, S., Uy-tun, A., Fernicola, V., Flakiewicz, K., Blanquart, B., Hudok-lin, D., Jacobson, P., Kentved, A., Lóio, I., Mamontov, G., Masarykova, A., Mitter, H., Mnguni, R., Otych, J., Steiner, A., Szilágyi Zsófia, N., and Zvizdic, D.: Investigation of the equiv-alence of national dew-point temperature realizations in the
−50◦C to+20◦C range, Int. J. Thermophys., 33, 1422–1437, https://doi.org/10.1007/s10765-011-0950-x, 2012.
Held, I. and Soden, B.: Water vapor feedback and global warming, Annu. Rev. Energ. Env., 25, 441–475, https://doi.org/10.1146/annurev.energy.25.1.441, 2000.
Helten, M., Smit, H. G. J., Sträter, W., Kley, D., Nedelec, P., Zöger, M., and Busen, R.: Calibration and performance of automatic compact instrumentation for the measurement of relative hu-midity from passenger aircraft, J. Geophys. Res.-Atmos., 103, 25643–25652, https://doi.org/10.1029/98JD00536, 1998. Hunsmann, S., Wunderle, K., Wagner, S., Rascher, U., Schurr, U.,
and Ebert, V.: Absolute, high resolution water transpiration rate measurements on single plant leaves via tunable diode laser ab-sorption spectroscopy (TDLAS) at 1.37 µm, Appl. Phys. B, 92, 393–401, https://doi.org/10.1007/s00340-008-3095-2, 2008. JCGM: JCGM 2008: 2008 International vocabulary of metrology –
Basic and general concepts and associated terms (VIM) Vocab-ulaire international de métrologie – Concepts fondamentaux et généraux et termes associés (VIM), Int. Organ. Stand., 3, 104, https://doi.org/10.1016/0263-2241(85)90006-5, 2008.
Joint Committee for Guides in Metrology (JCGM): Evaluation of measurement data – An introduction to the “Guide to the ex-pression of uncertainty in measurement” and related documents, BIPM Bur. Int. des Poids Mes., available at: http://www.bipm.org (last access: 15 January 2018), 2009.
Karpechko, A. Y., Perlwitz, J., and Manzini, E.: A model study of tropospheric impacts of the Arctic ozone de-pletion 2011, J. Geophys. Res.-Atmos., 119, 7999–8014, https://doi.org/10.1002/2013JD021350, 2014.
Kiehl, J. T. and Trenberth, K. E.: Earth’s Annual Global Mean Energy Budget, B. Am. Meteorol. Soc., 78, 197–208, https://doi.org/10.1175/1520-0477(1997)078<0197:EAGMEB>2.0.CO;2, 1997.
Kley, D. and Stone, E.: Measurement of water vapor in the strato-sphere by photodissociation with Lyα(1216 Å) light, Rev. Sci. Instrum., 49, 691, https://doi.org/10.1063/1.1135596, 1978. Krämer, M., Schiller, C., Afchine, A., Bauer, R., Gensch, I.,
Man-gold, A., Schlicht, S., Spelten, N., Sitnikov, N., Borrmann, S., de Reus, M., and Spichtinger, P.: Ice supersaturations and cir-rus cloud crystal numbers, Atmos. Chem. Phys., 9, 3505–3522, https://doi.org/10.5194/acp-9-3505-2009, 2009.
Kühnreich, B., Höh, M., Wagner, S., and Ebert, V.: Di-rect single-mode fibre-coupled miniature White cell for laser absorption spectroscopy, Rev. Sci. Instrum., 87, 023111, https://doi.org/10.1063/1.4941748, 2016.
Ludlam, F. H.: Clouds and storms: The behavior and effect of water in the atmosphere, Pennsylvania State University Press, Univer-sity Park, Pennsylvania, USA, 405 pp., 1980.
Mackrodt, P.: A New Attempt on a Coulometric Trace Hu-midity Generator, Int. J. Thermophys., 33, 1520–1535, https://doi.org/10.1007/s10765-012-1348-0, 2012.
Maddaloni, P., Malara, P., and De Natale, P.: Simulation of Dicke-narrowed molecular spectra recorded by off-axis high-finesse optical cavities, Mol. Phys., 108, 749–755, https://doi.org/10.1080/00268971003601571, 2010.
May, R. D.: Open-path, near-infrared tunable diode laser spectrom-eter for atmospheric measurements of H2O, J. Geophys. Res., 103, 19161–19172, https://doi.org/10.1029/98JD01678, 1998. Maycock, A. C., Shine, K. P., and Joshi, M. M.: The temperature
re-sponse to stratospheric water vapour changes, Q. J. Roy. Meteor. Soc., 137, 1070–1082, https://doi.org/10.1002/qj.822, 2011. MBW Calibration Ltd.: MBW 373HX, available at:
http://www.mbw.ch/wp-content/uploads/2014/11/MBW_ 373_Datasheet_EN_V2.1.pdf (last access: 15 January 2018), 2010.
McManus, J., Kebabian, P., and Zahniser, M.: Astig-matic mirror multipass absorption cells for long-path-length spectroscopy, Appl. Optics, 34, 3336–3348, https://doi.org/10.1364/AO.34.003336, 1995.
Meyer, J., Rolf, C., Schiller, C., Rohs, S., Spelten, N., Afchine, A., Zöger, M., Sitnikov, N., Thornberry, T. D., Rollins, A. W., Bozóki, Z., Tátrai, D., Ebert, V., Kühnreich, B., Mackrodt, P., Möhler, O., Saathoff, H., Rosenlof, K. H., and Krämer, M.: Two decades of water vapor measurements with the FISH fluores-cence hygrometer: a review, Atmos. Chem. Phys., 15, 8521– 8538, https://doi.org/10.5194/acp-15-8521-2015, 2015. Möller, D., Feichter, J., and Herrmann, H.: Von Wolken, Nebel
edited by: Zellner, R., 236–240, WILEY-VCH Verlag GmbH & Co. KGaA, Weinheim, Germany, 2011.
Muecke, R. J., Scheumann, B., Slemr, F., and Werle, P. W.: Calibra-tion procedures for tunable diode laser spectrometers, Proc. SPIE 2112, Tunable Diode Laser Spectrosc. Lidar, DIAL Tech. Envi-ron. Ind. Meas., 2112, 87–98, https://doi.org/10.1117/12.177289, 1994.
Ohtaki, E. and Matsui, T.: Infrared device for simultaneous measurement of fluctuations of atmospheric carbon diox-ide and water vapor, Bound.-Lay. Meteorol., 24, 109–119, https://doi.org/10.1007/BF00121803, 1982.
Peter, T., Marcolli, C., Spichtinger, P., Corti, T., Baker, M. B., and Koop, T.: When dry air is too humid, Science, 314, 1399–1402, https://doi.org/10.1126/science.1135199, 2006.
Petersen, R., Cronce, L., Feltz, W., Olson, E., and Helms, D.: WVSS-II moisture observations: A tool for validating and mon-itoring satellite moisture data, EUMETSAT Meteorol. Satell. Conf., 22, 67–77, available at: https://amdar.noaa.gov/docs/ Petersen_presentation.pdf (last access: 20 February 2017), 2010. Ravishankara, A. R.: Water Vapor in the Lower Stratosphere, Sci-ence, 337, 809–810, https://doi.org/10.1126/science.1227004, 2012.
Rollins, A., Thornberry, T., Gao, R. S., Smith, J. B., Sayres, D. S., Sargent, M. R., Schiller, C., Krämer, M., Spelten, N., Hurst, D. F., Jordan, A. F., Hall, E. G., Vömel, H., Diskin, G. S., Podolske, J. R., Christensen, L. E., Rosenlof, K. H., Jensen, E. J., and Fahey, D. W.: Evaluation of UT/LS hygrometer accuracy by intercomparison during the NASA MACPEX mission, J. Geophys. Res.-Atmos., 119, 1915–1935, https://doi.org/10.1002/2013JD020817, 2014.
Roths, J. and Busen, R.: Development of a laser in situ airborne hy-grometer (LISAH) (feasibility study), Infrared Phys. Techn., 37, 33–38, https://doi.org/10.1016/1350-4495(95)00103-4, 1996. Salasmaa, E. and Kostamo, P.: HUMICAP®thin film hymidity
sen-sor, in: Advanced Agricultural Instrumentation Series E: Applied Sciences, edited by: Gensler, W. G., vol. 111, 135–147, Springer, Dordrecht, the Netherlands, 1986.
Scherer, M., Vömel, H., Fueglistaler, S., Oltmans, S. J., and Stae-helin, J.: Trends and variability of midlatitude stratospheric water vapour deduced from the re-evaluated Boulder bal-loon series and HALOE, Atmos. Chem. Phys., 8, 1391–1402, https://doi.org/10.5194/acp-8-1391-2008, 2008.
Schiff, H. I., Mackay, G. I., and Bechara, J.: The use of tunable diode laser absorption spectroscopy for atmo-spheric measurements, Res. Chem. Intermediat., 20, 525–556, https://doi.org/10.1163/156856794X00441, 1994.
Schulz, C., Dreizler, A., Ebert, V., and Wolfrum, J.: Combustion Di-agnostics, in Handbook of Experimental Fluid Mechanics, edited by: Tropea, C., Yarin, A. L., and Foss, J. F., 1241–1316, Springer Berlin Heidelberg, Heidelberg, Germany, 2007.
Sherwood, S., Bony, S., and Dufresne, J.: Spread in model climate sensitivity traced to atmospheric convective mixing, Nature, 505, 37–42, https://doi.org/10.1038/nature12829, 2014.
Silver, J. A. and Hovde, D. C.: Near-infrared diode laser airborne hygrometer, Rev. Sci. Instrum., 65, 1691–1694, https://doi.org/10.1063/1.1144861, 1994a.
Silver, J. A. and Hovde, D. C.: Near-infrared diode laser airborne hygrometer, Rev. Sci. Instrum., 65, 1691–1694, https://doi.org/10.1063/1.1144861, 1994b.
Smit, H. G. J., Rolf, C., Kraemer, M., Petzold, A., Spelten, N., Neis, P., Maser, R., Buchholz, B., Ebert, V., and Tatrai, D.: Devel-opment and Evaluation of Novel and Compact Hygrometer for Airborne Research (DENCHAR): In-Flight Performance During AIRTOSS-I/II Research Aircaft Campaigns, Geophys. Res. Ab-str., 16 (EGU2014-9420), 2014.
Sonntag, D.: Important new Values of the Physical Constants of 1968, Vapour Pressure Formulations based on the ITS-90, and Psychrometer Formulae, Meteorol. Z., 40, 340–344, 1990. Thornberry, T. D., Rollins, A. W., Gao, R. S., Watts, L. A.,
Ci-ciora, S. J., McLaughlin, R. J., and Fahey, D. W.: A two-channel, tunable diode laser-based hygrometer for measurement of wa-ter vapor and cirrus cloud ice wawa-ter content in the upper tropo-sphere and lower stratotropo-sphere, Atmos. Meas. Tech., 8, 211–224, https://doi.org/10.5194/amt-8-211-2015, 2015.
Thunder Scientific: Model 2500 Two-Pressure Humidity Genera-tor, available at: http://www.thunderscientific.com, last access: 12 May 2016.
Tuzson, B., Mangold, M., Looser, H., Manninen, A., and Emmeneg-ger, L.: Compact multipass optical cell for laser spectroscopy, Opt. Lett., 38, 257–259, https://doi.org/10.1364/OL.38.000257, 2013.
Webster, C., Flesch, G., Mansour, K., Haberle, R., and Bau-man, J.: Mars laser hygrometer, Appl. Optics, 43, 4436–4445, https://doi.org/10.1364/AO.43.004436, 2004.
White, J.: Very long optical paths in air, J. Opt. Soc. Am., 66, 411– 416, https://doi.org/10.1364/JOSA.66.000411, 1976.
Wiederhold, P. R.: Water Vapor Measurement, Meth-ods and Instrumentation, Har/Dskt, CRC Press, 384 pp., available at: https://www.crcpress.com/ Water-Vapor-Measurement-Methods-and-Instrumentation/ Wiederhold/p/book/9780824793197 (last access: 21 January 2018), 1997.
Zöger, M., Engel, A., McKenna, D. S., Schiller, C., Schmidt, U., and Woyke, T.: Balloon-borne in situ measurements of stratospheric H2O, CH4and H2at midlatitudes, J. Geophys. Res., 104, 1817–
1825, https://doi.org/10.1029/1998JD100024, 1999a.