2921
Weibull Parameter Estimation For Wind Energy
At Different Elevations Using Graphical Method
Somya Tiwari, Neha Gupta
Abstract: Wind speed is the main driven element for power extraction from wind turbine. Wind turbine micro siting plays major role in power extraction at different hub height considering many factors including terrain type, wind shear, roughness, thermal effect, location, standard deviation of mean wind speed etc. Here in this paper extrapolation law is used for calculation of wind speed at different elevations with reference to measured data at 100m height from the site. Assessment of effect of shear factor at height of 120m and 150m on mean wind speed is done using power law. Data is available for year 2016 from January to December for site Baderan, district Bikaner, state Rajasthan, India. Using graphical method for extrapolated height wind speed for estimation of Weibull shape and scale factor. Wind shear coefficient effects the wind speed at different hub heights. As height is increasing wind speed is also increasing. Graphical method was used for computing Weibull shape and scale parameters for all three heights. Range of k is from 1.43 to 1.46 and c is in range of 8.35 to 8.54.
Index Terms: Elevation, extrapolation, regression, roughness, shear factor, wind energy, wind power density, wind speed,
————————————————————
1 I
NTRODUCTIONNatural driven convection system of earth in which main source of energy is sun creates movement of air. Rotation of earth creates bending force and gravity of earth also acts on the air. Weather, seasons, day and night creates thermal effect due to change of temperature. Altogether these parameters affects the wind speed at different elevations above ground level. In previous time when measuring equipment were not available wind measurement used to be done by using estimation techniques. Wind speed & direction can be estimated but estimation of wind fluctuations in terms of peak gusts and deviations are not possible without instrument.
Generally anemometers with other measuring instruments installed at particular height to measure the wind data. Nowadays latest technologies are also coming up for measuring instruments. Sodar and Lidar measures the data for specific range of height like 10m to 300m. Modern wind turbine technology is gearing up and now latest turbine up to hub height of 200m is available [1]. But for wind data measurement in most of the countries mast height is in the range of 10m to 50m above ground level.
Terrain type also have its effect on wind speed at higher elevated height. Here wind shear factor impacts the calculation of wind speed at higher range. Using different equation for calculation of wind shear factor data at different height can be calculated. During data measurement process it is constrain that measuring equipment is mounted at one fixed height for one location. Due to effect of discontinuity and other factors Weibull distribution scale parameter c also get affected. Near the earth surface wind is affected by topographical features. Due to which effect comes on wind speed data and as we know that turbine power is directly proportional to the cube of wind velocity so it effects the energy received from the
turbine. In designing and selecting turbine for particular location if actual operating conditions are known it will help in efficient operating of wind turbines. Specific operational environment will help manufacturer to give best suited model of turbine which will help through the life span of wind turbine. This climate of wind is further sub divided into following types
Macro wind climate large scale earth pattern Meso it is climate of a country
Local wind climate is a limited area climate
Unevenness of surface of earth directly effects the air flow and its effect is up to 100m. Earth rotation causes the bending force and balancing of this force creates movement of wind available on earth.
1.1 Characteristics of Wind
Wind turbine power directly get affected by variation of wind speed. Analysis of wind data plays key role for selection of site for turbine installation [2]. For this purpose both onshore and offshore data get investigated using latest measurement instruments sea winds blended satellite measurement and gridded atmospheric model data [3]. For further exploration these wind characteristics are important which includes wind mean speed, wind direction, wind speed distribution etc. Variation in generation of wind power is main task. To bring the soothing effect standard deviation, skewness and kurtosis changes are preferred [4]. Yearly wind characteristics, Monthly wind characteristics and Seasonal wind characteristics measurement on the basis of different parameters for accuracy of data [5].
1.2 Data description
Data for this analysis was provided by National Institute of Wind Energy, Chennai Government of India organization. Site is located at Baderan, district Bikaner, State Rajasthan, India for the period of January to December 2016. Site is located at deserted area and terrain is flat type. It is situated at
Longitude 68°7’ E and 97° 25’ E
Latitude – 84’N and 37°6’ N
Somya Tiwari, Mechanical Engineering School of Engineering and
Technology Ansal University, Gurgaon India,
E-mail: [email protected]
Neha Gupta, School of Engineering and Technology, Ansal University,
2922
2
METHODOLOGY
2.1 Power law
To find out wind velocity at height power law was given by Hellmann is used here [6] [7]
𝛼 = ( ) (
)
(1)
Which is also represent as
= ( ) (2)
Where
α = wind shear exponent or power law index
𝑣 = wind speed at height h1
𝑣 = wind speed at height h2
2.2 The Logarithmic law
To estimate the wind velocity at height is given by logarithmic wind law. According to this law [8]
𝑣 = 𝑣 (
)
(3)
Here 𝑧 is roughness length and its value is described on the basis of site description. Roughness class is in range of 0 to 4 number wise and length wise 0.0002m to 1.65m. It includes open water area to up to thick forest [9].
2.3 Turbulence
Turbulence is perturbed flow of wind which measured by turbulence intensity. Causes of turbulence are obstructions, roughness, topography etc. Level of turbulence intensity are low, moderate and high with value range less than 0.1 to more than 0.25 [10]. Which leads to sometimes major failure of wind power plant. Turbulence intensity is ratio of standard deviation and mean speed [11].
= ̅ (4)
3
WIND
DISTRIBUTION
Probability distribution functions (PDF) for wind data exploration is preferred. Weibull model describes two parameters one is shape another is scale parameters [12]. For data estimation Weibull model is preferred because it has feature that it for different durations it can modify its shape and scale parameters to give the best suited estimation which is not available with other model [13]. Many researcher have worked on different types of Weibull model which includes Bimodal of Weibull and Weibull model with three parameters. [14], [15].
𝑓 𝑣 = = ( ) ( ) [ ( ) ] 0 <= V < ∞ (5)
V is wind speed is m/s
k is Weibull shape parameter its unit less quantity which defines the shape of the curve
c is Weibull scale parameter with unit m/s it defines the scale of curve.
Weibull cumulative density function denoted by f (v) and it is integral part of Probability density function and given by F (v) which is cumulative probability density function, it is given by
𝑣 = ∫ 𝑓 𝑣 𝑑𝑣 = 𝑒 (6)
In this distribution mean is calculated by formulae
= 𝑐
(7)
Method used here also known as Least square fit method, Linear regression method and least square regression method (LSRM) [16]. If we convert equation number 5 into Logarithmic form we get equation no 7. After plotting curve through equation we get fitness coefficient known as R square [16], [17].
Logarithmic convergence of equation () is given by
ln *𝑙𝑛 ([ ])+ = 𝑘 ln 𝑣 (8)
Where i = 1, 2, 3…, n.
If we compare it with least square method we get
𝑌 = 𝑎 𝑏 𝑋 (9)
Where
Y= ordinate taken as dependent variable on Y-axis X= abscissa taken as independent variable on X-axis a = intercept
b= slope
Comparing equation no () and () we get values of Weibull parameters as follows
𝑘 = 𝑏 (10)
𝑐 = 𝑒 (11)
4
R
ESULT AND DISCUSSION2923
Fig. 1. Wind speed at different heights by extrapolation
Fig 2. Comparison of mean wind speed month wise for 100m, 120m and150m height.
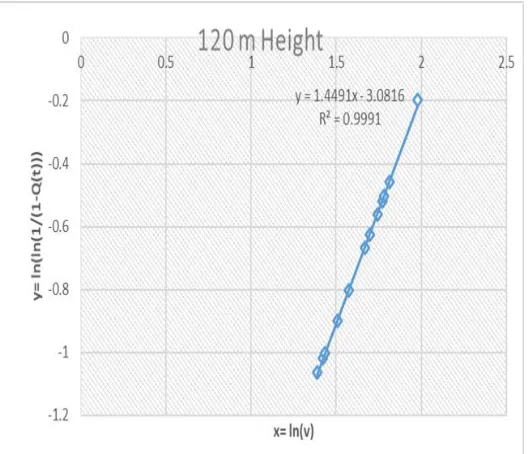
The value of Weibull shape and scale parameters were calculated for 100m,120m and 150m hub height using graphical method. Fig. 2 is showing comparison of different wind speed at different heights throughout the year month wise. Equation (8) is used to plot the graph for all three heights. Using best fit curve equation to calculate the shape and scale parameters using equation (10) & (11). Value of k if false between 1.5 to 2 it is considered as good quality wind. For values at lower side of 1.5 for k values are considered for highly variable wind and more than value 2 having adequate wind. If k is more than 3 it means wind speed are consistent
and stable types. Plot at height 100m is shown in Fig 3, 120m height plot is Fig. 4 and 150m height plot is shown by Fig. 5.
Fig. 3. Graphical method to estimate Weibull scale and shape parameters at height 100m.
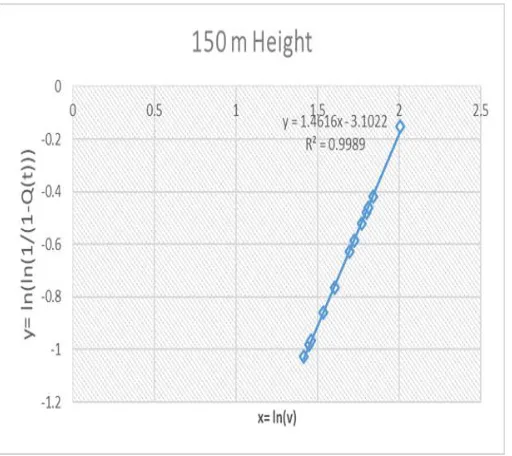
2924 Fig. 5. Graphical method to estimate Weibull scale and shape parameters
at height 150m.
TABLE 1
WEIBULL PARAMETERS FROM GRAPHICAL METHOD AT EXTRAPOLATED HEIGHTS
TABLE 2
REGRESSION STATICS AT DIFFERENT HEIGHT LEVEL
TABLE 3
WIND SPEED PROFILE AT DIFFERENT HEIGHT.
Table 1 shows the value of k and c at different heights. Here we have used linear regression model for computing the best fitted line. On further analysis of regression values of different statistics were calculated for multiple R, R square and adjusted R square for all three heights. Their values represent that almost 99.96% as shown for 100m height is well fitted and it is more than 99% for all the heights as shown in table 2. All profile parameters of wind speed for different height is shown in table 3 which include mean, standard error, median, standard deviation, kurtosis, skewness etc.
5
C
ONCLUSIONSiting of turbine as standalone or in wind farms greatly affected by its actual positioning, mean wind speed and standard deviation. In this paper mean speed of wind at three different elevation are analyzed. With the help of graphical method all three height Weibull shape and scale parameters were find out. At 150m height shape and scale parameters are 1.46 and 8.352. With the help or regression statistics were calculated value of multiple R, R square, adjusted R and standard error. Values of these were found 0.999.
2925
A
CKNOWLEDGMENTThe authors are grateful to National Institute of Wind Energy (Ministry of New and Renewable energy, Government of India) for their cooperation in providing metrological wind data for research purpose.
R
EFERENCES[1] I. S. S. R. S. K. L. M. A. Muhammad Shoib, "Assessment of wind energy potential using wind energy conversion system".
[2] S. Tiwari, N. Gupta "Performance evaluation of wind turbines on the basis of power generation," International journal of recent technology and engineering, vol. 8, no. 2, pp. 4396-4399, 2019.
[3] A. P. Takvor H. Soukissian, "Effects of different wind data sources in offshore wind power assessment," Renewable Energy, vol. 77, pp. 101-114, 2015.
[4] B. Hasche, "General statistics of geographically dispersed wind power," Wind Energy, vol. 13, pp. 773-784, 2010.
[5] N. E. A Gungor, "The characteristics that define wind as an energy source," Energy Sources, vol. 30, pp. 842-855, 2008.
[6] F. I. Z. C. Maduako E. Okorie, "Evaluation of wind shear coefficients, surface roughness and energy yield over inland locations in Namibia," Procedia Manufacturing, vol. 7, pp. 630-638, 2017.
[7] S. S. G. Gualtieri, "Wind shear coefficient, roughness length and energy yield over coastal locations in Southern Italy," Renewable energy, vol. 36, no. 3, pp. 1081-1094, 2011.
[8] D. G. Christoph W. Kent. Sue Grimmond, "Aerodynamic roughness".
[9] S. G. D. G. Christoph W. Kent, "Aerodynamic roughness parameters in cities: Inclusion of vegetation," Journal of wind engineering & Industrial Aerodynamics, vol. 169, pp. 168-176, 2017.
[10] J. Earnest, Wind power Technology, Delhi: PHI, 2014.
[11] E.-S. c. Agustin, "Estimation of extreme wind speeds by using mixed distribution," Engineering investigation and technology, vol. 14, no. 2, pp. 153-162, 2013.
[12] M. E. A. P. G. O. A. H. K. U. Asir Genc, "Estimation of Wind Power Potential Using Weibull Distribution," Energy Sources, vol. 27, no. 9, pp. 809-822, 2005.
[13] A. a. S. K. Qawasmi, "Effect Weibull Distribution Parameters Calculating Methods on Energy Output of a Wind Turbine: A Study Case," Int. J. of Thermal & Environmental Engineering , vol. 14, no. 2, pp. 163-173, 2017.
[14] P. R. J A Carta, "Analysis of two- component mixture Weibull statics for estimation of wind speed distribution," Renewable Energy, vol. 32, pp. 518-531, 2007.
[15] O. A. a. M. A. B. Jaramillo, "Wind speed analysis in La Ventosa, Mexico: a bimodal probability distribution case," Renewable Energy, vol. 29, no. 10, pp. 1613-1630, 2004.
[16] K. S. R. a. O. P. R. Murthy, "Estimation of Weibull parameters using graphical method for wind energy applications," in Eighteenth National Power Systems Conference (NPSC). IEEE, 2014.
[17] N. J. Cook, "Discussion on modern estimation of the parameters of the Weibull wind speed distribution for wind speed energy analysis," Journal of Wind Engineering & Industrial Aerodynamics, vol. 10, no. 89, pp. 867-869, 2001.