CLASSIFICATION OF DEFECTS USING
UNCERTAINTY TECHNIQUES
IN
INDUSTRIAL WEB INSPECTION
by
Duncan John Wilson
A Thesis Submitted for the Degree o f Doctor o f Philosophy
in the
Faculty o f Engineering
UNIVERSITY OF LONDON
January 1998
Department o f Mechanical Engineering
University College London
Torrington Place
ProQuest Number: U643020
All rights reserved
INFORMATION TO ALL USERS
The quality of this reproduction is dependent upon the quality of the copy submitted.
In the unlikely event that the author did not send a complete manuscript
and there are missing pages, these will be noted. Also, if material had to be removed,
a note will indicate the deletion.
uest.
ProQuest U643020
Published by ProQuest LLC(2015). Copyright of the Dissertation is held by the Author.
All rights reserved.
This work is protected against unauthorized copying under Title 17, United States Code.
Microform Edition © ProQuest LLC.
ProQuest LLC
789 East Eisenhower Parkway
P.O. Box 1346
Abstract
This research investigated how Artificial Intelligence techniques could be applied to industrial web
inspection to improve the process of classifying defects. It focuses on applying uncertainty techniques to
aid the construction of a classification scheme.
In many industrial process control situations, the need to identify and classify defects is key to enabling
process improvements. Inspection is used for this task. Constructing a classification scheme to correctly
identify defects in a product is difficult. Many people assume that a description o f what is to be identified
exists. That is not necessarily true.
The domain knowledge is vague and nearly always incomplete, and the constraints on inspection
equipment means the data output often produces ambiguous results. A method was required which would
allow such uncertainties to be incorporated into an automated visual inspection system. Fuzzy Set Theory
and Dempster Shafer were used to aid the development of the classification scheme. Fuzzy Set Theory
provided an intuitive numerical method for capturing knowledge about defects (for example, concepts
such as ‘defect has small area’) and Dempster Shafer provided a framework for processing such heuristic
knowledge so that a classification could be made.
The result was a set of rules where each rule had a fuzzy antecedent and a consequent describing a set of
possible defect types. Dempster Shafer was used to combine the consequants of the rules to calculate the
most likely outcome. For comparison with the output generated using Dempster Shafer, decision criteria
proposed by Smets and Wesley were implemented. The accuracy of the classification scheme and an
analysis against five desirable criteria for an inspection system are the focus of the discussion.
An experimental rig was constructed using a linescan CCD camera to simulate a production line. Real
Acknowledgements
First I would like to thank my supervisors, John Giiby, Alistair Greig and Robert Smith for their support
during my PhD years. John for the numerous discussions on inspection, uncertainty and object oriented
design, Alistair for his direction along the path of PhD research and Bob for always having an open door
at Sira.
I would also like to thank those people who made my working environment so pleasurable. In the Control
Lab at UCL, Jason for always being one step ahead of me in the PhD process, Alex for knowing when to
take me to the park to reflect on what I was doing, Szen for taking time to proof read this thesis, and
finally, for making me laugh, Susi, Nader, William, Hugh, Raju, Dave, Sarah, Habib and Patrick, who
complete the Control Lab social circle. At Sira I would like to thank Chris, Sarah, Robin, Mark and Neil
for the many suggestions they made over the years which have not necessarily had anything to do with
this thesis.
Since this PhD was undertaken as a collaboration between industry and academia I mention the staff at
Sira Technology Centre, Image Automation Ltd., the Centre for Advanced Instrumentation Systems, the
Department of Mechanical Engineering and UCL Graduate School for always supporting me and taking
time to listen to my queries.
Finally, thanks to my wife Imelda for her continual support and belief in me.
Contents
CONTENTS... 5
FIGURES... 9
TABLES...12
NOTATION... 13
INTRODUCTION... 14
1.1 A FRAMEWORK FOR AUTOM ATED VISUAL INSPECTION... 15
1 .2 Th r e es o u r c e so fu n c e r t a i n t y... 17
1 .3 Fi v ec r i t e r i af o r a n i n s p e c t i o ns y s t e m... 2 0 1 .4 Su m m a r y...2 2 MACHINE VISION AND DEFINITION OF PROBLEM... 24
2 .1 Th em a c h i n ev i s i o ni n d u s t r y... 2 5 2.1.1 Conventional machine vision systems...25
2.1.2 Beyond conventional systems...27
2 . 2 Th ed i f f e r e n c eb e t w e e n d e t e c t i o na n d c l a s s i f i c a t i o n i nAVI...2 8 2 .3 Wh yc l a s s i f i c a t i o n i sd i f f i c u l t i ni n s p e c t i o n... 3 2 2 . 4 Th ew e b i n s p e c t i o n p r o c e s s... 3 5 2 .5 Th ed a t a p r o d u c e db y t h ei n s p e c t i o n s y s t e m... 4 1 2.5.1 Limitations in the data...44
2.5.2 Man and machine ‘se e ’ differently...45
2 . 8 Su m m a r y... 5 0
MACHINE VISION AND CLASSIFICATION...52
3 .1 Cl a s s i f i c a t i o n T H E O R Y ...5 2 3.1.1 Statistical Techniques...53
3.1.2 Machine Learning...55
3.1.3 Neural Networks...57
3 . 2 Ex i s t i n gt e c h n o l o g yi n r e l a t i o nt o w e bi n s p e c t i o n...5 8 3 .3 Un c e r t a i n t y Ma n a g e m e n t Te c h n i q u e s... 5 9 3.3.1 Probability Theory...60
3.3.2 Dempster Shafer - Theory o f Evidence...62
3 .3 .2 .1 E x a m p le to sh o w b a sic c o n c e p ts o f D em p ster S h a fer T h e o r y ... 6 4 3 .3 .2 .2 W h y D em p ster S h afer is u se fu l fo r in sp e c tio n ...6 8
3.3.3 Fuzzy Set Theory...68
3 . 3 .3 .1 A n e x a m p le and th e b a sic c o n c e p ts o f fu z z y set th e o r y ...6 8
3 .3 .3 .2 F u z z y se t th e o ry in relation to th is t h e s is ...7 0 3 . 4 Su m m a r y...7 1
UNCERTAINTY TECHNIQUES AND CLASSIFICATION... 73
4 .1 Fu z z y l o g i c f o rr e p r e s e n t i n gv a g u e a n d i n c o m p l e t e i n f o r m a t i o n... 7 4 4.1.1 How Fuzzy Set Theory has been used....75
4 . 2 De m p s t e r Sh a f e rf o rr e p r e s e n t i n gi n c o m p l e t ea n d a m b i g u o u sd a t a... 7 8 4.2.1 How Dempster Shafer has been used....79
4 .3 A HYBRID APPROACH...8 3 4 . 4 Su m m a r y...8 7
EXPERIMENTAL METHOD...88
5 .1 A FRAMEWORK FOR AUTOM ATED VISUAL INSPECTION...8 8
5 .2 Th em a c h i n ev i s i o n s y s t e m - Ha r d w a r e...9 0 5.2.1 The design brief....90
5.2.2 Synthesis o f design...91
5 .2 .2 .1 T h e C C D L in e sca n C a m e r a ... 93 5 .2 .2 .2 T h e fram egrab ber... 9 4 5 .2 .2 .3 T h e p o sitio n in g actuator and in te r fa c e ...9 4 5 .2 .2 .4 T h e lig h t s o u r c e ...9 5 5 .2 .2 .5 T h e fra m e w o rk ... 9 6 5 .2 .2. 6 T h e d e fe c t sa m p le s...9 6
5 .2 .2 .7 T h e P C ... 9 6 5.2.3 Discussion o f performance o f hardware...96
5 .3 Th e m a c h i n ev i s i o n s y s t e m - So f t w a r e... 9 9
5.3.1 Conceptual design...99
5.3.2 Control o f actuator...101
5.3.3 Image capture...104
5.3.4 Feature detection...105
5.3.5 Output from inspection system...107
5 .4 Su m m a r y...10 8 THE CLASSIFICATION SYSTEM... 109
6 .1 Th ec l a s s i f i c a t i o n s y s t e m - s o f t w a r e...1 1 0 6.1.1 The inputs to the classification system...110
6 .1 .1 .1 M eth o d fo r c r e a tin g fu z z y n u m b ers (C R u le D a ta )... 112
6.1 .1 .2 M e th o d s fo r im p le m e n tin g D em p ster S h afer (C S e t) ... 115
6.1.2 Creating evidence fo r possible defect types (CeList)...117
6.1.3 Methods fo r Decision Making...118
6.1.4 Summary...122
6.2 Cr e a t i n ga c l a s s i f i c a t i o ns c h e m e...1 2 2 6.2.1 Sources o f information...124
6 .2 .1 .1 T rain in g d a ta ... 124
6 .2 .1 .2 E xp ert k n o w le d g e ...124
6 .2 .1 .3 T e st d a ta ...127
6.2.2 The ‘normal’ ruleset...127
6 .2 .2 .1 C o n stru ctin g th e r u le s e t ...128
6 .2 .2 .2 D if f ic u lt ie s ... 129
6 .2 .2 3 T h e R u l e s ... 130
6.2 .2 .4 A sa m p le ou tp u t fro m the ‘n o rm a l’ ru leset u sin g test d a t a ...133
6.2.3 The normal ruleset as a benchmark...137
6 .3 Ex p e r im e n t a l De s i g n... 1 3 9 6 .4 Su m m a r y... 1 4 7 RESULTS... 148
7 .1 Fo r m a t OF THE Re s u l t s... 14 8 7 .2 Su m m a r yo f Ex p e r i m e n t s... 1 4 9 7 .3 Ex p e r i m e n t a l Re s u l t s... 1 4 9 DISCUSSION...166
8.1 Th ep e r f o r m a n c eo ft h ei n s p e c t i o ns y s t e m...1 6 6 8 .2 Co m m e n t so n t h ee x p e r i m e n t s...1 7 0 8.2.1 Results o f adding information to ruleset...170
8.2.2 Results o f deleting information from ruleset...171
8.2.4 Results o f not using fuzzy antecedents and changing structure o f consequents...173
8.2.5 Results from different people defining rules...174
8 .3 Co m m e n t so nt h eo v e r a l ls u c c e s so ft h e f i v e c r i t e r i a...1 7 5 8 .4 Re v i e w o f t h et h r e es o u r c e so f u n c e r t a i n t y... 1 7 8 8 .5 Su m m a r y...1 8 0 CONCLUSIONS...182
APPENDIX A - EQUIPMENT SPECIFICATIONS... 188
A . 1 Su r v e ya n d c o s ta n a l y s i so fh a r d w a r e...1 8 8 A . 2 Ca m e r a / i m a g ep r o p e r t i e s... 1 9 0 A .3 Bl o c k d i a g r a m sf o rc a m e r a a n d f r a m e g r a b b e r... 1 9 0 APPENDIX B - CODE USED TO GET IMAGE OF DEFECT...194
APPENDIX C - CODE USED IN CLASSIFICATION SCHEM E... 203
APPENDIX D - DETAILED TABLE OF RESULTS... 223
APPENDIX E - COMBINING EVIDENCE IN DEMPSTER SHAFER...230
Figures
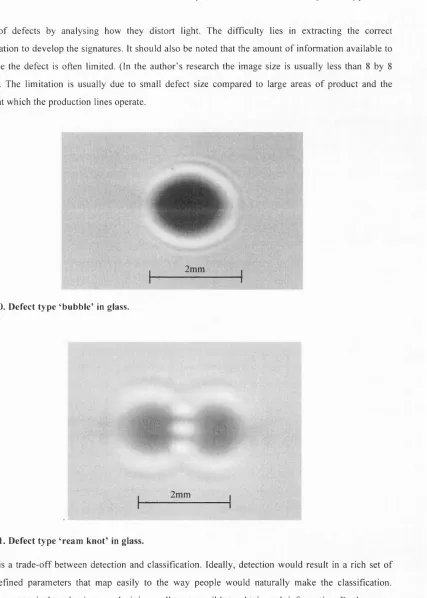
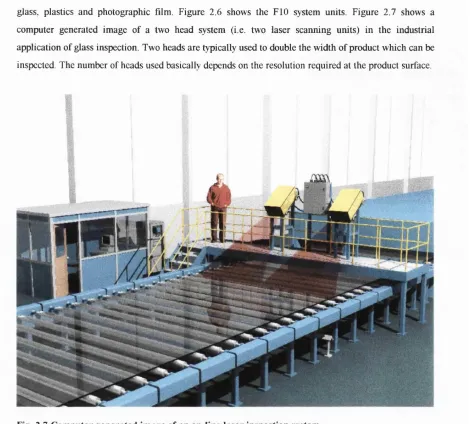
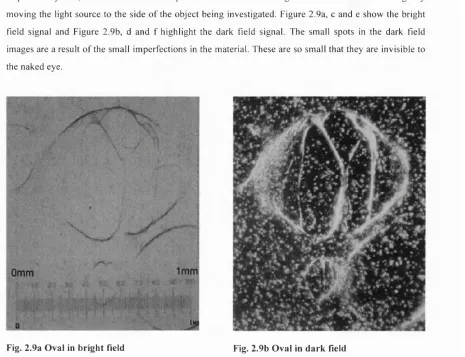
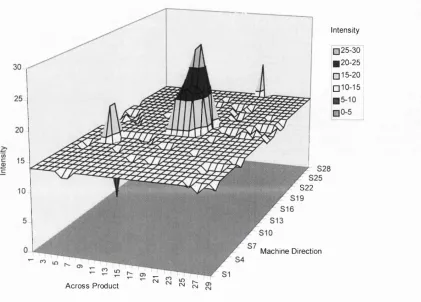
Fi g. 1 .0 Th ep r o d u c t i o np r o c e s s a n d t h ei n s p e c t i o n s y s t e m... 1 7 Fi g. 2 . 0 . De f e c t TYPE ‘b u b b l e’ i n g l a s s...3 0 Fi g. 2 . 1 . De f e c t TYPE ‘r e a m k n o t’ i ng l a s s...3 0 Fi g. 2 . 3 . Th ei n f o r m a t i o n w h i c hg o e si n t o M Y C I N ... 3 3 Fi g. 2 . 4 In f o r m a t i o ni na n i n s p e c t i o n e x p e r t s y s t e m...3 4 Fi g. 2 .5 On ew a ym a p p i n gb e t w e e n d e f e c tc h a r a c t e r i s t i c s a n d c l a s s i f i c a t i o n... 3 4 Fi g. 2 . 6 Th e F IO l a s e ri n s p e c t i o n s y s t e m (c o u r t e s y Im a g e Au t o m a t i o n Lt d. ) ...3 5 Fi g. 2 . 7 Co m p u t e rg e n e r a t e d i m a g eo fa n o n-l i n el a s e r i n s p e c t i o n s y s t e m... 3 6 Fi g. 2 .8 Cr e a t i n ga 2 D i m a g ew i t h al i n e s c a n C C D ... 3 7 Fi g. 2 . 9a Ov a li n b r i g h tf i e l d... 3 9 Fi g. 2 . 9b Ov a li n d a r k f i e l d... 3 9 Fi g. 2 . 9c Fi s h e y ei n b r i g h tf i e l d... 4 0 Fi g. 2 . 9d Fi s h e y ei n d a r kf i e l d...4 0 Fi g. 2 . 9e Du s ti n b r i g h tf i e l d...4 0 Fi g. 2 . 9f Du s ti n d a r kf i e l d...4 0 Fi g. 2 . 1 0 In t e n s i t ym a p, f i s h-e y e d e f e c ti n p l a s t i cf i l m...4 2 Fi g. 2 .1 1 Th r e s h o l di m a g e so ff i s h-e y e d e f e c t...4 3 Fi g. 2 . 1 2 In s p e c t i o nd a t af o rf i s h-e y ed e f e c t...4 3 Fi g. 2 . 1 3 a c l a s s i f i c a t i o no fu n c e r t a i n t y ( Kr a u s e a n d Cl a r k (p g. 7 ) [ 1 9 9 3 ] ) ... 4 7 Fi g. 3 . 0 Ve n nd i a g r a m o f Q a n d H , ... 6 5 F ig . 3 .1 V e n n d i a g r a m t o s h o w i n t r o d u c t i o n o f H2...6 6
F ig . 3 .2 V e n n d i a g r a m t o s h o w i n t r o d u c t i o n o f H4...6 6
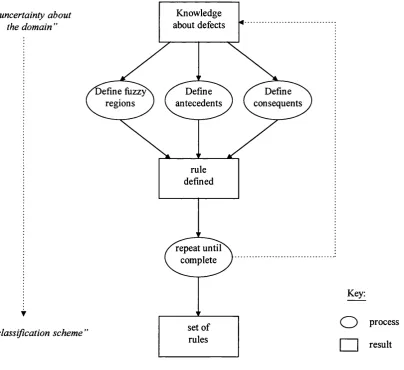
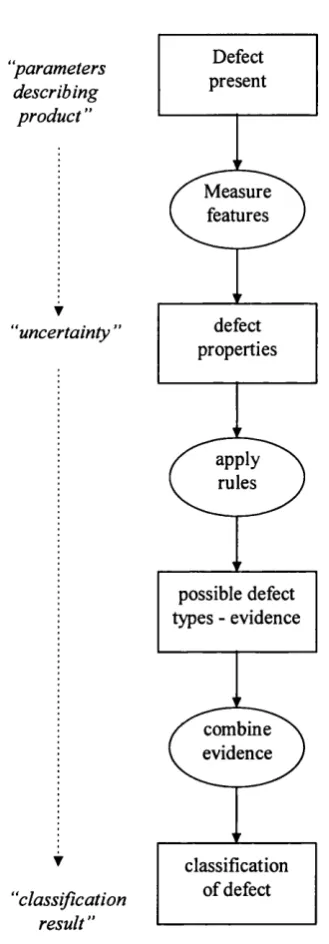
Fi g. 4 .1 A Fu z z y REGION t o i l l u s t r a t e N O T h e d g e... 7 7 Fi g. 4 . 2 Ou t p u tf r o m c l a s s i f i c a t i o n c o d et oh i g h l i g h t De m p s t e r Sh a f e rr e s u l t...8 0 Fi g. 4 . 3 Sy s t e m v i e w f l o w d i a g r a m - d e f i n i t i o no fr u l e s... 8 3 Fi g. 4 . 4 Sy s t e m v i e w f l o w d i a g r a m - i m p l e m e n t a t i o n o fr u l e s... 8 4 Fi g. 4 . 5 Ap p l y i n gt h e c a m e r a d a t at ot h er u l e s... 8 5 Fi g. 5 . 0 A FRAMEWORK FOR AUTOM ATED INSPECTION... 8 9 Fi g. 5 .1 Sc h e m a t i co fe x p e r i m e n t a l r i g... 9 1 Fi g. 5 . 2 Ph o t o g r a p h o fe x p e r i m e n t a lr i g...9 2 Fi g. 5 .3 C C D Ca m e r aw i t hl e n s i n p l a c e (l e f t) a n d s h o w i n gs e n s o r (r i g h t) ... 9 3 Fi g. 5 . 4 Po s i t i o n i n g a c t u a t o ra n d s a m p l em o u n t...9 5 Fi g. 5 .5 Cr o s s s e c t i o no fr i gt o s h o w d a r ka n db r i g h t f i e l dc o n f i g u r a t i o n s... 9 7 Fi g. 5 . 6 In t e r f a c et oe x p e r i m e n t a lr i g...9 8 Fi g. 5 . 7 Al i g n m e n to fd a r k f i e l dm a s k...9 8 Fi g. 5 . 8 Fl o w d i a g r a m f o re x p e r i m e n t a l r i gs o f t w a r e... 1 0 0 Fi g. 5 . 9 Pr o c e d u r ef o ro b t a i n i n g r a w i m a g e...1 0 2 F iG . 5 . 1 0 In t e n s i t ym a po fd e f e c t u s e df o r r e g i s t r a t i o nt e s t... 1 0 3 Fi g. 5 .1 1 Gr a p ht os h o w p o s i t i o n i n ge r r o r i na c t u a t o r...1 0 4 Fi g. 5 . 1 2 Bi t m a p TO i l l u s t r a t e A R E A m e a s u r e m e n t... 1 0 5 Fi g. 5 . 1 3 Bi t m a p TO i l l u s t r a t e W I D T H m e a s u r e m e n t...1 0 6 Fi g. 5 . 1 4 Bi t m a pt oi l l u s t r a t e L E N G T H m e a s u r e m e n t... 1 0 6 Fi g. 5 . 1 5 Bi t m a p TO i l l u s t r a t e % A R E A m e a s u r e m e n t...1 0 6 Fi g. 5 . 1 6 Bi t m a p TO ILLUSTRATE W I D T H : L E N G T H RATIO...1 0 6 Fi g. 5 . 1 7 Sa m p l eo u t p u tf r o m m a c h i n ev i s i o n s y s t e m... 1 0 7 Fi g. 6 . 0 Th ef o u re l e m e n t s o ft h e c l a s s i f i c a t i o n s o f t w a r e... 1 1 0 Fi g. 6 .1 Th ei n p u t st ot h ec l a s s i f i c a t i o ns o f t w a r e... 1 1 2 Fi g. 6 . 2 Th es h a p e o ff u z z yr e g i o n sa v a i l a b l ei n C Fu z z yNu m b e r... 1 1 3 Fi g. 6 . 3 Da t a Ty p e C Ru l eDa t a... 1 1 3 Fi g. 6 . 4 Fu z z yr e g i o n f o rd a r kf i e l dp e r c e n t a g ea r e a...1 1 4 Fi g. 6 . 5 Fu z z yr e g i o n f o rb r i g h tf i e l dw i d t h / l e n g t h r a t i o... 1 1 4 Fi g. 6 . 6 Cl a s s s t r u c t u r ef o rd e s c r i b i n g s e t s...1 1 6 Fi g. 6 . 7 Cl a s s e s CeLi s ta n d C Ev i d e n c e... 1 1 7 Fi g. 6 . 8 Co m b i n e d e v i d e n c ei n a l i n k e d l i s t...1 1 9 Fi g. 6 . 9 Fl o w d i a g r a m t o s h o w i n p u t st oc l a s s i f i c a t i o ns o f t w a r e...1 2 3 Fi g. 6 . 1 0 Da t a s h e e t f r o m t r a i n i n g d a t af o rf i s h e y e d e f e c t (u n i t si n p i x e l s) ... 1 2 5 Fi g. 6 .1 1 Th r e s h o l d e di m a g e so ff i s h e y ed e f e c t f r o m t r a i n i n gd a t a... 1 2 6 Fi g. 6 . 1 2 Fu z z y Re g i o n f o r Br i g h t Fi e l d Wi d t h/ Le n g t h r a t i ow i t h e x a m p l ei m a g e...13 1 Fi g. 6 . 1 3 Fu z z y Re g i o n f o r Da r k Fi e l d Wi d t h/ Le n g t hr a t i o... 1 3 2 Fi g. 6 . 1 4 Fu z z y Re g i o n f o r Da r k Fi e l d % Ar e aw i t h e x a m p l ei m a g e...1 3 2
Fi g. 6 .1 5 Fu z z y Re g i o nf o r Br ig h t Fie l d % Ar e a... 13 2
Fi g. 6 .1 6 Lis t i n go fr e s u l t sf o r Fis h_e y ed e f e c tu s i n gn o r m a l r u l e s e t...13 4
Fi g. 6 .1 7 Po s s i b l eo u t c o m e s w h e nc l a s s i f y i n g Ge l s... 1 35
Fi g. 6 .1 8 Po s s i b l eo u t c o m e s w h e nc l a s s i f y i n gf i b r e s... 13 6
Fi g. 6 .1 9 Cl a s s i f i c a t i o nd a t a u s i n gn o r m a lr u l e s e tw i t ht e s td a t a... 1 3 6
Fi g. 6 .2 0 Cl a s s i f i c a t i o nd a t a u s i n gn o r m a lr u l e s e tw i t ht r a i n i n gd a t a... 13 7
Fi g. 6 .2 1 Re s u l t s s h o w i n gp r o b l e me n c o u n t e r e dw i t hi n s u f f i c i e n tr e a s o n p r i n c i p l e...13 8
Fi g. 6 .2 2 Gr a p h st o s h o w c h a n g ef r o mf u z z yt o c r is pn u m b e r a tm i d-p o i n t... 141
Fi g. 6 .2 3 Gr a p h st o s h o w c h a n g ef r o mf u z z yt oc r i s pn u m b e rn e a r t r u e...143
Fi g. 6 .2 4 Gr a p h st o s h o w c h a n g ef r o mf u z z yt oc r i s pn u m b e rn e a r f a l s e... 1 4 4
Fi g. 6 .2 5 Gr a p ht os h o w f u n c t i o nu s e df o r Mr. Op t im is t icv i e w p o i n t...145
Fi g. 6 .2 6 Gr a p ht os h o wf u n c t i o nu s e d f o r Mr. Pe s s im i s t i cv i e w p o i n t...1 4 6
Fi g. 7 .0 La y o u to fr e s u l t sf o r m...1 4 8
Fi g. 7 .1 Re s u l t s - No r m a l Ru l e s e t...1 5 0
Fi g. 7 .2 Re s u l t s - Ex p e r im e n t 1 ... 151
Fi g. 7 .3 Re s u l t s - Ex p e r im e n t 2 ... 1 5 2
Fi g. 7 .4 Re s u l t s - Ex p e r im e n t 3 ... 1 53
Fi g. 7 .5 Re s u l t s - Ex p e r im e n t 4 ... 1 5 4
Fi g. 7 .6 Re s u l t s - Ex p e r im e n t 5 ... 1 55
Fi g. 7 .7 Re s u l t s - Ex p e r im e n t 6 ... 1 5 6
Fi g. 7 .8 Re s u l t s - Ex p e r i m e n t 7 .... i... 1 5 7
Fi g. 7 .9 Re s u l t s - Ex p e r im e n t 8 ... 15 8
Fi g. 7 .1 0 Re s u l t s - Ex p e r im e n t... 9 ...1 5 9
Fig. 7 .1 1 Re s u l t s - Ex p e r im e n t 1 0 ...1 6 0
Fi g. 7 .1 2 Re s u l t s - Ex p e r im e n t 1 1 ...161
Fi g. 7 .1 3 Re s u l t s - Ex p e r im e n t 1 2 ...1 6 2
Fi g. 7 .1 4 Re s u l t s - Ex p e r im e n t 1 3 ...163
Fi g. 7 .1 5 Re s u l t s - Ex p e r im e n t 1 4 ...1 6 4
Fi g. 7 .1 6 Re s u l t s - Ex p e r im e n t 1 5 ...165
Fi g. 8 .0 We s l e ya n d De m p s t e r Sh a f e rr e s u l t sf r o me x p e r i m e n t 5 ... 16 8
Fi g. a. 1 Ca m e r a / p r o d u c tp ix e ls i z e... 1 9 0
Fi g. A .2 Fu n c t i o n a lb l o c kd i a g r a m o f A M - D I G 1 6 D d ig it a la c q u i s i t i o nb o a r d... 191
Fi g. A .3 Fu n c t i o n a lb l o c kd i a g r a m o f C L -C 3 l i n es c a nc a m e r a... 1 9 2
Fi g. a .4 Fu n c t i o n a lb l o c kd i a g r a mo f M F G f r a m e g r a b b e r [M F G 1 9 9 3b] ... 1 93
Tables
Ta b l e 5 .0 Op e r a t i o n su s e di n C Ta b l e...10 1 Ta b l e 5 .1 Op e r a t i o n s u s e di n C Gr a b b e r...1 0 2 Ta b l e 6 . 0 Da t at y p e su s e dt o c o n s t r u c ta r u l e... 1 1 1 Ta b l e A . 1 Co s t a n a l y s i so ff r a m e g r a b b e ra n d c a m e r a...1 8 9
Notation
In general italicised roman letters are used to represent variables such as lengths and capitalised roman
letters denote an object which is a member of a set. The use of the courier font in the running text denotes
an object defined in software. Larger sections of code are clearly separated from the running text. The
character * is used as a wildcard.
Roman symbols
A ,B ,C
a
w
I
Hi
U
M eaning
Reference names for threshold images
Area in slice A, B, C
Width in slice A, B, C
Length in slice A, B, C
hypothesis (a set o f possible defect types)
universe of discourse (Fuzzy Set Theory)
G reek symbols
Q
0
Meaning
frame o f discernment (Dempster Shafer)
empty set (Dempster Shafer)
Miscellaneous
%Area
w/1
UMT
AVI
expert
OHP
b.p.a.
M eaning
Percentage area measured in slice A, B, C
Width divided by length measured in slice A, B, C
Uncertainty Management Technique
Automated Visual Inspection
a person who uses / develops the inspection system
Overhead Projector
Basic Probability Assignment (Dempster Shafer)
Chapter 1
Introduction
The aim of this research is to investigate techniques for classifying objects of interest into different
classes where the data describing the objects is prone to the uncertainties of the real world. Two aspects
o f classification were identified in this problem domain. The first describes what input data is used, the
second describes the algorithms used to make the classification. The aim of this research is not to select
the best classification algorithm available given some input data. This thesis proposes that, to improve the
method by which classification schemes can be generated using real world data, there is a need to allow
for the representation of the uncertainties in the data used as input.
The objective of the research is to:
• analyse the techniques which can be used to represent uncertain data.
• analyse how this benefits the generation o f a classification scheme.
The research does not:
• identify the best classification algorithm for web inspection.
To satisfy the objectives of this research an experimental rig was constructed to test the proposed
techniques. A real inspection problem was analysed and three types of uncertainties in the input data
highlighted. This enabled the description o f the properties required to generate a classification scheme for
this application o f web inspection. The five desirable properties for web inspection are described later in
this chapter. Using these properties an assessment was made to identify how the techniques used for
representing uncertainty made the task of generating a classification scheme easier. The remainder of this
chapter introduces inspection.
In many industrial process control situations, the need to identify and classify defects is key to enabling
Chapter 1 - Introduction
to be gained from increased throughput, improved product quality and unit cost reduction. In other
words, providing more of a better product at a lower price.
As modem manufacturing processes become more advanced, the inspection tasks required to monitor
them become more complex. As a result automated inspection is required. The benefits of automating
processes are well known; humans typically suffer from fatigue, inconsistency and slowness, whereas
machines offer repeatability, accuracy and efficiency [Bayro-Corrochano 1993b, Rao 1996, Smith and
Hopkins 1994]. This thesis will concentrate on inspection using machine vision or Automated Visual
Inspection (AVI).
One o f the major obstacles in the development of AVI systems has been making them robust enough to
work in different situations. Indeed many of the successful applications to date have been bespoke
systems working in highly constrained environments. There is a need to reduce this specialisation and
aim to make AVI systems more flexible [Newman and Jain 1995]. The difficulty lies in developing
methods which enable inspection systems to reason and make decisions within the world they are
situated. As inspection system designers try to make their systems more able to make finer distinctions
between defect categories, and applicable to a wider range o f inspection tasks, they need better ways in
which to use the information detected by their inspection systems.
Inspection tasks require substantial visual abilities which humans quite often take for granted. Inspectors
find it very difficult to express what characterises a defect. Invariably they will just ‘know’ what type it is
from experience. It is very difficult to capture this experienced knowledge in a form that could be
developed in an AVI system. There is a false common assumption that precise descriptions o f defects
exist. As a result, the information available to engineers setting-up AVI systems is uncertain. This thesis
investigates how uncertainty management techniques (UMTs) can be applied to model such uncertainty.
The thesis also describes how the techniques have been applied to a real inspection problem.
The following sections discuss AVI in the context of an industrial setting and declares three forms of
uncertainty present in this application. In the next section, five desirable properties for an inspection
system are introduced. It is argued that for these five criteria to be met it is necessary to develop systems
that will allow the expert to represent the three forms of uncertainty in their inspection system. The
remainder of this chapter expands this argument and proposes a way forward.
1.1 A framework fo r automated visual inspection
This research focused on the application of Automated Visual Inspection. In particular the thesis looks at
web inspection, the process used to inspect continuously manufactured products such as paper, textiles,
glass and plastic films. Web inspection shall be discussed in detail in chapter 2. To appreciate how and
Chapter 1 - Introduction
why this research has been applied to this application it is necessary to investigate the environment in
which web inspection is used.
Inspection is the task o f examining and reporting. The former task, also referred to as detection, involves
analysing an object to identify characteristics or features which could be used for identification. The latter
task uses the features obtained through detection to return some information about the object being
analysed. The information returned classifies the object into a predefined category. The objective of this
report, or classification, is to assess the state o f the product being analysed. The reason for wanting the
assessment is simply to satisfy customers.
The customers who want the classification may not only be the end users of the product (i.e. external
customers), but also sections within the same factory (i.e. internal customers). For example. Production
might want to know the status of the materials they are producing, in order to assess their machines, or
Sales might want to know what quality Production are achieving in order to target customers. Inspection
provides manufacturers with vital information about the product they are making and the process by
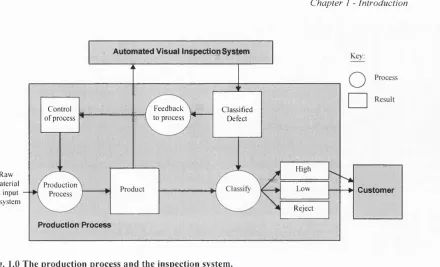
which it is made. Figure 1.0 shows a flow diagram for a typical production process.
At the lower left comer o f figure 1.0 raw material is input to the production process. The result is the
product being manufactured. The product is then classified, graded, and shipped to the customer. The aim
o f the AVI system is to automate the classifying process. Given that an inspection system can be used in
parallel to the production process, the information gathered on the classified product can also be used to
control the process. Figure 1.0 illustrates this feedback loop. Whilst the figure represents the overall
production process, it should be noted that inspection is also applied to smaller parts of the process.
Assuring the quality at intermediate stages has the benefit that it can simplify later stages of production
and avoids the company adding value to something which will ultimately be scrapped. For example, in
the production of plastic films for use on overhead projectors (OHPs), if the film is going to be coated for
high quality inkjet printing, then one doesn’t want to coat defective product.
By using an inspection system, there are two main impacts on the production process. As a result of
classifying defects, information can be fed back to production leading to improvements in the process.
This greater control over the production process implies engineers can identify the optimum operating
point of their production facility, and then, through control of the process, ensure they operate at that
point. The second benefit is the ability to know the quality of the product being produced. Through
monitoring the product being manufactured it should be possible to highlight areas and ways in which the
process could be improved. In turn this implies improvements to the end product.
Chapter I - Introduction
« Automated Visual Inspection System
. . j _____
Raw Material
as input to system
Production Process
1
Control Feedback Y -W..- Classified o f process ^ f ’ t to process Defect
Production Process
High Low Reject
-► Customer
Fig. 1.0 The production process and the inspection system.
W hilst th e m o tiv a tio n s fo r u sin g in sp ectio n sy stem s are clea r, it is also n e c e ssa ry to in v e stig a te th e e n v iro n m e n t in w h ich an A V I sy stem is situ ated . A n im p o rta n t fe a tu re on the flo w d ia g ra m is the in teractio n o f th e in sp ectio n sy stem w ith th e p ro d u c tio n p ro cess. It sh o w s th e A V I system m u st w o rk w ith in th e co n stra in ts o f th e fa c to ry e n v iro n m e n t. T h is m e a n s th at fo r th e sy stem to be u sefu l it m u st tak e into c o n sid e ra tio n facto rs su ch as; th e o p e ra tin g p a ra m e te rs o f th e p ro d u c tio n line, th e ty p e s o f p ro d u c t to be inspected an d v a ria tio n s w h ic h o c c u r in th e e n v iro n m e n t (e.g. clim a tic ch a n g e s, c h a n g e s to th e p ro d u c tio n facility, sh ift c h a n g e s etc.). A fa c to ry e n v iro n m e n t is c o n tin u a lly ev o lv in g .
A n o th e r im p o rtan t in teractio n w h ich is no t m a rk ed on th e flow d ia g ra m is th e in teractio n w ith th e cu sto m e r. T he c u sto m e r sp e c ifie s th e q u a lity to w h ich a p ro d u c t m u s t be m ad e. T h e sp e c ific a tio n w ill o fte n v ary acc o rd in g to th e c u sto m e rs en d use o f th e p ro d u c t. F o r e x a m p le , as a re su lt o f cu ltu ral d iffe re n c e s , Ja p a n e se c u sto m e rs m ay e x p e c t a h ig h e r sta n d a rd o f q u a lity th an th e ir W estern c o n te m p o ra rie s. T h u s, if a c u sto m e r is su p p ly in g into d iffe re n t m a rk e ts th ey m ig h t h av e d iffe re n t in te rp re ta tio n s o f q u a lity levels. A lte rn a tiv e ly , th e level o f a c c e p ta b le q u a lity m ay d e p e n d on th e a m o u n t o f p ro d u c t av ailab le in th e o p en m ark et. T h is m e a n s th at a c u sto m e r m ay fin d it h a rd to p ro v id e a d e ta ile d d e sc rip tio n o f the ty p e s o f d e fe c t th e y w ish to h av e classified . T h e p ro c e ss o f c a p tu rin g k n o w le d g e ab o u t d e fe c ts is d ifficu lt. T h is h ig h lig h ts th e false a ss u m p tio n , id en tified e a rlie r, th a t a d esc rip tio n o f w h a t is to be id en tified exists. C h a p te r 2 d is c u sse s w h y th is k n o w le d g e a c q u isitio n ta sk is d ifficu lt.
1.2 Three sources o f uncertainty
T h is sectio n shall d efin e w h a t is m e a n t by u n c e rta in ty an d w ill in tro d u c e th e th ree m ain so u rc e s o f u n c e rta in ty w hich are in h e re n t in th is ap p licatio n .
Chapter 1 - Introduction
The Oxford English Dictionary suggests that if something is uncertain then it is “not certainly known, not
to be depended on,” or is “changeable”. This thesis suggests that much of the information used to
describe a real industrial environment and industrial inspection can be categorised in the above manner.
Most businesses are continually under pressure to improve and new products are reaching the market
place with shorter and shorter lead times. A production environment is never standing still, it changes.
The motivation for this work is to incorporate this change by recognising that the information used to
model the inspection environment is uncertain. The goal of this research is to develop an inspection
system which takes into account these forms of uncertainty in an AVI system.
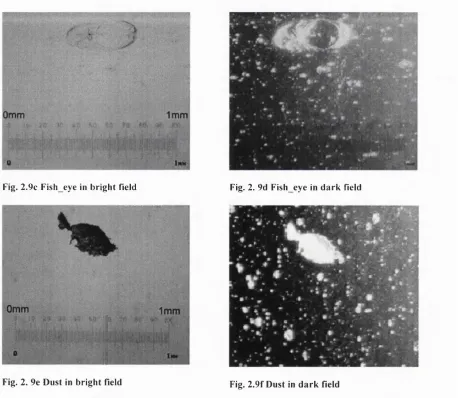
To illustrate why information in the inspection environment is uncertain an example of the type o f defect
to be classified shall be introduced. A gel is a defect which occurs in plastic films such as those used in
the manufacture o f OHP acetates, plastic bags, food wrap etc. The defect itself is the result of a local area
o f resin with different physical properties to the surrounding product and looks like a small spot. A gel in
an OHP acetate can quite often go unnoticed until it is viewed under the magnified display of the OHP.
Since the change in physical properties of the gel causes a lens like structure, the changes in the light
patterns as light is projected through the defect is quite noticeable on the projector screen. The
concentration of light through the lens shape o f the gel causes bright or dark spots to be visible on the
screen.
When people describe defects their interpretation is subjective since it relies upon what they see. This
leads to a very simple question.
What is and what is not a defect?
Whilst the question appears to be straightforward, the answer is invariably quite difficult. Using the
example of the gel in the OHP acetate, when questioned about the size of defects people will normally
respond with vague descriptions such as; ‘about 2mm’. The defect in this example generates this vague
response since it is very difficult to distinguish the point where the defect starts or stops diffracting the
light which causes the light pattern on the OHP screen. In addition, since the point at which this transfer
occurs is subjective, people are free to make their own interpretations as to the defining point between
defect and non-defect. It is therefore difficult to answer the general question raised above since there is
no sharp dividing line between defect and non-defect and different people work to different tolerances.
The purpose o f an AVI system is to try and make a distinction between defect and non-defect. In current
systems, a design decision is made which defines the boundaries of a class of defect. The definition of
such boundaries is very difficult since you don’t want the regions to miss a defect but you also don’t want
Chapter 1 - Introduction
the regions to be so broad that they catch other types of defect. A method for making the definition of the
boundaries more intuitive would be useful.
The problem described above is a result o f the natural variation in the product being inspected. Gels are
always present at some level in the product since they are caused by the method o f manufacture. The
severity o f the gels is dictated by the quality of the production method and the quality o f the raw material.
As a consequence the nature of gels observed at a company producing premium quality OHP acetates and
those at a company producing economy OHP acetates will be different. Both companies will have
different opinions as to what severity of gel constitutes a defect. The problem in this domain is not to test
whether a discrete item, such as a nut or a bolt, is on a production line, rather it is to make an assessment
of the product quality. In the case of gels, this might mean distinguishing when the volume of gels creates
defective product. For premium quality OHP acetates one would expect a low volume of gels. For
economy OHP acetates one would accept a higher volume o f gels. The borders between classes, such as
defect and non-defect, are not always obvious or discrete. The variation in the defects possible is
continuous.
The end use of the product also has an impact on the way it should be classified. The location o f the
defect in the plastic film may change one’s perception on whether it is a defect or not. For example,
imagine an outdoor scene was to be printed on one of the OHP acetates. A defect in the clear blue sky
might be visible whereas the same defect if situated in the dense foliage might not be. Taking into
consideration the end use of the product potentially enables one to allow some defects to be passed, hence
reducing the amount of scrap.
The above paragraphs have described an environment where the information available for making
classifications of defects is vague. This type o f uncertainty is a result of the heuristics which humans tend
to use to make classifications. Another source of uncertainty is the inability to describe a complete
domain model. The fact that the production environment is continually evolving means that any model of
the system will soon become obsolete, however using samples to define a model has been the primary
method by which automated inspection systems have been set-up. Variation in customer requirements
according to the current market climate also influence what constitutes a defect. For example, if there is
little product available on the market they will be more inclined to settle for lower quality product.
Conversely if they have the option of buying from several suppliers they will opt for high quality
product. Sample data is not enough to design a classification scheme. Data on the characteristics o f the
product and the process are also required. The experienced knowledge o f an inspector should be defined
within the classification scheme.
Chapter 1 - Introduction
The level of data available for classifying defects highlights the final source of uncertainty. It is possible
to get inspection data from any product moving at any production speed, but as the area o f product
inspected per second goes up then the amount of information for each defect goes down. One could
throw more sensing hardware at the problem however there are usually limits on the resources available.
A general trade-off should be evident between the volume of product which can be inspected and the
precision of the information returned. When trying to identify defects less than 1mm in size across a
product 2 metres wide moving at up to 200 metres per minute, the information available to make the
classification will be quite basic. This means that what the machine can ‘see’ and what a human can see is
quite different and a characteristic which is visibly different to the human eye may not necessarily be
different when measured by a machine. The machine may therefore recognise that a feature is present
without being able to determine exactly what defect the feature describes. The fact that a measurement
can imply more than one defect type means the results from the AVI system are ambiguous.
To summarise, three sources o f uncertainty have been described which are inherent in an AVI system.
They can be summarised as: vagueness, incompleteness, and ambiguity. This section introduced why we
need to look at uncertainty and gave some examples of the uncertainty in the inspection domain. Chapter
2 investigates the inspection problem further and shall probe deeper into the sources of uncertainty.
Chapters 3 and 4 explore the theoretical techniques which are available for representing uncertain
information. These first few chapters represent an important task in this thesis. To develop an AVI system
which properly takes into account those types of uncertainty present, it was important to identify which
formalisms could be used to model the types of uncertainty specified and how the formalisms could be
applied in a robust AVI system. While the technology available appeared promising, the task was to
implement the theory to overcome the sources o f uncertainty in this application. The following section
shall introduce how the proposed ideas were tested.
1.3 Five criteria for an inspection system
The previous section raised the issue of uncertain information. This section uses that uncertain
information to specify five desirable criteria for an inspection system. As previously touched upon, one
of the difficulties in the assessment of how well a classification scheme performs is that there is no real
model of what is and is not a defect. Making a right or wrong judgement is therefore difficult. The
performance o f a classification scheme is subjective, hence the reasoning behind the five criteria was to
construct a measure to analyse the model used to construct the classification scheme. Rather than
assessing the on-line performance o f an actual classification scheme, the objective of the research was to
study the method by which a classification scheme could be developed. The study analysed the
development o f a classification scheme with respect to a ‘wish list’ of five desirable properties.
Chapter 1 - Introduction
The five criteria were generated by identifying the properties o f an AVI system which would enable the
construction of a robust classification scheme. The five criteria are summarised as:
1. It should be possible to classify defects w ithout a complete model of the process. The development
of a classification scheme is a continuous process and should evolve with the production environment.
It is not reasonable to assume that a complete model of the domain can be constructed which will be
valid for the lifetime o f the classification scheme due to the incompleteness o f the data described in
the previous section. It is therefore desirable that the classification scheme should function correctly
as an open ended model. It is important for the experts developing the system to define the
information which can be extracted at the initial stages o f the project. Whilst it is beneficial to include
as much information as possible regarding the domain, the expert should also be aware that the initial
set-up is a snapshot o f the typical production environment.
2. It should be possible to introduce new inform ation when it becomes available. The incorporation
of new information with the existing data should not invalidate the previous knowledge. The new
information should blend with the old without the need to regenerate the total classification scheme.
As an extension to criteria 1 this is particularly important for on-line systems situated in changing
environments. This criteria is necessary to test the situation where, for example, the expert will be
required to include information regarding new defects if a new product is introduced.
3. It should be possible to am end descriptions of defect classes. A direct consequence of the
uncertainty in the inspection domain is that much of the information available for describing defects is
vague. As a result initial descriptions are either incomplete or not expressive enough. It is therefore
necessary to be able to make changes to the information in the classification scheme when required.
As data becomes available which changes one’s perspective of a previously defined class the
modifications to the class should not disrupt the classification scheme as a whole. The expert should
assume that the production process will change over time. Another example is, changes in production
equipment might mean that previously defined information becomes invalid or not completely true. It
is necessary to be able to modify the existing information to update one’s view.
4. There should be an intuitive way for experts to express their knowledge to define defect classes.
It is very important that those developing a classification scheme to be able to represent their
knowledge in a manner which is natural to them. The alternative is that they must input their
knowledge in terms which are familiar to the system designer. This is often not intuitive to those who
actually use the inspection system since there is a mismatch between the way the two groups of
people think. A system designer may tend to think in terms of image processing algorithms which
may be useful for differentiating between two images to be classified, whereas the inspector would
view the images in terms o f the defect characteristics. Since it is the inspector who will take
ownership o f the system when it is on-line and it is their knowledge which shall be used to develop
the classification scheme, it is sensible for the system to function in a way that is natural to them. For
Chapter 1 - Introduction
example, previous approaches using production rules provided a logical method for expressing
knowledge, but the data types available were too rigid. By defining the antecedents as crisp numbers,
defects which were just outside the recognised limit would be classified incorrectly. The customer
does not always appreciate the difference between a 2.9mm and 3.0mm defect. A more intuitive data
type is required which does not rely on ‘black or white’ conditions.
5. The classification scheme should be understandable to the expert. To gain acceptance by those
who use the classification scheme an interface is required which enables the user to define their
knowledge. Furthermore, it should be clear how this knowledge is being used to make decisions and
classify defects. Such information is invaluable for justifying decisions in the event o f disputes.
These five criteria are used in the remainder of this thesis when assessing both the performance of a
classification scheme and the suitability of uncertainty formalisms for the task of inspection. In order to
make such an assessment, it was necessary to construct a classification scheme. For reasons discussed in
chapter 2, it was not practical to use a real on-line inspection system. Instead, an experimental rig was
constructed. In developing the test rig, it was important to design the system to emulate the sources of
uncertainty described in the preceding sections. The experimental AVI system was set-up to classify
seven types of defect in plastic film similar to OHP acetates. The images output from the camera system
provided the training and test data used to create and assess the classification scheme. The images
obtained were typical o f those which would be output from an on-line inspection system and as such the
experimental rig provided a suitable test bed for this research.
1.4 Sum mary
Automated inspection was introduced as having two component parts, detection and classification. This
thesis focuses on the task o f classification. Automated inspection, and in particular defect classification in
web product, is a process where the data used to model the environment is uncertain. A framework for
Automated Visual Inspection was introduced and typical problems experienced in defining a
classification scheme were described using the example o f a gel defect. The main sources o f uncertainty
were highlighted and five desirable properties for an inspection system were defined. These criteria were
proposed as a benchmark for testing the adequacy of applying uncertainty management techniques to
improve the development of inspection systems.
The motivation for this research is the benefits which could be gained from developing a system which
could take into consideration the types of uncertainty described. The result would be a more robust AVI
system which would provide more explicit classifications o f defects. By improving the representations
available for defining defects, the information in the classification scheme should also become more
intuitive to those who are responsible for managing the system. This transfer of ownership from the
system designer to those who use the equipment means the AVI system should evolve with the
Chapter 1 - Introduction
production process. Just as control o f the production process is improved using an AVI system, better
control over the inspection system will improve one’s ultimate ability to manufacture better product.
To conclude, theoretical techniques for managing uncertainty do exist, however the method for applying
them to this problem is not intuitive. This thesis illustrates how uncertainty management techniques have
been applied to the domain of industrial inspection. The remainder of the thesis is structured as follows:
Chapter 2 - Machine vision and definition o f problem
Machine vision, and in particular web inspection, is discussed as a process with reference to the product
used for experimentation in this thesis. Examples of the data output from an inspection system are
analysed to illustrate the nature of the uncertain information.
Chapter 3 - Machine vision and classification
Classification theory is introduced with respect to machine vision to introduce aspects o f current
applications and techniques which appear useful for this research. An introduction to uncertainty
management techniques is then made and potential technologies proposed.
Chapter 4 - Uncertainty techniques and classification
The two formalisms used in this research are investigated with respect to classification. A method by
which they could be applied to the task of classification is proposed and the method by which the
techniques could be assessed is stated.
Chapter 5 -Acquisition o f experimental data
A test environment was developed with the same characteristics as the real one to provide controlled and
repeatable conditions. A review is given of the experimental rig used to collect data on defects. The
hardware and software used to create the data used as input to the classification scheme is described.
Chapter 6 -The classification scheme
To implement the technology in a form which could be tried out in the test environment, bespoke
software was written. The structure of this software using Fuzzy Logic and Dempster Shafer is described.
The ruleset used for comparison o f the experimental results is defined, with examples, to illustrate the
concept of the software. To conclude, the experimental design to test the thesis is described.
Chapter 7 -Results
A summary of results for the 15 experiments is given.
Chapter 8 -Discussion
A description of the general results observed over all the experiments is presented followed by comments
on each of the experiments. The results are then discussed in relation to the five desirable properties
discussed previously. The discussion then concludes by analysing how successfully the sources of
uncertainty have been modelled within the AVI system.
Chapter 9 - Conclusion
A statement of the major observations is made along with suggestions for further work.
Chapter 2
Machine vision and definition of problem
The aims of this chapter are:
1. To introduce machine vision.
2. To define the nature of this inspection problem with regard to detection and classification.
3. Highlight why this classification task is different to others.
4. To introduce the web inspection problem.
5. To describe by example the data produced by the inspection system.
6. To define the limitations in this data and review the sources of uncertainty.
7. To state how this thesis shall be tested using the five desirable criteria for an inspection system.
The technology behind a machine vision system is introduced and the components o f a traditional vision
system are described. This is then extended to go beyond conventional systems and identifies approaches
being made to introduce intelligence into the inspection task.
The two aspects of inspection introduced in chapter 1, detection and classification or examining and
reporting, are described further and their current role in an AVI system is discussed. The difficulties in
making classifications in real world inspection systems are highlighted. The second section continues this
argument by analysing why the classification task in inspection is different to that in other environments,
and makes a comparison with an existing approach which has had successful implementations (an
example from medical diagnosis is used).
The next section focuses on the real world problem by introducing the web inspection process. The type
o f defects to be classified in this research are highlighted to show the information which is available for
making classifications. Using this information about defects, the next section investigates the output data
from the experimental rig used to test this thesis. It highlights the basic measurements used to describe
Chapter 2 - Machine vision and definition o f problem
the problem. Chapter 5 shall go into greater depth on the performance of the actual inspection system
used in this research.
The next section highlights the limitations in the data available and analyses the sources of uncertainty.
The final section returns to the five desirable criteria for an inspection system introduced in chapter 1 and
describes how the inspection system created in this research can be assessed.
2.1 The machine vision industry
Machine vision is a well established research field which has developed over the past 25-30 years. There
have been several comprehensive surveys over the years which track this progression [Batchelor et al
1985, Bayro-Corrachano 1993a,b, Chin 1982, 1988, Rao 1996, Rosenfeld 1989, Thomas et al 1995]. The
survey by Bayro-Corrachano divided machine vision into two areas, conventional and intelligent systems.
This discussion will follow a similar design. The first section on conventional systems describes the usual
components which would in whole, or in part, be used to construct a machine vision system. The second
section looks at how artificial intelligence has been introduced into machine vision systems and discusses
applications of such systems.
2.1.1 Conventional machine vision systems
Sira [1995] describe the technology required for machine vision as four subsystems.
1. Subject interrogation - getting information out of the subject in the form o f an image
2. Image processing - performing operations on the acquired image to reveal information of interest and
to prepare the image for subsequent analysis.
3. Image analysis - extracting the required information from the image and drawing conclusions or
making decisions.
4. User interaction - a two way communication of information between the system and the user to
enable the completion of the inspection task.
Whilst these four subsystems go from low to high level processes, (subject interrogation being a low level
process and user interaction a high level), they are not necessarily sequential. In practice they can often
be interleaved.
The first subsystem is dependent upon the hardware used to obtain an image o f the product under
investigation. The hardware used in this research was a linescan CCD (Charged Coupled Device) which
will be discussed in section 2.4. The camera basically functions by recording the amount o f light at the
subject. The method for illuminating the object to be inspected therefore plays an important role. The
most common method for illuminating an object, and the one used in this research, is to use artificial
Chapter 2 - Machine vision and definition o f problem
light. Several lighting techniques are possible and include, front lighting, back lighting and structured
lighting [Awcock and Thomas 1996].
The second subsystem basically transforms the input image into another image with desirable properties.
Standard techniques used for this low level processing can be found in most image processing literature
[e.g. Gonzalez and Woods 1993], however the important processes are i) image correction, the process of
minimising or removing image degradations introduced in the image acquisition process, and ii) image
enhancement, the process o f accentuating the required information so as to produce an image that is more
suitable than the original for a specific application. This process of accentuation involves retaining the
important information whilst discarding the superfluous. In practical real-time applications this low level
processing must be fast, limiting the range o f techniques that are typically applied. The amount of
information to be processed can be calculated by identifying three properties; the pixel resolution
required, the product width, and the speed of the production line. Based upon a 2 metre wide product
manufactured at a line speed of 5 metres per second and a pixel resolution o f 1 millimetre, the data rate
required is 10 megahertz. The practical constraints of real systems usually mean that one has less
information at the end of the image processing task than one would ideally like.
The third process is the analysis of the pre-processed image to extract the information o f interest. This
section is conventionally subdivided into three areas [Bayro-Corrochano 1993a]: segmentation, feature
extraction, and classification.
Segmentation is the process of dividing the image space into meaningful regions. Numerous
segmentation techniques have been proposed however they fall into the broad categories o f region and
boundary segmentation. The former divides the image into regions within which pixel values have
distinguishing characteristics and the latter forms lines of pixels having characteristics that delineate
segments. A simple example of segmentation is thresholding. That is classifying pixels according to
whether their greyscale value is above or below a given level.
Feature extraction is the process of extracting features and their characteristics from the segmented
image. The description of an object is normally expressed as a composition of relevant object features,
hence the process o f transforming information from the spatial image domain (single pixel information)
to a feature domain (information about a pixel relevant to its surrounding). Examples of features are
points (a distinct pixel value within a region) and lines (a sequence of pixels connected one by one in a
path through the image). This process enables the reduction o f data to a manageable form. For example,
images may be reduced from 512 by 512 arrays to a few well defined objects.
Chapter 2 - Machine vision and definition o f problem
Classification techniques are used to sort images into predetermined categories. The sorting process
requires that conclusions can be made about the subject being inspected. Various techniques have been
proposed including template matching, deterministic and statistical classification, and feature space
classification. This will be discussed further in section 3.1.
The last of the four subsystems, user interaction, provides a method for the user to communicate with the
system. This stage should allow the input o f user requirements (e.g. objects to be classified) and the
output o f the results (e.g. the actual classification of objects). The user interaction subsystem should be an
interface between the user and the system.
Examples of conventional applications can be found in dimensional verification, surface detection and
inspection for completeness [Bayro-Corrochano 1993a]. One of the more mature fields of industrial
inspection is in the semiconductor industry. Here the applications normally aim to detect errors such as
over-etching (open circuits), under etching (short circuits), cracks, holes, and contamination. In many of
these traditional inspection applications, the approach has two stages: first detection using automated
detection tools, then second, classification by a human operator. As previously stated the detection is
accepted as being a fairly well developed technology. Given the existing limitations of detection and
processing power, the problem still remains in making an automatic classification [Chou et al 1993, Luria
et al 1994]. This suggests that if practical solutions to the inspection problems are to be solved extensions
to the conventional methods are required. In a review of real-time industrial visual inspection Thomas et
al [1995] stated that many o f the successful conventional products performed little more than simple
pixel counting and intensity thresholding operations. A method for using the information which results
from the pixel counting and thresholding operations is required so that classifications can be generated
automatically.
2.1.2 Beyond conventional systems
The comparatively slow progress o f automated visual inspection in manufacturing may be due to the
reasoning required to make a classification decision [Newman and Jain 1995]. Human inspection is
characterised by substantial visual abilities and the flexibility to do different tasks. In contrast most
industrial machine vision applications are specialised. They are normally constrained to one particular
application hence require a great deal o f development work every time a new installation is set-up. In
order to increase the viability of industrial applications it is necessary to increase the flexibility of
machine vision systems.
In a paper aimed to provoke discussion amongst researchers in computer vision, Jain and Binford [1991]
highlight the problem which many conventional systems do not address;