S O F T W A R E A R T I C L E
Open Access
EFS: an ensemble feature selection tool
implemented as R-package and
web-application
Ursula Neumann
1,2,3, Nikita Genze
1and Dominik Heider
1,2,3**Correspondence: [email protected]
1Straubing Center of Science,
Schulgasse 22, 94315 Straubing, Germany
3Wissenschaftszentrum
Weihenstephan, Technische Universität München, 85354 Freising, Germany
Full list of author information is available at the end of the article
Abstract
Background: Feature selection methods aim at identifying a subset of features that improve the prediction performance of subsequent classification models and thereby also simplify their interpretability. Preceding studies demonstrated that single feature selection methods can have specific biases, whereas an ensemble feature selection has the advantage to alleviate and compensate for these biases.
Results: The software EFS (Ensemble Feature Selection) makes use of multiple feature selection methods and combines their normalized outputs to a quantitative ensemble importance. Currently, eight different feature selection methods have been integrated in EFS, which can be used separately or combined in an ensemble.
Conclusion: EFS identifies relevant features while compensating specific biases of single methods due to an ensemble approach. Thereby, EFS can improve the prediction accuracy and interpretability in subsequent binary classification models. Availability: EFS can be downloaded as an R-package from CRAN or used via a web application at http://EFS.heiderlab.de.
Keywords: Machine learning, Feature selection, Ensemble learning, R-package
Background
In the field of data mining, feature selection (FS) has become a frequently applied pre-processing step for supervised learning algorithms, thus a great variety of FS techniques already exists. They are used for reducing the dimensionality of data by ranking features in order of their importance. These orders can then be used to eliminate those features that are less relevant to the problem at hand. This improves the overall performance of the model because it addresses the problem of overfitting. But there are several reasons that can cause instability and unreliability of the feature selection, e.g., the complexity of multiple relevant features, a small-n-large-p-problem, such as in high-dimensional data [1, 2], or when the algorithm simply ignores stability [3, 4]. In former studies, it has been demonstrated that a single optimal FS method cannot be obtained [5]. For example, the Gini-coefficient is widely used in predictive medicine [6, 7], but it has also been demon-strated to deliver unstable results in unbalanced datasets [8, 9]. To counteract instability and therewith unreliability of feature selection methods, we developed an FS procedure for binary classification, which can be used, e.g., for random clinical trials. Our new
approach ensemble feature selection (EFS) [10] is based on the idea of ensemble learning [11, 12], and thus is based on the aggregation of multiple FS methods. Thereby a quan-tification of the importance scores of features can be obtained and the method-specific biases can be compensated. In the current paper we introduce an R-package and a web server based on the EFS method. The user of the R-package as well as the web applica-tion can decide which FS methods should be conducted. Therewith, the web server and the R-package can be applied to perform an ensemble of FS methods or to calculate an individual FS score.
Implementation
We used existing implementations inR(http://www.r-project.org/) for our package EFS. The following section will briefly introduce our methodology. For deeper insights please refer to [10]. Our EFS currently incorporates eight feature selection methods for binary classifications, namely median, Pearson- and Spearman-correlation, logistic regression, and four variable importance measures embedded in two different implementations of the random forest algorithm, namelycforest[9] andrandomForest[13].
Median
This method compares the positive samples (class = 1) with negative samples (class = 0) by a Mann-Whitney-U Test. The resultingp-values are used as a measure of feature importance. Thus, a smallerp-value indicates a higher importance.
Correlation
We used the idea of a fast correlation based filter of of Yu and Liu [14] to select features that are highly correlated with the dependent variable, but show only low correlation with other features. The fast correlation based filter eliminates features with high correlation with other features to avoid multicollinearity. The eliminated features get an importance value of zero. Two correlation coefficients, namely the Pearson product-moment and the Spearman rank correlation coefficient were adopted and theirp-values were used as importance measure.
Logistic regression
The weighting system (i.e., β-coefficients) of the logistic regression (LR) is another popular feature selection method. As preprocessing step a Z-transformation is conducted to ensure comparability between the different ranges of feature values. Theβ-coefficients of the resulting regression equation represent the importance measure.
Random forest
before and after permuting the class variable. Due to their dependency on the underlying trees, results are varying for both error-rates. TherandomForestapproach also provides an importance measure based on the Gini-index, which measures the node impurity in the trees. Whereas incforestan AUC-based variable importance measure is implemented. The AUC (area under the curve) is the integral of the receiver operating characteristics (ROC) curve. The AUC-based variable importance measure works to the error-rate-based one, but instead of computing the error rate for each tree before and after permuting a feature, the AUC is computed.
Ensemble learning
The results of each individual FS methods are normalized to a common scale, an interval from 0 to1n, wherenis the number of conducted FS methods chosen by the user. Thereby we ensure the comparability of all FS methods and conserve the distances between the importance of one feature to another.
R-package
The EFS package is included in the Comprehensive R Archive Network (CRAN) and can be directly downloaded and installed by using the following R command:
install.packages("EFS")
In the following, we introduce EFS’s three functionsensemble_fs,barplot_fsand
efs_eval. A summary of all commands and parameters is shown in Table 1.
Table 1Method overview
Command Parameters Information
ensemble_fs data object of class data.frame
classnumber index of variable for binary classification
NA_threshold threshold for deletion of features with a greater proportion of NAs cor_threshold correlation threshold within features
runs amount of runs for randomForest and cforest selection selection of feature selection methods to be conducted barplot_fs name character string giving the name of the file
efs_table table object of class matrix retrieved from ensemble_fs efs_eval data object of class data.frame
efs_table table object of class matrix retrieved from ensemble_fs
file_name character string, name which is used for the two possible PDF files. classnumber index of variable for binary classification
NA_threshold threshold for deletion of features with a greater proportion of NAs
logreg logical value indicating whether to conduct an evaluation via logistic regres-sion or not
permutation logical value indicating whether to conduct a permutation of the class variable or not
p_num number of permutations; default set to a 100
variances logical value indicating whether to calculate the variances of importances retrieved
from bootstrapping or not
jaccard logical value indicating whether to calculate the Jaccard-index or not bs_num number of bootstrap permutations of the importances
ensemble_fs
The main function isensemble_fs. It computes all FS methods which are chosen via the selection parameter and gives back a table with all normalized FS scores in a range between 0 and1n, wherenis the number of incorporated feature selection methods. Irrelevant features (e.g., those with too many missing values) can be deleted.
ensemble_fs(data, classnumber,
NA_threshold, cor_threshold, runs, selection)
The parameterdatais an object of classdata.frame. It consists of all features and the class variables as columns. The user has to set the parameterclassnumber, which represents the column number of the class variable, i.e., the dependent variable for clas-sification. NA_threshold represents a threshold concerning the allowed proportion of missing values (NAs) in a feature column. The default value is set to 0.2, mean-ing that features with more than 20% of NAs are neglected by the EFS algorithm. The
cor_thresholdparameter is only relevant for the correlation based filter methods. It determines the threshold of feature-to-feature correlations [14]. The default value of
cor_thresholdis 0.7. The results of RF-based FS methods vary due to the randomness of their underlying algorithms. To obtain reliable results, the RF methods are conducted several times and averaged over the number of runs. This parameter, namelyruns, is set to 100 by default. The user can select the FS methods for the EFS approach by using theselectionparameter. Due to the high computational costs of the RFs, the default selection is set to
selection = c(TRUE, TRUE, TRUE, TRUE, TRUE, TRUE, FALSE, FALSE),
meaning that the two FS methods of the conditional random forest are not used by default.
barblot_fs
The barblot_fs function sums up all individual FS scores based on the output of
ensemble_fsand visualizes them in an cumulative barplot.
# Create a cumulative barplot based on the output from EFS barplot_fs(name, efs_table)
Thebarplot_fsfunction uses the output of theensemble_fsfunction, namely the
efs_table, as input. The parameternamerepresents the filename of the resulting PDF, which is saved in the current working directory.
efs_eval
The efs_eval function provides several tests to evaluate the performance and validity of the EFS method. The parameters data, efs_table, file_name, classnumberandNA_thresholdare identical to the corresponding parameters in theensemble_fsfunction:
efs_eval(data, efs_table, file_name, classnumber , NA_threshold, logreg = TRUE,
permutation = TRUE, p_num,
Performance evaluation by logistic regression
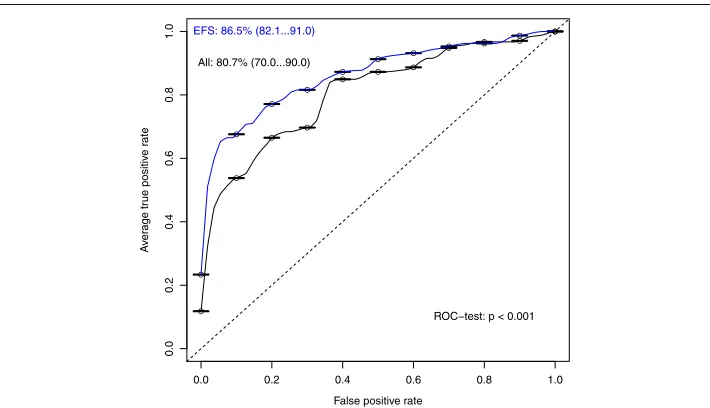
The performance of the EFS method can automatically be evaluated based on a logis-tic regression (LR) model, by setting the parameterlogreg = TRUE.efs_evaluses an LR model of the selected features with a leave-one-out cross-validation (LOOCV) scheme, and additionally trains an LR model with all available feature in order to com-pare the two LR models based on their ROC curves and AUC values with ROCR [16] and pROC based on the method of DeLong et al. [17]. A PDF with the ROC curves is automatically saved in the working directory.
Permutation of class variable
In order to estimate the robustness of the resulting LR model, permutation tests [18, 19] can be automatically performed, by setting the parameterpermutation = TRUE. The class variable is randomly permutedp_numtimes and logistic regression is conducted. The resulting AUC values are then compared with the AUC from the original LR model using a Student’s t-Test. By default,p_numis set to 100 permutations.
Variance of feature importances
If the parameter variancesisTRUE an evaluation of the stability of feature impor-tances will be conducted by a bootstrapping algorithm. The samples are permuted forbs_num times and a subset of the samples (bs_percentage) is chosen to cal-culate the resulting feature importances. By default, the function chooses 90% of the samples and uses 100 repetitions. Finally, the variances of the importance values are reported.
Jaccard-index
The Jaccard-index measures the similarity of the feature subsets selected by permuted EFS iterations:
J(S1,. . .,Sn)= |
S1∩. . .∩Sn|
|S1∪. . .∪Sn| ,
where Si is the subset of features at the i-th iteration, for i = 1,. . .,n. The value of the Jaccard-index varies from 0 to 1, where 1 implies absolute similarity of sub-sets. Ifjaccard = TRUE is set, the Jaccard-index of the subsets retrieved from the bootstrapping algorithm is calculated.
Availability and requirements
The package is available for R-users under the following requirements:
• Project name:Ensemble Feature Selection
• Project home page (CRAN):http://cran.r-project.org/web/packages/EFS
• Operating system (s):Platform independent
• Programming language:R (≥3.0.2)
• License:GPL (≥2)
• Any restrictions to use by non-academics:none
http://EFS.heiderlab.de. It contains the functions ensemble_fs and barplot_fs. Therefore no background knowledge in R is necessary to use our new EFS software.
Results
The dataset SPECTF has been obtained from the UCI Machine Learning Repository [20] and is used as an example. It describes diagnosing of cardiac Single Proton Emis-sion Computed Tomography (SPECT) images. The class-variable represents normal (= 0) and abnormal (= 1) results and can be found in the first column of the table of the file SPECTF.csv at the UCI repository. In general, the EFS approach accepts all types of data, i.e., all types of variables, except categorical variables. These variables have to be trans-formed to dummy variables in advance. Data has to be combined in a single file with one column indicating the class variable with 1 and 0, e.g., representing patients and control samples, or, e.g., positive and negative samples. After loading the dataset, we compute the EFS and store it in the variable “efs”:
library(EFS)
# Loading dataset in environment
efsdata <- read.table("SPECTF.csv", sep = ";") # Start feature selection
efs <- ensemble_fs(data = efsdata, classnumber = 1,
NA_threshold = 0.2, cor_threshold = 0.7, runs = 100, selection = rep(TRUE, 8))
The results can be visualized by thebarplot_fsfunction:
# Create a cumulative barplot based on the output from efs barplot_fs("SPECTF", efs)
The output is a PDF named “SPECTF.pdf ”. Figure 1 shows this cumulative barplot, where each FS method is given in a different color. Various methods to evaluate the stability and reliability of the EFS results are conducted by the following command:
# Create a ROC Curve based on the output from efs
eval_tests <- efs_eval(data = efs_data, efs_table = efs, file_name = "SPECTF",
classnumber = 1, NA_threshold = 0.2, logreg = TRUE,
permutation = TRUE, p_num = 100, variances = TRUE, jaccard = TRUE, bs_num = 100, bs_percentage = 0.9)
X1 X2 X3 X4 X5 X6 X7 X8 X9 X10 X11 X12 X13 X14 X15 X16 X17 X18 X19 X20 X21 X22 X23 X24 X25 X26 X27 X28 X29 X30 X31 X32 X33 X34 X35 X36 X37 X38 X39 X40 X41 X42 X43 X44
Ensemble Feature Selection
0.0 0.2 0.4 0.6 0.8 1.0
Median P_cor S_cor LogReg ER_RF Gini_RF AUC_CF ER_CF 0.16 0.34 0.26 0.40 0.31 0.59 0.20 0.29 0.10 0.39 0.05 0.25 0.21 0.43 0.25 0.48 0.060.11 0.220.26 0.16 0.34 0.21 0.37 0.25 0.64 0.12 0.29 0.21 0.51 0.26 0.52 0.44 0.38 0.200.22 0.07 0.31 0.33 1.00 0.35 0.74 0.410.43
Fig. 1Cumulative barplot retrieved frombarplot_fsfunction of R-package EFS
An additional example is provided in the documentation of the R-package on a dataset consisting of weather data from the meteorological stations in Frankfurt(Oder), Germany in February 2016.
Conclusion
The EFS R-package and the web-application are implementations of an ensemble feature selection method for binary classifications. We showed that this method can improve the prediction accuracy and simplifies the interpretability by feature reduction.
Fig. 2Performance of LR model. On they-axisthe average true positive rate (i.e., sensitivity) and on thex-axis
Fig. 3Boxplot of importances retrieved from the bootstrapping algorithm
Abbreviations
AUC: Area under the curve; CART: Classification and regression tree; CRAN: Comprehensive R archive network; EFS: Ensemble feature selection; FS: Feature selection; LR: logistic regression; LOOCV: leave-one-out cross validation; RF: random forest; ROC: receiver operating characteristic
Acknowledgments
We are grateful to the UCI Machine Learning Repository for granting access to a great variety of datasets.
Funding
This work was supported by the German Research Foundation (DFG) and the Technische Universität München within the funding program Open Access Publishing and the Deichmann Foundation, which had no role in study design, collection, analysis, and interpretation of data, and in writing the manuscript.
Availability of data and materials
The datasetSPECTFin this article is available in the UCI Machines Learning repository, http://archive.ics.uci.edu/ml.
Authors’ contributions
UN and NG have implemented the R-package. UN has implemented the web application and drafted the manuscript. DH designed and supervised the study. DH revised the manuscript. All authors read and approved the final manuscript.
Competing interests
The authors declare that they have no competing interests.
Consent for publication
Not applicable.
Ethics approval and consent to participate
Not applicable.
Publisher’s Note
Springer Nature remains neutral with regard to jurisdictional claims in published maps and institutional affiliations.
Author details
1Straubing Center of Science, Schulgasse 22, 94315 Straubing, Germany.2University of Applied Science,
Weihenstephan-Triesdorf, 85354 Freising, Germany.3Wissenschaftszentrum Weihenstephan, Technische Universität
München, 85354 Freising, Germany.
References
1. Dybowski JN, Heider D, Hoffmann D. Structure of hiv-1 quasi-species as early indicator for switches of co-receptor tropism. AIDS Res Ther. 2010;7:41.
2. Pyka M, Hahn T, Heider D, Krug A, Sommer J, Kircher T, Jansen A. Baseline activity predicts working memory load of preceding task condition. Hum Brain Mapp. 2013;34(11):3010–22.
3. Jain A, Zongker D. Feature selection: evaluation, application, and small sample performance. IEEE Trans Pattern Anal Mach Intell. 1997;19(2):153–8.
4. He Z, Yu W. Stable feature selection for biomarker discovery. Comput Biol Chem. 2010;34:215–25.
5. Yang YHY, Xiao Y, Segal MR. Identifying differentially expressed genes from microarray experiments via statistic synthesis. Bioinformatics. 2004;21(7):1084–93.
6. Leclerc A, Lert F, Cecile F. Differential mortality: Some comparisons between england and wales, finland and france, based on inequality measures. Int J Epidemiol. 1990;19(4):1001–10.
7. Llorca J, Delgado-Rodríguez M. Visualising exposure-disease association: the lorenz curve and the gini index. Med Sci Monit. 2002;8(10):193–7.
8. Sandri M, Zuccolotto P. A bias correction algorithm for the gini variable importance measure in classification trees. J Comput Graph Stat. 2008;17(3):611–28.
9. Boulesteix AL, Janitza S, Kruppa J, König IR. Overview of random forest methodology and practical guidance with emphasis on computational biology and bioinformatics. Wiley Interdiscip Rev Data Min Knowl Discov. 2012;2(6): 493–507.
10. Neumann U, Riemenschneider M, Sowa JP, Baars T, Kälsch J, Canbay A, Heider D. Compensation of feature selection biases accompanied with improved predictive performance for binary classification by using a novel ensemble feature selection. BioData Min. 2016;9(1):36.
11. Saeys Y, Abeel T, Van de Peer Y. Robust feature selection using ensemble feature selection techniques. In: Joint European Conference on Machine Learning and Knowledge Discovery in Databases. Berlin: Springer-Verlag; 2008. p. 313–25.
12. Abeel T, Helleputte T, Van de Peer Y, Dupont P, Saeys Y. Robust biomarker identification for cancer diagnosis with ensemble feature selection methods. Bioinformatics. 2010;26(3):392–8.
13. Breiman L. Random forests. Mach Learn. 2001;45(1):5–32.
14. Yu L, Liu H. Efficient feature selection via analysis of relevance and redundancy. J Mach Learn Res. 2004;5:1205–24. 15. Strobl C, Boulesteix AL, Kneib T, Augustin T, Zeileis A. Conditional variable importance for random forest. BMC
Bioinforma. 2006;9(307):1–11.
16. Sing T, Sander O, Beerenwinkel N, Lengauer T. Rocr: visualizing classifier performance in r. Bioinformatics. 2005;21(20):3940–41.
17. DeLong ER, DeLong DM, Clarke-Pearson DL. Comparing the areas under two or more correlated receiver operating characteristic curves: A nonparametric approach. Biometrics. 1988;44(3):837–45.
18. Barbosa E, Röttger R, Hauschild AC, Azevedo V, Baumbach J. On the limits of computational functional genomics for bacterial lifestyle prediction. Brief Funct Genomics. 2014;13:398–408.
19. Sowa JP, Atmaca Ö, Kahraman A, Schlattjan M, Lindner M, Sydor S, Scherbaum N, Lackner K, Gerken G, Heider D, Arteel GE, Erim Y, Canbay A. Non-invasive separation of alcoholic and non-alcoholic liver disease with predictive modeling. PLOS ONE. 2014;9(7):101444.
20. Lichman M. UCI Machine Learning Repository. 2013. http://archive.ics.uci.edu/ml.
• We accept pre-submission inquiries
• Our selector tool helps you to find the most relevant journal
• We provide round the clock customer support
• Convenient online submission
• Thorough peer review
• Inclusion in PubMed and all major indexing services
• Maximum visibility for your research
Submit your manuscript at www.biomedcentral.com/submit