R E S E A R C H
Open Access
ANMM4CBR: a case-based reasoning method for
gene expression data classification
Bangpeng Yao, Shao Li
*Abstract
Background:Accurate classification of microarray data is critical for successful clinical diagnosis and treatment. The “curse of dimensionality” problem and noise in the data, however, undermines the performance of many
algorithms.
Method:In order to obtain a robust classifier, a novel Additive Nonparametric Margin Maximum for Case-Based Reasoning (ANMM4CBR) method is proposed in this article. ANMM4CBR employs a case-based reasoning (CBR) method for classification. CBR is a suitable paradigm for microarray analysis, where the rules that define the domain knowledge are difficult to obtain because usually only a small number of training samples are available. Moreover, in order to select the most informative genes, we propose to perform feature selection via additively optimizing a nonparametric margin maximum criterion, which is defined based on gene pre-selection and sample clustering. Our feature selection method is very robust to noise in the data.
Results:The effectiveness of our method is demonstrated on both simulated and real data sets. We show that the ANMM4CBR method performs better than some state-of-the-art methods such as support vector machine (SVM) andknearest neighbor (kNN), especially when the data contains a high level of noise.
Availability:The source code is attached as an additional file of this paper.
Background
Recently gene microarray technology has become a fun-damental tool in biomedical research, enabling us to simultaneously observe the expression of thousands of genes on the transcriptional level. Two typical problems that researches want to solve using microarray data are: (1) discovering informative genes for classification based on different cell-types or diseases [1]; (2) clustering and arranging genes according to their similarity in expres-sion patterns [2]. Here we focus on the former, espe-cially on microarray classification using gene expression data, which has attracted extensive attentions in the last few years. It is believed that gene expression profiling could be a precise and systematic approach for cancer diagnosis and clinical-outcome prediction [3].
With about ten years of research, many algorithms have been applied to microarray classification, such as nearest neighbor (NN) [4], artificial neural networks [5], boosting [6], support vector machine (SVM) [7], etc.
Many commonly used classifiers are rule-based or statis-tical-based. One challenge of these methods on microar-ray data is the small sample size problem. With the limited number of training samples, it is difficult to obtain domain knowledge for rule-based systems or get accurate parameters (such as mean value and standard deviation) for statistical-based approaches.
Other than adopting rule-based or statistical-based classification methods, in this paper we use a case-based reasoning (CBR) [8] approach to design a robust microar-ray classifier. CBR usually requires much less domain knowledge than rule-based or statistical-based systems, because it does not heavily rely on the statistical assump-tions on the data during the classification procedure. It maintains a case-base of previous problems and their solutions, and solves new problems by reference to this case-base. NN can be viewed as the simplest form of CBR methods. With a complicated comparative study, in [9] it was concluded that NN performed better compared with more sophisticated ones. Moreover, [10] observed that CBR is particularly useful for applications in life sciences, where we lack sufficient knowledge either for
* Correspondence: [email protected]
MOE Key Laboratory of Bioinformatics and Bioinformatics Division, TNLIST/ Department of Automation, Tsinghua University, Beijing 100084, PR China
formal representation or for parameter estimation. [11] reviewed previous research works in applying CBR to bioinformatics domains. In the problem of microarray classification, however, except the simplest form NN, CBR classifiers were considered in only a few literatures [11,12] and was only tested on some simple data sets.
In order to design an effective classifier, dimension of the microarray data should be reduced. Of the thou-sands of genes in a microarray data, only a small frac-tion are informative from the aspect of biological meaning or classification performance [13]. In this work we propose a novel additive nonparametric margin max-imum (ANMM) method for feature selection. Three properties determine ANMM’s superiority in feature selection for microarray data: (1) ANMM is a nonpara-metric method which requires less restrictive assump-tions about the original data, and thus is suitable for dealing with microarray data [14]. (2) The feature reduc-tion criterion for ANMM is defined based on gene pre-selection and sample clustering, which renders ANMM insensitive to outliers or mislabeled samples. (3) There exist some relationships between ANMM and CBR, and therefore the performance of CBR classification can be improved by ANMM feature selection.
Using ANMM for feature selection and CBR for clas-sification, a novel ANMM4CBR method is established in this paper. The performance of ANMM4CBR is tested on one simulated data and four publicly available data sets, comparing with some well-known methods includ-ing SVM,kNN and LogitBoost, as well as the other CBR methods that have been applied to microarray classifica-tion. We show that ANMM4CBR can result in exciting classification results, especially on the data which con-tains a high level of noise.
Methods
Overview of ANMM4CBR
In a microarray data classification problem, we are given Ntraining samples { , }x yi i iN1, wherexiis anM
-dimen-sional vector in the feature space andyi Î{0, ... K- 1}
is the class label. The set of samples in thekth class are denoted asωk, i.e. xi Îωkmeansyi =k. The genes are
denoted as {m m}M1, wherejm(x) is the expression
value of samplex on themth gene. The learning task is to select a subset from all the genes, and define a simi-larity measurement based on the selected genes. When given an unlabeled sample, we expect to predict the category of this sample using the selected genes and the defined similarity measure.
In this paper, we propose a CBR-based method to construct the classifier. CBR classifiers use a philosophy that plays a vital role in human decision making. They try to solve new problems by retrieving previously solved cases from a case-base. The process of solving
new cases contributes new information to the system, and this new information can be used for solving other future cases. In [15], CBR method is described in terms of four phases. In the first phase, CBR retrieves old cases similar to the new one. The second phasereuses the solutions of the retrieved cases for solving the new case. The third phase revises the solution, e.g. by a human. Finally, the fourth phase retains the useful information which is obtained when solving this case.
Here we focus on the retrieving and reusing phases, and propose a novel ANMM4CBR method for classifica-tion (see Figure 1). For feature selecclassifica-tion, we develop a novel ANMM method, which additively optimizes a nonparametric margin maximum criterion. We define this criterion based on gene pre-selection and sample clustering to make it robust to noise and outliers. In our CBR classifier, each class contains one case-base. For a testing case, we retrieve similar cases from each case-base, and combine the results of all the case-bases to provide a classification label.
According to the notion of CBR, we can revise the prediction results of testing samples and then add them to the case-bases. The revising andretaining phases, however, are not the focus of this paper and will not be mentioned in the following descriptions. Details of the ANMM and CBR modules are described below.
Additive Nonparametric Margin Maximum for Feature Selection
Here we introduce an ANMM feature selection method, which uses an additive method to optimize a nonpara-metric margin maximum (NMM) criterion. The NMM criterion is defined based onnearest between-class dis-tance maximization andfurthest within-cluster distance minimization. We first describe the NMM criterion, and then present the additive optimization method.
Figure 1 Framework of ANMM4CBR for microarray
Nonparametric Margin Maximum (NMM) Criterion
The goal of feature selection is to identifyinformative genesfrom thousands of available genes. The informa-tive genes are those that have high discriminainforma-tive powers, and have low correlations between each pair of them [16]. Selecting informative genes helps not only overcome the curse of dimensionality problem and thus improve the prediction accuracy, but also reveal mean-ingful biological explanations of the dataset. Theoreti-cally, any wrapper or filter feature selection method, such as t-test, mutual information measurement, etc, can be used. However, one drawback of these approaches is that the feature selection criterion is designed regardless of the classifier design. In [17], it has been observed that almost all feature selection methods have some assumptions of the distribution of the data, and these assumptions usually affect the per-formance of the classifiers. Therefore, it is important to design a feature selection method that is suitable for the classification method that will be used.
Bressan and Vitrià [17] showed that there is a close link between nonparametric discriminant analysis (NDA) [18] and instance-based classifiers. In that work, a modified NDA was applied to improve the perfor-mance of NN for face recognition. Since CBR-based methods also belong to instance-based classifiers, we believe that the idea of NDA also helps to improve, at least not downgrade the performance of CBR. Our NMM criterion is defined based on the notion of NDA. Instead of directly using the furthest within-class dis-tance as in the original NDA method, in our method training samples in each class ωk are firstly grouped
into many clusters { k1 k2
, ,} so that the samples in each cluster have similar patterns. The objective of NMM is to maximize the between-class distance of samples while minimize the within-cluster distance. For one samplexi Î ωk, we define its nearest between-class
neighbor as
xiB {xk| xix xiz , z k} (1)
Similarly, its furthest within-cluster neighbor is defined as
xiW { [ ]C x C x[ ] |i xix xiz ,C z[ ]C x[ ]}i (2)
whereC[x] indicates the cluster thatxbelongs to. Then the nonparametric margin ofxiis
iiBWi xixiB xixWi
2 2
(3)
where iB is the nonparametric nearest between-class
distance forxi, and iW is the furthest within-cluster
distance. Obviously, the largerΘiis, the more likely that
xiis correctly classified. Therefore the learning objective
of NMM is to select a subset of genes { }ht tT1 from F to maximize the nonparametric margin for all the sam-ples,i.e. to maximize
J
h x h x h x h
T i iB i iW
i N
t i t iB t i t
2 21
2
[ ( ) ( )] [ ( ) ((xiW)] t T t T i N 2 1 1
1
(4)where δiis the sample xiin the space of selected
fea-tures, which is represented asδi= [h1(xi), ...,hT(xi)]T.
Not surprisingly, we find that if each class contains only one cluster, the NMM criterion is equal to the optimization objective of NDA (see proof 1). Since it has been proved that there are close relationships between NDA and instance-based classifiers such as NN [17], we believe that our margin maximum criterion also benefits the design of a robust CBR classifier. More-over we replaced the furthest within-class distance with furthest within-cluster distance, which makes our approach more robust to outliers, considering that the outliers that usually exist in microarray data might make the furthest within-class distance extremely large. Another major difference between our method and NDA is that, NDA performs feature reduction by find-ing a weighted combination of all the features, while NMM aims at selecting a subset of features. This prop-erty is important since the selected features can be used to reveal some biological significance.
Proof 1
The Nonparametric Margin Maximum (NMM) criterion in Equation (4) can be expanded as the following
i i B i i W i N
i iB T
i iB i N i
2 2 1 1
iW Ti iW i
N
i iB i iB T i N tr 1 1
tr i iW i iW
T i N 1 (5)
When each class contains only one cluster, we have
i iB i iB
T
i N
B
i iW i iW T i S
1 , 1N N
W
S
(6)where SB andSW are between-class and within-class scatter matrix for NDA respectively. Therefore we can conclude that when each class contains only one cluster,
i iB i iW i
N
B W B W
tr S tr S tr S S
2 21
where the left-hand side is the NMM criterion and the right-hand side is the NDA optimization criterion. □
Feature Pre-selection and Clustering
In our method, we normalize the original data and then perform feature pre-selection and sample cluster-ing to define within-cluster neighbors. We use the same normalization method as in [19], which includes base 10 log-transformation as well as normalization to mean 0 and variance 1. For the data that contains negative values, we do not perform log-transformation.
In microarray data, the gene dimension is extremely large compared to the small number of samples. Many of these genes are not differentially expressed across the samples of different classes and thus do not con-tain very useful information. It is likely that too many non-informative genes in the data will undermine the clustering results. In order to improve the clustering performance, we implement gene pre-selection before clustering. Another benefit of removing some non-informative genes is that it can drastically ease the computational burden in subsequent processing procedures.
Approaches that can remove non-informative genes have been studied in many literatures, for instance t-test [20], mutual information (MI) maximization [16], etc. Instead of these parametric methods, we use a nonpara-metric scoring algorithm presented in [13]. For binary classification which involves two classes ω0 andω1, the
score of a featurejmis
Score( ; , ) max ( ) ( ) ,
m m i m j
x x m x x j i 0 1 1 0
(( ) ( ) | || |xi m xj
x xi j
1 0 1 0 1 (8)where〚A〛equals 1 if A is true, otherwise 0. |ω| is the number of samples inω.
The genes whose scores are below a thresholdθpwill
be removed, and the remaining genes are used for further processing. Compared with the parametric methods such as t-test and MI maximization, this method is less sensitive to outliers, since it does not rely on any statistical values (mean, standard deviation, etc.) of the data, which can be highly affected by outliers.
This nonparametric method can be easily generalized to multiclass problems by considering all the possible binary cases. For a Kclass problem, the score of a fea-turejmis
2
1 0 1
0 1
K K m k k
k k
( ) ( ; , )
,
Score (9)After gene pre-selection, we group samples in each class into some clusters. Although there are many choices of clustering approaches, hierarchical clustering [21] is the most commonly used one for microarray ana-lysis. The preference of hierarchical clustering in micro-array analysis is due to its good performance [2] and, moreover, it does not require a pre-specification of the number of clusters.
We use the most common type of hierarchical clus-tering. At the initial level, each sample forms its own cluster. At each subsequent level, the two‘nearest’ clus-ters are combined to form one bigger cluster. We use method = ‘furthest’ which means the distance between two clusters is the maximum of all the distances between any sample in one cluster and any sample in the other cluster. The‘furthest’metric is used since it is not highly sensitive to outliers compared with the other metrics such as ‘nearest’ and‘average’. We empirically set a threshold θhfor clustering, which means that for
each class, the clustering procedure terminates when the distance between any two clusters is larger thanθh.
Additive optimization method
Here the NMM criterion is optimized in an additive approach, which operates iteratively. At each iteration, one feature is selected. Assuming that until the (t - 1)-th iteration 1)-the margin isJt-1, at iterationtthe feature ht
will be selected to maximize
Jt Jt h xt i h xt iB h xt i h xt iW i N
1 2 2 1( ) ( ) ( ) ( ) (10)
During the optimization procedure, however, when one feature is selected, for each sample its nearest between-class neighbor and furthest within-cluster neighbor might change. In another word, the optimiza-tion of Jtmight changeJt-1, and for each sample, many
other samples might become its nearest between-class neighbor or furthest within-cluster neighbor in subse-quent processing. Therefore we should maintain the dis-tance between any two samples in each iteration, which is computationally expensive. In order to reduce compu-tational complexity, we maximize the following formula instead of directly optimizing Equation (4),
min ( ( ) ( )) |
max ( ( ) (
j t i t j i j
i N
t T
l t i t
h x h x y y
h x h x
2 1 1ll)) | [ ]2 C xi C x[ ]l
Proof 2 shows that Equation (11) is a low bound of Equation (4), which implies that we can maximize Equa-tion (4) by optimizing EquaEqua-tion (11).
Proof 2
[ ( )h xt i h xt(iB)] [ ( )h x h x( )]
t T
t i t iW
t T i N 2 1 2 1 1
min ( ( ) ( )) | max ( ( )
j t i t j i j
t T
l t i t
h x h x 2y y h x h 1
(( )) | [ ] [ ]
min ( (
x C x C x
h x
l i l
t T
i N
j t i
2 1 1
)) ( )) | max ( ( ) ( )) | [ ]
h xt j yi yj h x h x C x
t T
l t i t l i
2 1
2 CC x
h x h x y y
l t
T
i N
j t i t j i j
[ ]
min ( ( ) ( )) |
1 1
2 mmax ( ( ) ( )) | [ ] [ ]
l t i t l i l
i N
t T
h x h x C x C x
2 1 1 (12)
With the criterion of Equation (11), at each iteration we can independently treat each feature to select the best one, regardless of the features that have been selected at previous iterations. This implies that we can test each feature on training set and select the top-ranked ones. However, [16] has observed that sim-ply combining the top-ranked genes often does not form a good feature set. One reason is that the top-ranked genes could be highly correlated, and therefore the selected features might contain much redundant information. In order to overcome this problem, simi-lar in the way that the boosting method [22] does, we assign weights { }wi iN1 to training samples. Initially all
samples share the same weight. When one feature is selected, the weights are updated with the principle that the sample that has a larger margin will get a lower weight, and vice versa. The weights of the sam-ples are updated by
wt1( )xi w xt( ) exp{ ( (i t xWi )t(xiB))} (13)
where t i
W
i t i t l i l t i B
x h x h x C x C x x
( )max ( ( )
( )) | [ ]2 [ ] ,
( )min ( ( ) ( )) |
j
h xt i h xt j yiyj
2
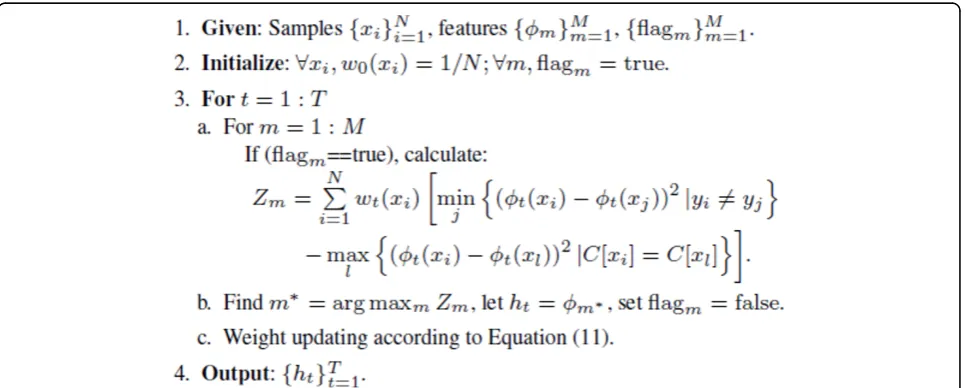
, and a is a positive para-meter. Algorithm flow of the additive optimization method is shown in Figure 2.
Case-Based Reasoning Classifier
Rather than using the traditional CBR methods in which all the samples form a single case-base, here we treat samples in each class one case-base. For aK-class pro-blem, there are Kcase-bases {k k}K1. Given an input
samplex, ANMM4CBR retrieves several similar cases from each case-base. The distance betweenxand a sam-plex’in case-base is measured by
D x x h xt h xt
t T ( , ) [ ( ) ( )]
2 1 (14)If there are lk samples in the case-baseωk,b·lk cases
that have small distances fromxwill be selected as simi-lar cases, wherebis a parameter that controls the num-ber of samples that will be retrieved from each case-base. The distance between x and ωk, D(x, ωk) is the
average of the retrieved b·lk distances. In the
ANMM4CBR method, we calculate the distance from x to each case-base ωk, andx belongs to the class which
relates to the minimum distanceD(x,ωk).
Results and Discussion
We carried out experiments using simulated data as well as real microarray data to test the performance of ANMM4CBR. There are four parameters to be chosen in
Figure 2Additive optimization of the NNM criterion. flagmindicates whetherjmhas been selected. It is true ifjmhas been selected,
ANMM4CBR: gene pre-selection thresholdθp,
cluster-stopping thresholdθh, weight-updating parametera, and
the parameterbfor case retrieve. We empirically setθp
andbto 0.7 and 0.3 respectively, which means the genes with score values smaller than 0.7 will be removed in the gene pre-selection procedure, and CBR will retrieve 0.3|ω| cases from a case-base which contains |ω| cases. The other two parameters, θhand a, are data-dependent.
Therefore we adopted cross-validation to choose them. After the whole data were split into training and testing sets, we used five-fold cross-validation on training set to evaluate the performance of ANMM4CBR with different values ofθhanda. Then the best combination ofθhanda
was selected to train an ANMM4CBR classifier using all training samples. The tuning parameters forθhare 0.8,
0.9, ..., 1.5, and foraare 0.3, 0.4, ..., 1.0. Please see addi-tional file 1 for the source code of the ANMM4CBR method.
Simulation
We first consider simulated data. We used a noisy ver-sion of the simulated data in [23]. The original data assumes three different normal distributions for both insignificant genes (null cases) and significant genes. There are 72 samples (47 positive and 25 negative) in the dataset, and out of 1000 genes there are 10 signifi-cantly differentially expressed ones. Please refer to [23] for more details of this data.
We compared ANMM4CBR with several typical clas-sification methods, including support vector machine (SVM) [7] with linear kernal,k-nearest neighbor (kNN, we set k = 3), and LogitBoost [6]. In the above three algorithms, only LogitBoost is a combination of feature selection and classification. There should be feature selection methods for SVM andkNN classification. Here two feature selection methods were tested. One is the Between-group to Within-group (BW) ratio method described in [9]. The BW ratio for genemis
BW m i k yi k xk m x m
yi k xi m x m
k i
( ) ( ( ) ( ))
( , ( ))
2
2 (15)
wherex(m) andxk(m) denote the average expression
value of genemacross all samples and across samples that only belong to classkrespectively.xi,mis the expression
value of genemin theith sample.〚〛is the indicator function which has been described in Equation (8). Another feature selection method we used is the Mini-mum Redundancy - MaxiMini-mum Relevance (MRMR) method proposed in [16], which has been proved very effective for microarray data analysis. Other than simply picking the top-ranked genes, MRMR also minimizes
redundant information in the selected genes by measuring correlations between different genes. We used the FCQ criterion to optimize MRMR, which means using F-test to compute the maximum relevanceVFand using Pearson
correlation coefficient to compute the minimum redun-dancyWc, and combining them with their quotient, max
(VF/Wc).
The simulated data was randomly and equally divided into three parts, of which two parts were used for train-ing and the third part was used for testtrain-ing. In each experiment we constructed a noisy training data by assigning a randomly chosen, incorrect label to 20% of the training samples. We use noisy data because we want to test the performance of the algorithms confronting noises, which is usually the case for real microarray data. Another reason for the usage of noisy data is, we found that if there is no noise in training data, all algorithms used in this paper can get a 100% testing accuracy if we choose appropriate number of features. We used the noisy training samples to train classifiers and the test error rates were computed by testing samples. In order to obtain more replicable results [24], we repeated this procedure for 100 times. Here we also investigated the performance of ANMM4CBR method without feature pre-selection and sample clustering.
Figure 3 shows the distribution of training samples with top 3 selected features by different feature selection methods. We can see that the BW method cannot well separate the two classes, since the mis-specifications made the data not separable by the BW criterion. In the ANMM method, samples in each class were clustered into many groups, which is illustrated in Figure 3(c). We can see that the mis-specifications were clustered into different groups with the other samples, so that they did not exert great influence to the feature selec-tion procedure. Figure 3(c) shows that the training sam-ples of different classes were well separated, excluding the mis-specifications. The ANMM result without fea-ture pre-selection and sample clustering are listed in Figure 3(b). The result in Figure 3(b) is even worse than that obtained by BW, which shows that feature pre-selection and sample clustering can really improve the performance of ANMM in noisy data.
Real Data
Data sets and experimental set up
In this section we carry out experiments on four pub-licly available real data sets that have been widely stu-died. Brief descriptions of these data sets are as follows. Please refer to the original papers for more details of each data set.
Leukemia
This data comes from a study [3] of 72 leukemia patients using Affymetrix HuGeneFL array. It contains 47 cases of acute lymphoblastic leukemia (ALL) and 25 cases of acute myeloid leukemia (AML) with the expres-sion levels of 7,129 genes.
Colon
The Colon data contains expression levels of 40 tumor and 22 normal colon tissues. The data was analyzed
with an Affymetrix oligonucleotide array complementary to more than 6,500 human genes. We used 2,000 genes with the highest minimal intensity across the samples selected by [25].
SRBCT
The SRBCT data [5] contains gene-expression data from cDNA microarrays of 2308 genes. The 63 samples include four subtypes of small, round blue cell tumors of childhood, which are 12 neuroblastoma (NB), 20 rhabdomyosarcoma (RMS), 8 non-Hodgkin lymphoma (NHL), and 23 Ewing family of tumors (EWS).
GCM
GCM (Global Cancer Map) [26] is a very complicated data, which consists of 198 human tumor samples cov-ering 14 different cancer types. The gene number is 16,063. Please refer to [26] for details of this data set.
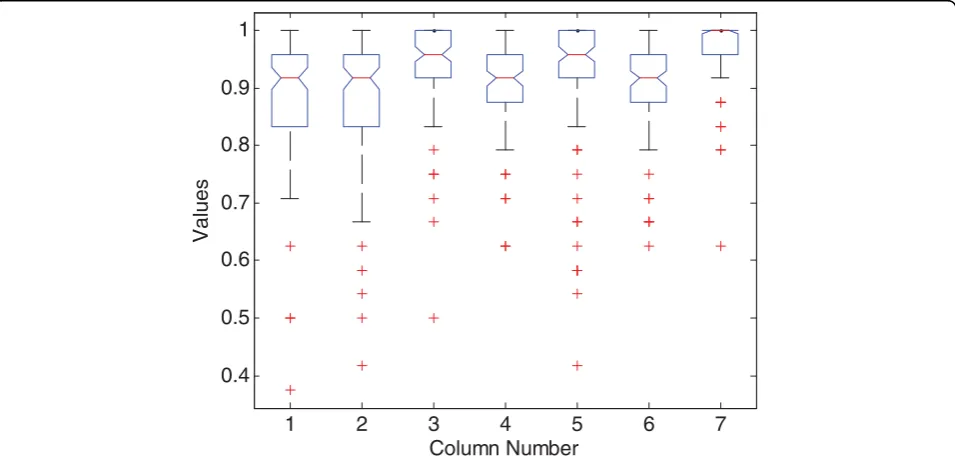
Figure 4Boxplots of the accuracy on simulated data.“Values”indicate the accuracy. Each column indicates different algorithms: 1 - BW +kNN; 2 - MRMR +kNN; 3 BW+SVM; 4 MRMR+SVM; 5 LogitBoost; 6 ANMM4CBR without feature preselection and sample clustering; 7 -ANMM4CBR.
The procedure of each experiment was implemented as that on the simulated data. Each data set was split into three parts, of which two parts for training and the left part for testing. For each method, this procedure was repeated for 100 times, and the averages and stan-dard deviations of accuracy were taken for performance evaluation.
Results
Similar to that on simulated data, here we also com-pared ANMM4CBR with SVM, kNN and LogitBoost. BW and MRMR were used to select features for SVM andkNN classification. Since the standard SVM is tai-lored for binary classification, in multiclass data sets we used the one-versus-all (OVA) [26] approach, which firstly solves many binary problems and then combines the results to solve the multiclass problem. Given a k class problem, OVA trains k binary classifiers, each focuses on classifying one class against the others. A new sample will take the class label of the classifier with the largest real valued output from all kclassifiers. For LogitBoost, we used the same approach of [6], in which multiclass problems were solved by combining OVA results in a Bayes framework.
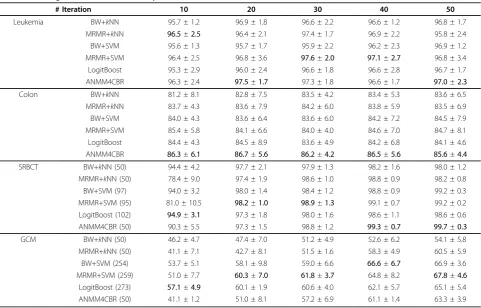
Table 1 gives the classification results of the six meth-ods on the four microarray data sets. The results demonstrate that these algorithms show different perfor-mance on different data sets. On Leukemia data, all methods achieve comparable results, with ANMM4CBR and MRMR+SVM perform slightly better. On Colon data, ANMM4CBR performs better than the other methods by a large margin. We can see that with differ-ent number of selected features, ANMM4CBR consis-tently achieves the highest accuracy. On SRBCT data, the results are different with different numbers of fea-tures. When the feature number is small, SVM and LogitBoost perform better than ANMM4CBR; when the feature number is large, ANMM4CBR performs better. Table 1 also shows that, results of ANMM4CBR on GCM are not encouraging. SVM performs better than the other algorithms on GCM data.
We now take a closer look at the results in Table 1. We can see that ANMM4CBR performs much better than all the other algorithms on the Colon data, while only achieves comparative results on the Leukemia data. This is because Leukemia is a simple data on which many algorithms have reported impressive results. Therefore it
Table 1 Average classification accuracy and standard deviation.
# Iteration 10 20 30 40 50
Leukemia BW+kNN 95.7 ± 1.2 96.9 ± 1.8 96.6 ± 2.2 96.6 ± 1.2 96.8 ± 1.7
MRMR+kNN 96.5±2.5 96.4 ± 2.1 97.4 ± 1.7 96.9 ± 2.2 95.8 ± 2.4
BW+SVM 95.6 ± 1.3 95.7 ± 1.7 95.9 ± 2.2 96.2 ± 2.3 96.9 ± 1.2
MRMR+SVM 96.4 ± 2.5 96.8 ± 3.6 97.6±2.0 97.1±2.7 96.8 ± 3.4
LogitBoost 95.3 ± 2.9 96.0 ± 2.4 96.6 ± 1.8 96.6 ± 2.8 96.7 ± 1.7
ANMM4CBR 96.3 ± 2.4 97.5±1.7 97.3 ± 1.8 96.6 ± 1.7 97.0±2.3
Colon BW+kNN 81.2 ± 8.1 82.8 ± 7.5 83.5 ± 4.2 83.4 ± 5.3 83.6 ± 6.5
MRMR+kNN 83.7 ± 4.3 83.6 ± 7.9 84.2 ± 6.0 83.8 ± 5.9 83.5 ± 6.9
BW+SVM 84.0 ± 4.3 83.6 ± 6.4 83.6 ± 6.0 84.2 ± 7.2 84.5 ± 7.9
MRMR+SVM 85.4 ± 5.8 84.1 ± 6.6 84.0 ± 4.0 84.6 ± 7.0 84.7 ± 8.1
LogitBoost 84.4 ± 4.3 84.5 ± 8.9 83.6 ± 4.9 84.2 ± 6.8 84.1 ± 4.6
ANMM4CBR 86.3±6.1 86.7±5.6 86.2±4.2 86.5±5.6 85.6±4.4
SRBCT BW+kNN (50) 94.4 ± 4.2 97.7 ± 2.1 97.9 ± 1.3 98.2 ± 1.6 98.0 ± 1.2
MRMR+kNN (50) 78.4 ± 9.0 97.4 ± 1.9 98.6 ± 1.0 98.8 ± 0.9 98.2 ± 0.8
BW+SVM (97) 94.0 ± 3.2 98.0 ± 1.4 98.4 ± 1.2 98.8 ± 0.9 99.2 ± 0.3
MRMR+SVM (95) 81.0 ± 10.5 98.2±1.0 98.9±1.3 99.1 ± 0.7 99.2 ± 0.2
LogitBoost (102) 94.9±3.1 97.3 ± 1.8 98.0 ± 1.6 98.6 ± 1.1 98.6 ± 0.6
ANMM4CBR (50) 90.3 ± 5.5 97.3 ± 1.5 98.8 ± 1.2 99.3±0.7 99.7±0.3
GCM BW+kNN (50) 46.2 ± 4.7 47.4 ± 7.0 51.2 ± 4.9 52.6 ± 6.2 54.1 ± 5.8
MRMR+kNN (50) 41.1 ± 7.1 42.7 ± 8.1 51.5 ± 1.6 58.3 ± 4.9 60.5 ± 5.9
BW+SVM (254) 53.7 ± 5.1 58.1 ± 9.8 59.0 ± 6.6 66.6±6.7 66.9 ± 3.6
MRMR+SVM (259) 51.0 ± 7.7 60.3±7.0 61.8±3.7 64.8 ± 8.2 67.8±4.6
LogitBoost (273) 57.1±4.9 60.1 ± 1.9 60.6 ± 4.0 62.1 ± 5.7 65.1 ± 5.4
ANMM4CBR (50) 41.1 ± 1.2 51.0 ± 8.1 57.2 ± 6.9 61.1 ± 1.4 63.3 ± 3.9
is not surprising that all six algorithms in our experiment can have similar good results. In contrast, it was reported in [27] that the Colon data might have a sample contami-nation problem, and therefore the much better perfor-mance of ANMM4CBR on Colon data demonstrated its robustness to noise in the data sets.
Although when the feature number is 40 and 50, ANMM4CBR performs the best on SRBCT, on the two multiclass data sets ANMM4CBR cannot achieve com-parative results with SVM and LogitBoost. It is shown in Table 1 that SVM and LogitBoost perform better than ANMM4CBR, and ANMM4CBR performs better than kNN. However, we argue that this does not indi-cate that ANMM4CBR cannot get good results on mul-ticlass problems. Note that the same as kNN, ANMM4CBR can be directly used to solve a multiclass problem. Therefore in ANMM4CBR method the num-ber of iterations is equal to the numnum-ber of selected fea-tures. But in SVM and LogitBoost algorithms, we used OVA method to make the final prediction, which needs to solve k(class number) binary problems. When each binary classifier selectss features, the total number of selected features will beO(s×c). This means that with the same iteration number, SVM and LogitBoost have to use more features than ANMM4CBR andkNN.
Here we made another experiment on GCM. We compared ANMM4CBR with MRMR+SVM, which showed the best performance on GCM data in Table 1. In each comparison of this experiment, the number of features selected by ANMM4CBR was equal to the total number of genes that are selected for all the binary clas-sifiers. Since we performed experiment for 100 times and in each time the total gene number may be differ-ent, we firstly carried out SVM experiment and then calculated the total number of genes. The results are shown in Table 2, which demonstrate that ANMM4CBR outperforms SVM by a large margin when they choose the same number of genes.
Compare with MOE4CBR
Since ANMM4CBR is a CBR-based method, we would like to compare it with other CBR methods that have been applied to microarray classification problems. Because both source code and data sets used in [11] are not avail-able, we did not compare our method with the gene-CBR method in [11]. We compared ANMM4CBR with the mixture of experts for case-based reasoning (MOE4CBR)
method [12], which builds CBR classifiers based on the idea of mixture of experts. We applied our ANMM4CBR method to the same microarray data with the same experimental set as that in [12],i.e., using the training and testing data suggested in [3] on the Leukemia data, and using leave-one-out cross-validation on the Lung data and average the results obtained from 20 trials. The Lung data contains 39 lung cancer samples with 18,117 gene expres-sion levels. This data set is classified into two categories, recurrence (23 samples) and nonrecurrence (16 samples). The Lung data was not used in previous experiments because there are missing values. The same as that in [12], here missing values were imputed using the weighted k-nearest neighbor method [28].
In [12], the classification accuracies on Leukemia and Lung data are 74% and 70% respectively. 712 out of 7,129 genes were selected for Leukemia data classification and 1,811 out of 18,117 genes were selected for Lung data classification. When the same number of genes are selected, the classification results of ANMM4CBR are 91% on Leukemia and 75% on Lung. Moreover, on the Leukemia data, the best result obtained by ANMM4CBR is 94% when only 23 genes are selected. This shows that ANMM4CBR outperforms MOE4CBR, especially on the Leukemia data set.
Conclusions
In the present work, we proposed a novel ANMM4CBR method for microarray classification. For feature selec-tion, we proposed an ANMM method to additively opti-mize a nonparametric margin maximum criterion which was defined based on feature pre-selection and sample clustering. For classification, we adopted a CBR method, in which samples of each class form a case-base.
Some properties determine that the ANMM4CBR can be well applied to microarray data classification. (1) The near-est between-class distance maximum and furthnear-est within-cluster distance criterion used in ANMM makes the fea-ture selection less sensitive to noise or outliers existing in the data. (2) In classification phase ANMM4-CBR uses a case-based reasoning method, which has been proved to be suitable for life science related problems [10]. (3) In micro-array data the sample number is too small for us to esti-mate the accurate distribution of the data. In each step of ANMM4CBR (including feature pre-selection, clustering, feature selection, classification), we use nonparametric
Table 2 Comparison of MRMR+SVM and ANMM4CBR on GCM data.
s/T 10/86 20/157 30/209 40/243 50/259
SVM+MRMR 51.0 ± 3.7 60.3 ± 4.0 61.8 ± 2.4 64.8 ± 4.5 67.8 ± 3.5
ANMM4CBR 62.7±4.8 66.1±2.4 67.9±3.5 69.1±1.9 70.0±2.9
approaches which require less restrictive assumptions about the original data. (4) There are some links between ANMM feature selection and CBR classifier. Furthermore, ANMM4CBR can directly solve multiclass problems with-out having to convert them to many binary ones.
Our future research will focus on two directions. One is to study how to facilitate the parameters choice and gene number selection in ANMM4CBR. We have sev-eral parameters to tune, and it is time consuming to select a set of optimal parameters when dealing with a new data. Moreover in ANMM4CBR we should pre-spe-cify the number of features to be selected. The other direction is to further investigate the relationship between ANMM and CBR, which was not theoretically warranted in this paper. We believe that a better algo-rithm can be designed by revealing the relationships between feature selection approach and the classifier.
List of abbreviations
ANMM4CBR: additive nonparametric margin maximiza-tion for case-based reasoning; ANMM: additive non-parametric margin maximization; NMM: nonnon-parametric margin maximization; CBR: case-based reasoning; SVM: support vector machine; NN: nearest neighbor; NDA: nonparametric discriminant analysis; MI: mutual infor-mation; BW: between-group to within-group; MRMR: minimum redundancy - maximum relevance.
Additional file 1: We provide the source code and a readme file as an additional file.The code was compiled with Visual Studio 2005. Click here for file
[ http://www.biomedcentral.com/content/supplementary/1748-7188-5-14-S1.ZIP ]
Acknowledgements
We thank Mr. Nan Chen in our laboratory for useful discussion and pre-processing of the data set. This work is supported by the National Natural Science Foundation of PR China (Nos. 60934004, 90709013 and 60721003).
Authors’contributions
SL conceived and coordinated the research. BY designed the algorithms, carried out the experiments and drafted the manuscript. SL participated in the design of the experiments and helped to draft the manuscript. Both authors read and approved the final manuscript.
Competing interests
The authors declare that they have no competing interests.
Received: 4 August 2009
Accepted: 6 January 2010 Published: 6 January 2010
References
1. Heller RA, Schena M, Chai A, Shalon D, Bedilion T, Gilmore J, Woolley DE, Davis RW:Discovering and analysis of inflammatory disease-related genes using cDNA microarrays.P Natl Acad Sci USA1997,94:2150-2155. 2. Eisen MB, Spellman PT, Brown PO, Botstein D:Cluster analysis and display
of genome-wide expression patterns.P Natl Acad Sci USA1998,95 :14863-14868.
3. Golub TR, Slonim DK, Tamayo P, Huard C, Gaasenbeek M, Mesirov JP, Coller H, Loh ML, Downing JR, Caligiuri MA, Bloomfield CD, Lander ES:
Molecular classification of cancer: class discovery and class prediction by gene expression monitoring.Science1999,286:531-537.
4. Berrar D, Bradbury I, Dubitzky W:Instance-based concept learning from multiclass DNA microarray data.BMC Bioinformatics2006,7:73. 5. Khan J, Wei JS, Ringnér M, Saal LH, Ladanyi M, Westermann F, Berthold F,
Schwab M, Antonescu CR, Peterson C, Meltzer PS:Classification and diagnostic prediction of cancers using gene expression profiling and artificial neural networks.Nat Med2001,7:673-679.
6. Dettling M, Bühlmann P:Boosting for tumor classification with gene expression data.Bioinformatics2003,19:1061-1069.
7. Furey TS, Cristianini N, Duffy N, Bednarski DW, Schummer M, Haussler D:
Support vector machine classification and validation of cancer tissue samples using microarray expression data.Bioinformatics2000,16 :906-914.
8. Kolodner J:Case-Based ReasoningMorgan Kaufmann 1993.
9. Dudoit S, Fridlyand J, Speed TP:Comparison of discrimination methods for the classification of tumors using gene expression data.J Am Stat Assoc2002,97:77-87.
10. Jurisica I, Glasgow J:Application of case-based reasoning in molecular biology.Artif Intell Mag2004,25:85-95.
11. Díaz F, Fdez-Riverola F, Corchado JM:Gene-CBR: a case-based reasoning tool for cancer diagnosis using microarray data sets.Comput Intell2006,
22:254-268.
12. Arshadi N, Jurisica I:Data mining for case-based reasoning in high-dimensional biological domains.IEEE T Knowl Data En2005,17:1127-1137. 13. Park PJ, Pagano M, Bonetti M:A nonparametric scoring algorithm for
identifying informative genes form microarray data.Pac Symp Biocomput
2005,6:310-321.
14. Troyanskaya OG, Garber ME, Brown PO, Botstein D, Altman RB:
Nonparametric methods for identifying differentially expressed genes in microarray data.Bioinformatics2002,18:1454-1461.
15. Aamodt A, Plaza E:Case-based reasoning: foundations issues, methodo-logical variations, and system approaches.AI Commun1994,7:39-59. 16. Ding C, Peng H:Minimum redundancy feature selection from microarray
gene expression data.Proceedings of the 2003 IEEE Bioinformatics Conference2003, 523-528.
17. Bressan M, Vitrià J:Nonparametric discriminant analysis and nearest neighbor classification.Pattern Recogn Lett2003,24:2743-2749. 18. Fukunaga K, Mantock J:Nonparametric discriminant analysis.IEEE T
Pattern Anal1983,5:671-678.
19. Li H, Zhang K, Jiang T:Robust and accurate cancer classification with gene expression profiling.Proceedings of the 2005 IEEE Bioinformatics Conference2005, 310-321.
20. Pan W:A comparative review of satistical methods for discovering differentially expressed genes in replicated microarray experiments. Bioinformatics2002,19:546-554.
21. Johnson SC:Hierarchical clustering schemes.Psychometrika1967,32 :241-253.
22. Freund Y, Schapire R:A decision-theoretic generalization of on-line learning and an application to boosting.J Comput Syst Sci1997,55 :119-139.
23. Koo JY, Sohn I, Kim S, Lee JW:Structured polychotomous machine diagnosis of multiple cancer types using gene expression.Bioinformatics
2006,22:950-958.
24. Bouckaert R, Frank E:Evaluating the Replicability of Significance Tests for Comparing Learning Algorithms.Advances in Knowledge Discovery and Data Mining2004,3056:3-12.
25. Alon U, Barkai N, Notterman DA, Gish K, Ybarra S, Mack D, Levine AJ:Broad patterns of gene expression revealed by clustering analysis of tumor and normal colon tissues probed by oligonucleotide arrays.P Natl Acad Sci USA1999,96:6745-6750.
26. Ramaswamy S, Tamayo P, Rifkin R, Mukherjee S, Yeang CH, Angelo M, Ladd C, Reich M, Latulippe E, Mesirov JP, Poggio T, Gerald W, Loda M, Lander ES, Golub TR:Multiclass cancer diagnosis using tumor gene expression signatures.P Natl Acad Sci USA2001,98:15149-15154. 27. Ye J, Li T, Xiong T, Janardan R:Using uncorrelated discriminant analysis
28. Troyanskaya OG, Cantor M, Sherlock G, Brown P, Hastie T, Tibshirani R, Botstein D, Altman RB:Missing value estimation methods for DNA microarrays.Bioinformatics2001,17:520-525.
doi:10.1186/1748-7188-5-14
Cite this article as:Yao and Li:ANMM4CBR: a case-based reasoning method for gene expression data classification.Algorithms for Molecular Biology20105:14.
Submit your next manuscript to BioMed Central and take full advantage of:
• Convenient online submission • Thorough peer review
• No space constraints or color figure charges • Immediate publication on acceptance
• Inclusion in PubMed, CAS, Scopus and Google Scholar
• Research which is freely available for redistribution