R E S E A R C H
Open Access
LVQ-SMOTE – Learning Vector Quantization
based Synthetic Minority Over–sampling
Technique for biomedical data
Munehiro Nakamura
1*, Yusuke Kajiwara
2, Atsushi Otsuka
1and Haruhiko Kimura
1*Correspondence: m-nakamura@ blitz.ec.t.kanazawa-u.ac.jp
1Department of Natural Science
and Engineering, Kanazawa University, Ishikawa 9200941, Japan Full list of author information is available at the end of the article
Abstract
Background: Over-sampling methods based on Synthetic Minority Over-sampling Technique (SMOTE) have been proposed for classification problems of imbalanced biomedical data. However, the existing over-sampling methods achieve slightly better or sometimes worse result than the simplest SMOTE. In order to improve the
effectiveness of SMOTE, this paper presents a novel over-sampling method using codebooks obtained by the learning vector quantization. In general, even when an existing SMOTE applied to a biomedical dataset, its empty feature space is still so huge that most classification algorithms would not perform well on estimating borderlines between classes. To tackle this problem, our over-sampling method generates
synthetic samples which occupy more feature space than the other SMOTE algorithms. Briefly saying, our over-sampling method enables to generate useful synthetic samples by referring to actual samples taken from real-world datasets.
Results: Experiments on eight real-world imbalanced datasets demonstrate that our proposed over-sampling method performs better than the simplest SMOTE on four of five standard classification algorithms. Moreover, it is seen that the performance of our method increases if the latest SMOTE called MWMOTE is used in our algorithm. Experiments on datasets forβ-turn types prediction show some important patterns that have not been seen in previous analyses.
Conclusions: The proposed over-sampling method generates useful synthetic samples for the classification of imbalanced biomedical data. Besides, the proposed over-sampling method is basically compatible with basic classification algorithms and the existing over-sampling methods.
Keywords: Biomedical data, Over-sampling, Learning Vector Quantization, Synthetic Minority Over-sampling Technique
Background
With the arrival of big data society, the number of imbalanced biomedical data has increased, such as microRNA gene prediction [1] and detection of non-coding RNA [2]. Classification of imbalanced biomedical data has been one of the major issues in Bioinformatics. The common understanding of imbalanced data in the community is that the majority samples outnumber the minority samples [3]. The main problem of class imbalances is that most standard classification algorithms
show poor classification performance because they assume or expect balanced class distributions.
Approaches to the class imbalance problem are broadly distinguished into two ways: one is “classification level” and another is “data level”. The classification level aims at adjusting the induction rules that describe the minority concepts which are often weaker than those of the majority concepts. One of the major approaches in the classification level is boosting [4]. The idea of boosting is to increases weights of misclassified samples and reduce the bias of class-imbalance learning. Another approach in the classification level is tree-based learning such as C4.5 [5] and Random Forest [6]. For example, the Random Forest classifier creates many of the minority concepts to avoid the biased learning.
The data level is the modification of an imbalanced dataset to obtain a balanced distribution. There are two major methods in the data level, namely over-sampling and under-sampling. The over-sampling method increases the samples in the minor-ity class, while the under-sampling method decreases the samples in the majorminor-ity class. Both of the methods aim at achieving a well-balanced class distribution. In general, the under-sampling method is used to reduce the learning time of a classification algo-rithm when the data size is larger enough to represent characteristics of the data, while the over-sampling method is used to increase the performance of a classification algorithm. Since approaches in the data level are independent from classification algo-rithms, approaches in the data level are more flexible than those in the classification level.
SMOTE (Synthetic Minority Over-sampling Technique) [7] is a powerful over-sampling method that has shown a great deal of success in class imbalanced problems. The SMOTE algorithm calculates a distance of the feature space between minority exam-ples and creates synthetic data along the line between a minority example and its selected nearest neighbor. Han et al. developed a modified SMOTE called borderline-SMOTE [8]. The concept of their method is to generate synthetic samples near class boundaries. Their algorithms are specifically effective towards binary class problems with two features. However, since biomedical data such as gene expression data are often complex, they contain even thousands of features. Chen et al. presented an adaptive synthetic data generation called a RAMO technique [9]. They have shown in their experiments that the technique of an adapting boosting often increases the performance of the simplest SMOTE. Barua et al. developed a novel over-sampling method called MWMOTE [10], which generates synthetic samples in clusters of infor-mative minority class samples. From their experiments, it is seen that MWMOTE outperforms RAMO and SMOTE on various benchmark datasets including biomedical data.
Methods
Learning Vector Quantization
LVQ is a supervised classification algorithm that has been widely used for various research purposes such as image decompression, clustering, and data visualization. LVQ is one of the neural networks modeled after the human’s visual cortex. Briefly saying, the algorithm of LVQ is a supervised version ofK–means algorithm. As likeK–means, the algorithm of LVQ determines a number of centroids called codebooks for each feature. Figure 1 shows an example of codebooks calculated by LVQ. The data in the figure are taken from Iris dataset (a benchmark dataset in UCI repository [12]), where the num-ber of features is reduced from four to two by the principal component analysis. In the figure, each of the painted colored points represents the numerical value of a codebook. These codebooks are used to determine the class of an unknown sample according to the knearest neighbor rule. Each codebook is randomly placed in the beginning and moves according to a rule based on theK–means algorithm.
There are various modified versions of LVQ developed by Kohonen, namely LVQ2.1, LVQ3, OLVQ3, Multiple-pass LVQ, Hierarchical LVQ [13]. Each of the algorithms is differ in how to determine the position of each codebook.
The proposed over-sampling method
As described in the previous section, the codebooks for each feature in a target dataset are used to determine the class of an unknown sample. Hence, if the codebooks in the target dataset is similar to those in a reference dataset, it is expected that the samples in the reference dataset would provide the target dataset with informative data for its
classification problem. From the idea, this paper presents a method of generating syn-thetic samples using real samples taken from reference datasets according to a similarity measure of codebooks.
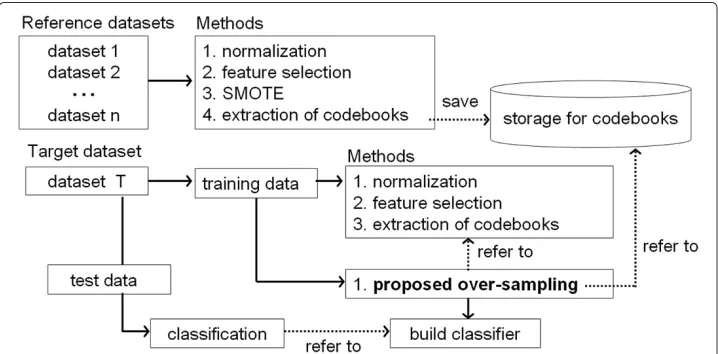
Figure 2 shows a flow of the proposed method. As the figure shows, the proposed over-sampling method refers to a storage for codebooks extracted from reference datasets, and generates synthetic samples for a target dataset. First, we define the number of code-books for each feature in the target datasetT asnand a set of two features inT asTi
(i=1, 2,. . .,nc) wherencis the total number of the combinations of two features. Thus, each ofTi hasn codebooks and two features. Next, regarding the numerical value of
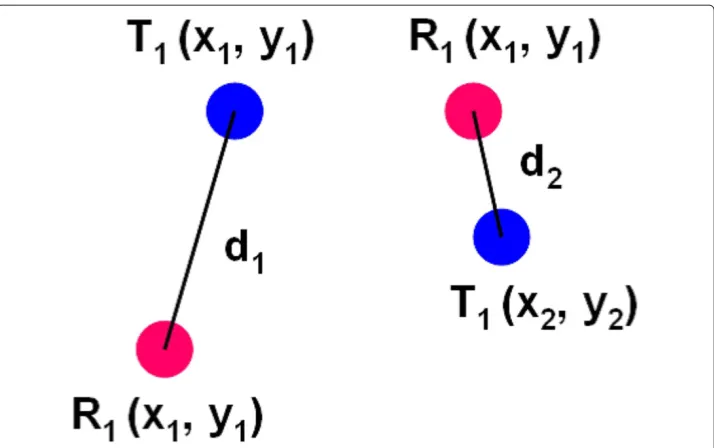
each codebook inT1asT1(xj,yj)(j=1, 2,. . .n), the sum of Euclidean distance between
T1(xj,yj)andR1(xj,yj)of a reference dataset R is calculated. Figure 3 shows an example
of Euclidean distances betweenT1(xj,yj)andR1(xj,yj). In this case, the sum of Euclidean
distance betweenT1andR1isd1+d2. This procedure applies fromR1to all the set of two pairs in the storage. Then,T1is linked to the set of two features which output the minimal sum of Euclidean distance.
Here, we consider the case that T1 is linked to R1. Figure 4 shows an example of synthetic samples generated by our proposed method. As the figure shows, the sam-ples in R1 is added to T1. If the dataset T has more than 3 features, the proposed method determines the numerical values for each of the other features by the following algorithm.
(1) Find the nearest sample for each of the generated synthetic samples according to Maharanobis distance.
(2) The numerical values for each of the other features in the nearest sample are copied to those of the other features in the generated synthetic sample.
The procedures above are conducted for all the set of two features in the training dataset, namely from T1 to Tnc. Finally, the SMOTE algorithm applies toT to obtain
balanced class distribution.
Figure 3 Example of the distance measure.The distance measurement is Euclidean distance.
Results and discussion Datasets
In order to evaluate the classification performance of our method, we have prepared eight imbalanced benchmark datasets as shown in Table 1. In the table, the colon-cancer dataset provided by Alon et al. [14] is a gene expression dataset that aims at normal/abnormal classification of colon-cancer and consists of 62 colon tissue samples with 2000 features. The leukemia dataset [15] aims at the classification of 23 acute myeloid leukemia patients and 49 acute lymphocytic leukemia patients. The other six real-world datasets were obtained from UCI Machine Learning Repository [12]. As highly imbal-anced problems, the satimage dataset and yeast dataset were converted into binary class problem: the class “damp grey soil” and the other classes in satimage, and the class “ME2”
Table 1 Benchmark datasets used for our experiments
Datasets Features Total samples Imbalance ratio
Breast-w 683 10 0.35 : 0.65
Blood 748 4 0.23 : 0.77
Colon-cancer 2000 62 0.35 : 0.65
Ionosphere 351 34 0.36 : 0.64
Leukemia 7129 72 0.34 : 0.66
Pima 768 8 0.35 : 0.65
Satimage 6435 36 0.097 : 0.903
Yeast 1484 8 0.034 : 0.966
and the other classes in yeast. Except for satimage and ionosphere, the other datasets are biomedical data.
Moreover, we performedβ-turn types prediction on BT547 and BT823 dataset [16]. β-turns are classified into nine types based on the dihedral angles of the two center residues in the turn [17]. In this paper, we aim at improving prediction accuracy for DEBUT, which is one of the state-of-the-art methods for predictingβ-turn types [18]. We obtained the datasets used for training and testing DEBT that are available online at http://comp.chem.nottingham.ac.uk/debt/.
Parameter configuration for the proposed over-sampling method
As shown in Figure 1, the normalization and a feature selection method are executed in the proposed method. In our experiments, the normalization applied to change the range of feature values from 0 to 1 in the real number. And then, the principal component analysis, as the feature selection method, extracted 10 useful features according to the component scores in ascending order.
As the parameter of SMOTE techniques in the following section, five nearest neigh-bors were selected in their sample replacement. We selected Optimized Learning Vector Quantization 3 (OLVQ3) as a algorithm of LVQ, where the number of codebooks was configured with two.
Classification algorithms
Table 2 Average G-mean for three cases
G-mean
Classification algorithm Nothing: base line AdaboostM1 SMOTE LVQ-SMOTE
NaiveBayes 76.25% 77.34% 78.54% 78.94%
Logistic Tree 72.88% 74.21% 81.21% 83.64%
Neural Network 75.24% 79.62% 80.44% 80.24%
SVM 72.65% 73.31% 80.92% 83.22%
RandomForest 75.34% 78.96% 79.47% 80.68%
OLVQ3 75.76% 74.35% 80.88% 82.55%
Nothingrepresents that all the datasets were remained as the class imbalanced problem. In the case of SMOTE and LVQ-SMOTE, the minority samples were increased up to the number of the majority samples.
Classification results on the eight imbalanced datasets
In order to estimate the classification performance for our proposed method and comparable methods, the 10-fold cross-validation was performed on each of the eight imbalanced datasets. For instance, we divided each dataset into two parts, namely 10% for testing and the rest 90% for training, while keeping the class distributions as possible as it is. We repeated the 10-fold cross-validation for 20 times in each trial, and calculated the average sensitivity, specificity, and G-mean, which are defined by the following terms, respectively.
Sensitivity= TPTP+FP (1)
Specificity= TNTN+FP (2)
G−mean= Sensitivity+2Specificity (3)
were TP is the number of true positives (correctly identified as sick), FP is the number of false positives (incorrectly identified as sick), and TN is the number of true negatives (correctly identified as healthy).
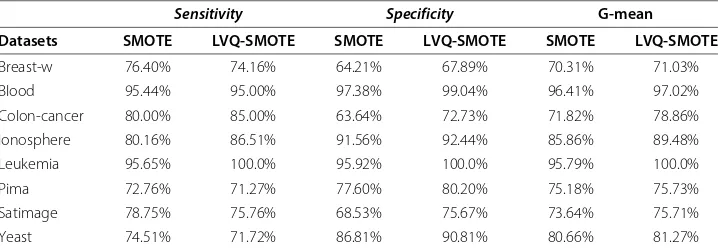
First, the classification of the benchmark datasets was conducted to compare four cases: nothing (no-oversampling), AdaboostM1 [25], SMOTE, and the proposed over-sampling method (LVQ-SMOTE). Table 2 shows the average G-mean for each of the four cases. Except for the case of Neural Network, we can find that our proposed method out-performs both of AdaboostM1 and SMOTE. In this experiment, Logistic Tree output the highest G-mean among the standard classification algorithms. Here, Table 3 shows Sensitivity,Specificity, and G-mean calculated by Logistic Tree for each of the datasets.
Table 3 Sensitivity, Specificity, and G-mean for each of the datasets
Sensitivity Specificity G-mean
Datasets SMOTE LVQ-SMOTE SMOTE LVQ-SMOTE SMOTE LVQ-SMOTE
Breast-w 76.40% 74.16% 64.21% 67.89% 70.31% 71.03%
Blood 95.44% 95.00% 97.38% 99.04% 96.41% 97.02%
Colon-cancer 80.00% 85.00% 63.64% 72.73% 71.82% 78.86%
Ionosphere 80.16% 86.51% 91.56% 92.44% 85.86% 89.48%
Leukemia 95.65% 100.0% 95.92% 100.0% 95.79% 100.0%
Pima 72.76% 71.27% 77.60% 80.20% 75.18% 75.73%
Satimage 78.75% 75.76% 68.53% 75.67% 73.64% 75.71%
Yeast 74.51% 71.72% 86.81% 90.81% 80.66% 81.27%
Table 4 G-mean for our proposed method (LVQ-SMOTE) in case MWMOTE instead of SMOTE is used in our algorithm
Nothing: baseline Our proposed method
Datasets SMOTE MWSMOTE SMOTE MWSMOTE
Breast-w 70.31% 70.59% 71.03% 70.69%
Blood 96.41% 96.50% 97.02% 96.40%
Colon-cancer 71.82% 71.08% 78.86% 79.09%
Ionosphere 85.86% 85.92% 89.48% 91.28%
Leukemia 95.79% 95.92% 100.0% 100.0%
Pima 75.18% 74.07% 75.73% 75.69%
Satimage 73.64% 73.92% 75.71% 77.01%
Yeast 80.66% 81.20% 81.27% 81.38%
The algorithm used in this experiment is Logistic Tree.
Although LVQ-SMOTE output worseSensitivitythan SMOTE in three of eight datasets, both of all theSpecificityand G-mean in LVQ-SMOTE are superior to SMOTE. It is seen that our proposed method significantly improved the classification performance for colon cancer, ionosphere, and leukemia datasets.
Table 4 shows G-mean for LVQ-SMOTE in case one of the latest over-sampling methods called MWMOTE [10] is used instead of SMOTE in our algorithm, where the classification algorithm used in this experiment is Logistic Tree. As the table shows, the G-mean for satimage has been increased by 1.30% by the use of MWMOTE in our algo-rithm, and 5 of 8 G-means have been improved by the use of MWMOTE in our algorithm.
β-turn types prediction
As a classification algorithm, we used the SVM with optimized parameters config-ured in DEBT [18]. We applied our proposed method to the eight benchmark datasets as the reference to generate synthetic samples for the learning data, and seven-fold cross-validation was performed on the BT547 and BT823 dataset, respectively. In order to confirm the effectiveness of our method, SMOTE was not applied to the learning data. Table 5 shows MCC (Matthews Correlation Coefficient),Sensitivity, andSpecificity obtained in the experiment. MCC is defined as below.
MCC= √ TP×TN−FP×FN
(TP+FN)×(TP+FP)×(TN+FP)×(TN+FN) (4)
Table 5 Results ofβ-turns prediction on the BT547 and BT823 dataset
DEBT [18] DEBT + our method
Dataset β-turn type MCC Sensitivity Specificity MCC Sensitivity Specificity
BT547 I 0.38 71.6% 82.6% 0.40 73.7% 85.0%
II 0.33 63.0% 90.8% 0.31 66.7% 86.1%
IV 0.27 69.8% 73.3% 0.38 81.6% 75.2%
VIII 0.14 47.8% 84.4% 0.26 60.3% 84.1%
Non-turn 0.37 21.1% 99.7% 0.39 30.4% 97.6%
BT823 I 0.39 70.6% 84.2% 0.37 71.3% 82.5%
II 0.33 62.7% 91.2% 0.30 61.4% 92.1%
IV 0.27 68.3% 74.4% 0.35 78.4% 78.9%
VIII 0.14 42.2% 87.2% 0.17 47.9% 86.3%
Table 6 Comparison of MCC scores between DEBT + our method, DEBT, and anotherβ-turn type prediction method
Dataset Prediction method I II IV VIII
BT547 DEBT + our method 0.40 0.31 0.38 0.26
DEBT 0.38 0.33 0.27 0.14
X.Shi et al. [26] 0.53 0.55 0.31 0.04
BT823 DEBT + our method 0.37 0.30 0.35 0.17
DEBT 0.38 0.33 0.27 0.14
X.Shi et al. [26] 0.64 0.63 0.32 0.13
And, Table 6 shows MCC scores of DEBT + our method, DEBT, and one of the latest method forβ-turns prediction. From Table 5, the average MCC was improved by 0.05 in BT547 and 0.016 in BT823, and the averageSensitivitywas improved by 7.88% in BT547 and 3.82% in BT823 by using our method. Meanwhile, the averageSpecificitywas slightly decreased, 0.56% in BT547. In Table 6, although MCC of our method on type I and II were lower than that of X.Shi et al., MCC of our method on type IV and VIII were higher than that of X.Shi et al. The type IV and VIII are rare patterns inβ-turns prediction, and it was difficult to predict these types in the existing methods [18]. Since our method can be used to expand the feature space in a rare case. we can say that our method generated useful synthetic samples for type IV and VIII.
Conclusions
This paper has presented a new over-sampling method using codebooks obtained by Learning Vector Quantization. In general, even when an existing SMOTE is applied to a biomedical dataset, it is still difficult to estimate proper borderlines between classes. In order to tackle this problem, we have proposed to generate synthetic samples using code-books obtained by the learning vector quantization. The experimental results on eight real-world benchmark datasets have shown that the proposed over-sampling method gen-erates useful synthetic samples for the classification of imbalanced biomedical data. It is expected that the proposed over-sampling method is basically compatible with basic classification algorithms and the existing over-sampling methods. In addition, experi-ments on datasets forβ-turn types prediction show our proposed method has improved prediction ofβ-turns type IV and VIII.
In the future work, we plan to analyze benchmark datasets for extracting more effective codebooks. Moreover, we would like to improve the proposed algorithm regarding the generation of synthetic samples.
Competing interests
The authors declare that they have no competing interests.
Authors’ contributions
MN designed and developed the over-sampling method, curried out the experiments, analyzed the results and drafted the manuscript. YK participated in the development of the over-sampling method and reviewed the manuscript. AO prepared the datasets used in the experiments and reviewed the manuscript. HK supervised the experiments and edited the manuscript. All authors have read, and approved the manuscript.
Author details
1Department of Natural Science and Engineering, Kanazawa University, Ishikawa 9200941, Japan.2Marine Faculty of
Information Science and Technology, Ritsumeikan University, Shiga 5258577, Japan.
References
1. Batuwita R, palade V:MicroPred: effective classification of pre-miRNAs for human miRNA gene prediction.
Bioinformatics2009,25(8):989–995.
2. Yu C, Chou L, Chang D:Predicting protein-protein interactions in unbalanced data using the primary structure of proteins.BMC Bioinformatics2010,11(167):1–10.
3. Haibo H:Learning from imbalanced data.IEEE Trans Knowledge Data Eng2009,21(9):1263–1284. 4. Freund Y:Boosting a weak learning algorithm by majority.Inform Comput1995,121(2):256–285. 5. Quinlan R:C4.5: Proggrams for Machine Learning. San Francisco: Morgan Kaufmann Publishers; 1993. 6. Breiman L:Random forests.Mach Learn2001,45:5–32.
7. Chawla N, Bowyer K, Hall L, Kegelmeyer W:SMOTE: synthetic minority over-sampling technique.J Art Intell Res 2002,16:321–357.
8. Han H, Wang WY, Mao BH:Borderline-SMOTE: a new over-sampling method in imbalanced data sets learning.
InProc of the 2005 International Conference on Advances in Intelligent Computing.Volume 1. Hefei: Springer; 2005:878–887.
9. Shen S, He H, Garcia E:RAMOBoost: ranked minority oversampling in boosting.IEEE Trans Neural Netw2010,
21(10):1624–1642.
10. Baura S, Islam M, Yao X, Murase K:MWMOTE – majority weighted minority oversampling technique for imbalanced data set learning.IEEE Trans Knowledge Data Eng2012 (PrePrint). doi:10.1109/TKDE.2012.232. 11. Kohonen T:Learning vector quantization.InThe Handbook of Brain Theory and Neural Networks. Cambridge:
MIT Press; 1995:537–540.
12. Frank A, Asuncion A:UCI Machine Learning Repository. Irvine; 2010. http://archive.ics.uci.edu/ml/. 13. Kohonen T:LVQ PAK: The Learning Vector Quantization Program Package; 1996.
http://www.cis.hut.fi/research/lvq_pak/.
14. Alon U, Barkai N, Notterman D, Gish K, Barra S, Mack D, Levine A:Broad patterns of gene expression revealed by clustering analysis of tumor and normal colon tissues probed by oligonucleotide arrays.Proc Natl Acad Sci USA1999,96:6745–6750.
15. Golub T:Molecular classification of cancer: class discovery and class prediction by gene expression monitoring.Science1999,286(5439):531–537.
16. Fuchs P, Alix A:High accuracy prediction of beta-turns and their types using propensities and multiple alignments.Proteins2005,59(4):828–839.
17. Hutchinson E, Thornton J:A revised set of potentials for beta-turn formation in proteins.Protein Sci1994,
3(12):2207–2216.
18. Kountouris P, Hirst J:Predictingβ-turns and their types using predicted backbone dihedral angles and secondary structures.BMC Bioinformatics2010,11(407):1–11.
19. Cortes C, Vapnik V:Support-vector networks.Mach Learn1995,20(3):273–297.
20. Marc S, Eibe F, Mark H:Speeding up logistic model tree induction.InProc of 9th European Conference on Principles and Practice of Knowledge Discovery in Databases. Porto: Springer; 2005:675–683.
21. Rumelhart D, Hinton G, Williams R:Learning Internal Representations by Error Propagation, Volume 1. Cambridge: MIT Press; 1986.
22. George H, Pat L:Etimating continuous distributions in bayesian classifiers.InProc of the Eleventh Conference on Uncertainty in Artificial Intelligence. San Francisco: Morgan Kaufmann Publishers Inc.; 1995:338–345.
23. Chang C, Lin J:LIBSVM: a library for support vector machines.ACM Trans Intell Syst Technol2011,2(27):531–537. 24. Mark H, Eibe F, Geoffrey H, Bernhard P, Peter R, Ian H:Weka 3: data mining software in Java.ACM SIGKDD
Explorations Newsletter; 2009. Machine Learning Group at the University of waikato. http://www.cs.waikato.ac.nz/ml/weka/.
25. Yaov F, Robert E:A decision-theoretic generalization of on-line learning and an application to boosting.
J Comput Syst Sci1995,55:119–139.
26. Shi X, Hu X, Li S, Liu X:Prediction ofβ-turn types in protein by using composite vector.J Theor Biol2011,
286(1):24–30.
doi:10.1186/1756-0381-6-16
![Figure 1 Example of codebooks obtained by Learning Vector Quantization. These codebooks areextracted from the samples in Iris dataset [12]](https://thumb-us.123doks.com/thumbv2/123dok_us/361568.1528744/3.595.119.476.432.696/figure-example-codebooks-obtained-learning-quantization-codebooks-areextracted.webp)