Page | 47
Measuring Predictability of Oil and Gas Stock Returns and
Performance of Moving Average Trading Rules
Muhammad Surajo SANUSI
*a, Farooq AHMAD
ba
Department of Accounting and Finance, Birmingham City University, United Kingdom
b
Department of Accounting and Finance, Robert Gordon University, United Kingdom
Abstract
The paper re-examines whether investors can predict oil and gas stock prices for
abnormal returns using autocorrelation-based trading and filter rules and moving
average strategies. In this paper, short and long lengths moving averages are
employed and their performances are measured against the returns from simple
buy and hold investment strategy. As a result, the paper finds that employed
trading rules do not indicate that investors can make abnormal returns in oil and
gas stocks. Moreover, the performances of short and long moving averages in
predicting abnormal returns also do not suggest a conclusive evidence that any of
the moving averages can result in more returns compared to others.
Keywords:
Trading and Filter Rules; Moving Average Trading Rule; Buy and Hold
Investment Strategy; Oil and Gas Stock Returns.
JEL Classification:
G100, G120.
*
Corresponding author.
E-mail addresses: [email protected] (M.S.Sanusi), [email protected]
(F.Ahmad).
Journal of Economics and Financial Analysis
Type: Double Blind Peer Reviewed Scientific Journal
Printed ISSN: 2521-6627 | Online ISSN: 2521-6619
Publisher: Tripal Publishing House | DOI:10.1991/jefa.v3i1.a23
Received: 23.11.2018 | Accepted: 15.01.2019 | Published: 22.03.2019
Page | 48
1. Introduction
Technical trading rules are employed by traders to generate buy or sell
signals on their investment based on the behaviour of past stock prices. According
to Fama (1970), the theory of efficient market hypothesis postulates that trading
rules cannot provide any credible signals to the advantage of investors because
prices already reflect all relevant information. However, the popularity of the
trading rules in the marketplace suggests the possibility of their power in
predicting abnormal returns. The presence of serial correlation in return series
could be an indication of non-randomness of stock returns, but it is not enough to
classify a market as inefficient. A market can only be classified as inefficient if past
autocorrelation in prices can be used by traders to earn an abnormal profit after
considering transaction costs. Oil and gas industry remains one of the important
sectors of every economy, and it will be interesting to see if investors can use
technical trading rules to earn more than risk-adjusted returns in the oil and gas
stocks.
2. Literature Review
Brock et al (1992) have tested the performance of simple trading rules using
a moving average on the Dow Jones index ranging from 1897 to 1986. Their
results showed the possibility of realising an abnormal profit from the movement
of stock prices. It proves the usefulness of technical trading rules and their
predictive ability regarding trading in stocks. Hudson et al (1996) did a similar
study on the UK data employing the methodology used in Brock et al (1992). Their
results also showed the predictive power of trading rules, but concluded that it
was difficult to make any abnormal profit due to high transaction costs in the
market. Mills (1997) investigated the predictive ability of simple trading rules,
moving average, on the FTSE 30 share index for the period 1935-1994, and
reported higher returns as compared to buy and hold investment strategy for
most of the study period. It was noted that trading rules performed well in the
period prior to 1980. Overall, the results of these studies were consistent with
that of Brock et al (1992).
Page | 49
returns used by many scholars. Gunasekarage and Power (2001) tested and
compared the profitability of moving average trading rules in South-Asian markets
of Bombay, Colombo, Dhaka and Karachi Stock Exchanges. The findings of their
study suggested a strong predictive ability of trading rules except for the Bombay
Stock Exchange. Yu et al (2003), Park and Irwin (2007), Loh (2007), Sehgal and
Gupta (2005) also found evidence of predictive ability and profitability of trading
rules in various Asian markets.
Coutts and Cheung (2000) investigated whether the moving average
oscillator and the trading range break-out trading rules have predictive power in
the Hang Seng Index of the Hong Kong Stock Exchange for the period 1985 to
1997. Although, the trading range break-out rule was found to be stronger than
the moving average oscillator, both rules would fail to provide an abnormal profit
if transaction costs are taking into consideration. Milionis and Papanagiotou
(2008) have conducted a study on the variation of the moving average trading
rules performances based on the length of longer moving average periods. The
analysis was carried out on the NYSE and the Athens Stock Exchange daily data for
the period April 1993 to April 2005. Significant variability of performance between
the different lengths of the moving average trading rules was observed. Shorter
length moving averages had enhanced-performance compared to longer length
moving average trading rules. It was also discovered that seventy-five percent of
the trading signals by moving average trading rules are not realistic.
3. Methodology and Results
This study will apply trading and filter-based rules that have been developed
to trade in the presence of autocorrelation or persistence in the returns of oil and
gas stocks in the UK market. It will also employ various combinations of moving
averages to see the performances of these strategies as compared to buy and
hold returns. The results from the moving averages trading rules are subjected to
further tests to assess their individual performance in predicting the oil and gas
related stock returns.
3.1. Trading and Filter Rules
Page | 50
stock that has a given positive return, and sell the stock if the return changes to
negative, investing the proceeds (cash) in a risk-free asset such as treasury bills.
The trading rule will be tested using a hypothetical initial investment of £1, and
the closing value of the investment over the sample period is given by:
𝐽𝐽
𝑇𝑇
(𝐴𝐴𝐴𝐴𝐴𝐴𝐴𝐴𝐴𝐴𝐴𝐴) =
𝐴𝐴
(
∑
𝑇𝑇𝐴𝐴=1𝛼𝛼
𝐴𝐴𝑟𝑟
𝐴𝐴+(1
−𝛼𝛼
𝐴𝐴)
𝑟𝑟𝑟𝑟
𝐴𝐴)
(1)
where
J
T(Active)
is closing value of £1 hypothetical investment using the trading
rule;
e is Exponential (or investment); r
tand
rf
tare return and risk-free rate of
return at period t respectively. The a is as following.
𝛼𝛼
𝐴𝐴
=
�
1, 𝐴𝐴𝑟𝑟 𝑟𝑟
𝐴𝐴−
1
> 0
0 , 𝐴𝐴𝑟𝑟 𝑟𝑟
𝐴𝐴−
1
< 0
𝛼𝛼
𝐴𝐴−
1
,
𝐴𝐴𝑟𝑟 𝑟𝑟
𝐴𝐴−
1
= 0
This shows that whenever 𝑟𝑟
𝐴𝐴−
1
is positive, there will be no investment in the
risk-free asset because of the buy signal (investment in stock), and if
𝑟𝑟
𝐴𝐴−
1
is
negative there will be an investment in the risk-free asset because of the sell
signal (cash from sale). The previous action will be maintained (no present action)
if 𝑟𝑟
𝐴𝐴−
1
is equalled to zero. The strategy generates a high number of trading
transactions in each stock over the sample period. In order to reduce the trading
transactions, filters to return thresholds are introduced to the trading rule (see
also the work of Alexander (1961)), where signals are only generated if return
limits are reached. The filters used are 0.05%, 0.1%, 0.15%, 0.2%, 0.3%, 0.4%,
0.5%, 0.6%, 0.7%, 0.8%, 0.9%, and 1%. In each of the filters, the number of trading
transactions, trading profit, and break-even cost are calculated for assessment.
The trading profit from the employed trading strategy or rule is compared
with that from an ordinary buy and hold strategy to assess the power of the
trading rule and weak form market efficiency. The buy and hold investment
strategy is represented by the ‘J
T(Static)’ which is given as:
𝐽𝐽
𝑇𝑇
(𝑆𝑆𝐴𝐴𝑆𝑆𝐴𝐴𝐴𝐴𝐴𝐴) =
𝐴𝐴
(
∑
𝑇𝑇𝐴𝐴=1𝑟𝑟
𝐴𝐴)
(2)
where J
T(Static) is buy and hold investment strategy and other parameters are as
defined above.
Page | 51
𝐵𝐵𝐵𝐵
=
𝑙𝑙𝑙𝑙�𝐽𝐽
𝑇𝑇
(𝐴𝐴𝐴𝐴𝐴𝐴𝐴𝐴𝐴𝐴𝐴𝐴)� − 𝑙𝑙𝑙𝑙�𝐽𝐽
𝑠𝑠
𝑇𝑇
(𝑆𝑆𝐴𝐴𝑆𝑆𝐴𝐴𝐴𝐴𝐴𝐴)�
(3)
where BC stands for the break-even cost; ln represents the natural logarithm and
s indicates the number of trading transactions. The strategy is employed on the
FTSE indices and all of the oil and gas stock series for three years from January
2014 to December 2016. Stocks that have less than three years series are
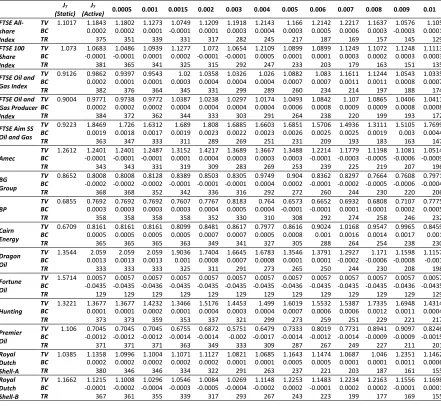
excluded from the analysis and the results are presented in Table 1.
Table 1.
Trading and Filter Rules based on Autocorrelation Persistence for Indexes/Series
(Static) JT (Active) JT 0.0005 0.001 0.0015 0.002 0.003 0.004 0.005 0.006 0.007 0.008 0.009 0.01 FTSE
All-share Index
TV 1.1017 1.1843 1.1802 1.1273 1.0749 1.1209 1.1918 1.2143 1.166 1.2142 1.2217 1.1637 1.0576 1.105 BC 0.0002 0.0002 0.0001 -0.0001 0.0001 0.0003 0.0004 0.0003 0.0005 0.0006 0.0003 -0.0003 0.0001 TR 375 351 339 331 317 282 245 217 187 169 157 145 129 FTSE 100
Share Index
TV 1.073 1.0683 1.0486 1.0939 1.1277 1.072 1.0654 1.2109 1.0899 1.0899 1.1249 1.1072 1.1248 1.1113 BC -0.0001 -0.0001 0.0001 0.0002 -0.0001 -0.0001 0.0005 0.0001 0.0001 0.0003 0.0002 0.0003 0.0003 TR 381 365 341 325 315 292 247 233 203 179 163 151 135 FTSE Oil and
Gas Index
TV 0.9126 0.9862 0.9397 0.9543 1.02 1.0358 1.0326 1.026 1.0882 1.083 1.1611 1.1244 1.0543 1.0335 BC 0.0002 0.0001 0.0001 0.0003 0.0004 0.0004 0.0004 0.0007 0.0007 0.0011 0.0011 0.0008 0.0007 TR 382 376 364 345 331 299 289 260 234 214 197 188 174 FTSE Oil and
Gas Producer Index
TV 0.9004 0.9771 0.9738 0.9772 1.0387 1.0238 1.0297 1.0174 1.0493 1.0842 1.107 1.0865 1.0406 1.0411 BC 0.0002 0.0002 0.0002 0.0004 0.0004 0.0004 0.0004 0.0006 0.0008 0.0009 0.0009 0.0008 0.0008 TR 384 372 362 344 333 303 291 264 238 220 199 193 172 FTSE Aim SS
Oil and Gas
TV 0.9223 1.8469 1.726 1.6312 1.689 1.808 1.6885 1.6603 1.6851 1.5706 1.4936 1.3111 1.5105 1.7699 BC 0.0019 0.0018 0.0017 0.0019 0.0023 0.0022 0.0023 0.0026 0.0025 0.0025 0.0019 0.003 0.0044 TR 363 347 333 311 289 269 251 231 209 193 183 163 147
Amec TV BC 1.2612 1.2401 1.2401 1.2487 1.3152 1.4217 1.3689 1.3667 1.3488 1.2214 1.1779 1.1198 1.1081 1.0514 -0.0001 -0.0001 -0.0001 0.0001 0.0004 0.0003 0.0003 0.0003 -0.0001 -0.0003 -0.0005 -0.0006 -0.0009 TR 343 343 331 319 309 283 269 253 239 225 219 207 196 BG
Group
TV 0.8652 0.8008 0.8008 0.8128 0.8389 0.8503 0.8305 0.9749 0.904 0.8362 0.8297 0.7664 0.7608 0.7971 BC -0.0002 -0.0002 -0.0002 -0.0001 -0.0001 -0.0001 0.0004 0.0002 -0.0001 -0.0002 -0.0005 -0.0006 -0.0004 TR 368 368 352 342 336 316 292 272 260 244 230 220 206
BP TV BC 0.6855 0.7692 0.7692 0.7692 0.7607 0.7767 0.8183 0.0003 0.0003 0.0003 0.0003 0.0004 0.0005 0.0004 -0.0001 -0.0001 0.0001 -0.0001 0.0002 0.0005 0.764 0.6573 0.6652 0.6932 0.6808 0.7107 0.7775 TR 358 358 358 358 352 330 310 308 292 274 258 246 232 Cairn
Energy
TV 0.6709 0.8161 0.8161 0.8161 0.8099 0.8481 0.8617 0.7977 0.8616 0.9024 1.0168 0.9547 0.9965 0.8459 BC 0.0005 0.0005 0.0005 0.0005 0.0007 0.0007 0.0005 0.0008 0.001 0.0016 0.0014 0.0017 0.001 TR 365 365 365 363 349 341 327 305 288 264 254 238 230 Dragon
Oil
TV 1.3544 2.059 2.059 2.059 1.9036 1.7404 1.6645 1.6783 1.3546 1.3791 1.2927 1.171 1.1598 1.1157 BC 0.0013 0.0013 0.0013 0.001 0.0008 0.0007 0.0008 0.0001 0.0001 -0.0002 -0.0006 -0.0008 -0.001 TR 333 333 333 325 311 291 273 265 250 244 230 208 198 Fortune
Oil
TV 1.5714 0.0057 0.0057 0.0057 0.0057 0.0057 0.0057 0.0057 0.0057 0.0057 0.0057 0.0057 0.0057 0.0057 BC -0.0435 -0.0435 -0.0436 -0.0435 -0.0435 -0.0435 -0.0435 -0.0436 -0.0435 -0.0435 -0.0435 -0.0436 -0.0435 TR 129 129 129 129 129 129 129 129 129 129 129 129 129
Hunting TV BC 1.3221 1.3677 1.3677 1.4232 1.3466 1.5176 1.4453 0.0001 0.0001 0.0002 0.0001 0.0004 0.0003 0.0004 0.0007 0.0006 0.0006 0.0012 0.0011 0.0004 1.499 1.6019 1.5532 1.5387 1.7335 1.6948 1.4314 TR 373 373 359 353 337 321 299 273 259 251 229 221 217 Premier
Oil
TV 1.106 0.7045 0.7045 0.7045 0.6755 0.6872 0.5751 0.6479 0.7333 0.8019 0.7731 0.8941 0.9097 0.8246 BC -0.0012 -0.0012 -0.0012 -0.0014 -0.0014 -0.002 -0.0017 -0.0014 -0.0012 -0.0014 -0.0009 -0.0009 -0.0015 TR 371 371 371 363 349 333 309 287 267 249 227 211 201 Royal
Dutch Shell-A
TV 1.0385 1.1358 1.0996 1.1004 1.1071 1.1127 1.0821 1.0685 1.1643 1.1474 1.0687 1.046 1.2351 1.1462 BC 0.0002 0.0002 0.0002 0.0002 0.0002 0.0001 0.0001 0.0005 0.0005 0.0001 0.0001 0.0011 0.0006 TR 380 346 346 334 322 291 263 237 221 203 187 161 155 Royal
Dutch Shell-B
Page | 52
Table 1.
(
continues)
(Static) JT (Active) JT 0.0005 0.001 0.0015 0.002 0.003 0.004 0.005 0.006 0.007 0.008 0.009 0.01 Tullow
Oil
TV 0.9561 1.2443 1.2443 1.224 1.2347 1.07 0.9856 0.8255 0.7792 0.8239 0.9394 0.8531 0.7901 0.8693 BC 0.0007 0.0007 0.0007 0.0007 0.0003 0.0001 -0.0004 -0.0007 -0.0005 -0.0001 -0.0004 -0.0007 -0.0004 TR 369 369 365 361 357 345 333 309 295 271 257 255 239
Aminex TV BC 0.3077 0.0092 0.0092 0.0092 0.0092 0.0092 0.0092 0.0092 0.0092 0.0092 0.0092 0.0092 0.0092 0.0092 -0.0358 -0.0358 -0.0358 -0.0358 -0.0358 -0.0358 -0.0358 -0.0358 -0.0358 -0.0358 -0.0358 -0.0358 -0.0358
TR 98 98 98 98 98 98 98 98 98 98 98 98 98
JKX Oil and Gas
TV 0.2596 1.2644 1.2644 1.2644 1.2644 1.2644 1.3501 1.2073 1.1649 1.1618 1.1465 1.1465 1.0975 0.9521 BC 0.0049 0.0049 0.0049 0.0049 0.0049 0.0053 0.0052 0.0051 0.0053 0.0056 0.0056 0.0057 0.0052 TR 321 321 321 321 321 311 297 295 283 267 267 255 249 Soco Inter-
national
TV 1.0346 0.8521 0.8521 0.8521 0.8521 0.847 0.8098 0.986 0.9559 1.0091 1.0509 0.9242 0.9438 0.8928 BC -0.0006 -0.0006 -0.0006 -0.0006 -0.0006 -0.0007 -0.0002 -0.0003 -0.0001 0.0001 -0.0004 -0.0004 -0.0006 TR 353 353 353 353 349 329 313 303 283 273 261 247 241 Wood
Group
TV 2.284 1.6436 1.6436 1.6759 1.6631 1.6235 1.4991 1.3401 1.4423 1.4525 1.6917 1.5042 1.6311 1.7665 BC -0.0009 -0.0009 -0.0009 -0.001 -0.0011 -0.0014 -0.0019 -0.0018 -0.0019 -0.0014 -0.002 -0.0018 -0.0015 TR 355 355 339 329 321 301 279 258 235 215 209 189 177
Afren TV BC 1.4444 1.4769 1.4769 1.4769 1.4769 1.4769 1.4769 1.5052 1.2979 1.3638 1.2256 1.3385 1.0909 1.1956 0.0001 0.0001 0.0001 0.0001 0.0001 0.0001 0.0001 -0.0004 -0.0002 -0.0006 -0.0003 -0.0011 -0.0008 TR 315 315 315 315 315 315 311 305 285 281 267 259 241 Hardy Oil
and Gas
TV 0.3699 0.3009 0.3009 0.3009 0.3009 0.3009 0.3009 0.3009 0.2886 0.383 0.3966 0.38 0.3956 0.4068 BC -0.0006 -0.0006 -0.0006 -0.0006 -0.0006 -0.0006 -0.0006 -0.0007 0.0001 0.0002 0.0001 0.0002 0.0003 TR 362 362 362 362 362 362 362 358 342 336 332 328 324
Petrofac TV BC 1.7135 1.1803 1.1085 1.1813 1.1027 1.0625 1.1365 1.0301 1.0178 0.9887 0.9356 1.0619 1.0623 1.0593 -0.001 -0.0012 -0.0011 -0.0013 -0.0014 -0.0013 -0.0017 -0.0018 -0.002 -0.0023 -0.002 -0.0021 -0.0023 TR 365 361 351 339 331 311 303 291 275 261 235 225 207 Salamander
Energy
TV 0.786 1.4185 1.4185 1.4185 1.4185 1.4185 1.4185 1.4354 1.4463 1.519 1.521 1.337 1.3098 1.2538 BC 0.0018 0.0018 0.0018 0.0018 0.0018 0.0018 0.0019 0.0019 0.0022 0.0024 0.002 0.0021 0.002 TR 329 329 329 329 329 329 323 313 297 271 260 248 238
Lamprell TV BC 0.5 0.7235 0.7235 0.7235 0.7348 0.7451 0.8392 1.0267 1.1096 0.9859 0.9628 0.8847 0.8305 0.8132 0.0011 0.0011 0.0011 0.0011 0.0012 0.0016 0.0024 0.0028 0.0024 0.0025 0.0022 0.002 0.0019 TR 349 349 349 347 341 321 297 283 279 267 261 253 251 Endeavor
Int. Corp.
TV 0.3467 0.644 0.644 0.644 0.6389 0.6399 0.6779 0.4576 0.3431 0.2064 0.1989 0.209 0.2202 0.2958 BC 0.0018 0.0018 0.0018 0.0018 0.0019 0.0022 0.001 0 -0.0022 -0.0026 -0.0027 -0.0027 -0.0011 TR 343 343 343 335 325 307 267 247 231 215 189 167 151 Cadogan
Petroleum
TV 0.8235 0.0848 0.0848 0.0848 0.0848 0.0848 0.0848 0.0848 0.0848 0.0848 0.0848 0.0848 0.0848 0.0882 BC -0.0093 -0.0093 -0.0093 -0.0093 -0.0093 -0.0093 -0.0093 -0.0093 -0.0093 -0.0093 -0.0093 -0.0093 -0.0092 TR 244 244 244 244 244 244 244 244 244 244 244 244 242 Heritage
Oil
TV 0.5369 1.2469 1.2469 1.2469 1.2469 1.2166 1.2077 1.2343 1.2152 0.7997 0.7628 0.7413 0.7283 0.8525 BC 0.0027 0.0027 0.0027 0.0027 0.0026 0.0027 0.0028 0.0028 0.0014 0.0013 0.0012 0.0012 0.0018 TR 311 311 311 311 309 305 297 291 285 279 271 265 253
Kentz TV BC 1.9403 3.6933 3.6933 3.6933 2.7518 2.8494 2.6795 2.2808 2.0159 2.0635 2.2498 2.2096 2.3077 2.2371 0.0023 0.0023 0.0023 0.0013 0.0015 0.0014 0.0007 0.0002 0.0003 0.0009 0.0009 0.0014 0.0012 TR 278 278 278 268 258 238 218 198 182 166 144 126 122 Exillon
Energy
TV 0.85 3.0368 3.0368 3.0368 3.2219 3.1274 3.6215 3.803 3.3837 3.3185 3.2556 3.0489 2.8989 2.673 BC 0.0045 0.0045 0.0045 0.0049 0.0048 0.0056 0.0058 0.0055 0.0057 0.0057 0.0055 0.0056 0.0054 TR 285 285 285 271 271 261 259 251 241 235 233 221 213
Notes:
TV
is terminal value of initial £1 investment.
J
T(Static)
represents the terminal value
of investment using buy and hold strategy, whereas
J
T(Active)
represents the terminal
Page | 53
Table 1 presents the results of trading and filter rules applied to the oil and
gas stock returns. Breakeven costs are used to assess whether the generated
profit from the technical trading rule is higher than that from the simple buy and
hold strategy on the assumption that transaction cost or commission must be paid
on every transaction (see notes attached to the Table). It is interesting to note
from the results that the breakeven cost per transaction in most of the stock
series is very negligible (in some cases negative) which will be lower than
transaction costs of trading in these stocks. In that case, the trading profit cannot
be higher than that from the simple buy and hold strategy after considering the
transaction costs. The application of simple trading rules on the FTSE market
indices does not indicate the possibility of earning abnormal returns due to
meagre breakeven cost except in the FTSE UK AIM SS Oil and Gas index which has
comparatively high breakeven costs, which signifies the possibility of profits from
trading rule-based strategies. Dragon Oil, JKX Oil and Gas, Salamander Energy,
Endeavor International Corporation, Heritage Oil, Kentz and Exillon Energy also
show results similar to that of the FTSE AIM SS Oil and Gas index. The common
factor in these observations is the low level of liquidity in these stocks. The very
low number of transactions in these stocks will hinder the scope of applying these
trading rules due the lack of active buyers and sellers in these stocks.
3.2. Moving Average-based strategies
The moving average trading rule is one of the simplest technical trading rules
used by chartists to generate ‘buy’ and ‘sell’ signals based on the history of stock
prices. According to Achelis (1995), a simple moving average is calculated as an
average of stock prices over a given period ‘t’ and changes over time due to the
inclusion of new daily stock prices. He also described the moving average as an
agreement or consensus of investors’ expectation over the averaging time.
Moving averages could be simple (arithmetic), exponential, triangular, variable
and weighted. The difference between the various types of moving average
depends on the weight given to the new variable (stock price) added to the
moving average. In this study, the simple moving average will be considered
which seems to be one of the most prominent trading strategies in the literature.
Page | 54
‘buy’ and ‘sell’ signals. The strategy signals a ‘buy’ transaction if the short period
moving average rises or crosses above the long period moving average and a ‘sell’
transaction if the short period moving average falls or crosses below the long
period moving average. The simple moving average adopted by Brock et al (1992)
encompasses the variable moving average (VMA) and the fixed moving average
(FMA). In the variable moving average (VMA), a day is classified as buy (sell) if the
short moving average lies above (below) the long moving average. The fixed
moving average designates a buy (sell) signal immediately the short moving
average crosses the long moving average from below (above). The use of both
short and long period moving averages at the same time was justified by the
scholars as an attempt to stabilise any high volatility in the series. Although,
various combinations of short and long period moving averages such as 1-200,
2-200, 5-150 and 1-150 were used in the literature, Brock et al (1992) had
emphasised the short and long periods to be ‘𝑆𝑆 ≤
5
′
and
′
𝐿𝐿 ≥
50
′
respectively as
the most popular range employed by scholars, as cited by Taylor (2005).
This paper employs the same moving average (Fixed Moving Average)
methodology employed by Brock et al (1992) to test whether an abnormal profit
can be obtained from our series that show evidence of serial correlation. The
parameters of short and long moving averages and the yardstick for investment
decisions (buy and sell) are defined according to the representation of Mills
(1998) as follows:
𝑆𝑆
𝐴𝐴
(𝑙𝑙) =
1
𝑙𝑙 � 𝑥𝑥
𝐴𝐴−𝐴𝐴
𝑙𝑙−
1
𝐴𝐴
=0
(4)
𝐿𝐿
𝐴𝐴
(𝑚𝑚) =
𝑚𝑚 � 𝑥𝑥
1
𝐴𝐴−𝐴𝐴
𝑚𝑚−
1
𝐴𝐴
=0
(5)
𝑆𝑆
𝐴𝐴
(𝑙𝑙) >
𝐿𝐿
𝐴𝐴
(𝑚𝑚) =
𝐵𝐵𝐵𝐵𝐵𝐵 (6)
𝑆𝑆
𝐴𝐴
(𝑙𝑙) <
𝐿𝐿
𝐴𝐴
(𝑚𝑚) =
𝑆𝑆𝐴𝐴𝑙𝑙𝑙𝑙 (7)
where
S
t(n) is short period (n) moving average; L
t(m) is long period (m) moving
average in which (m>n); and x
tis variable at period t which represents stock price
in this study.
Page | 55
t
−
statistics for the buy and sell mean returns =
𝜇𝜇
𝑟𝑟
− 𝜇𝜇
�𝜎𝜎
𝑁𝑁
2
+
𝜎𝜎
𝑁𝑁
2
𝑟𝑟
�
1/2
(8)
where ;
𝜇𝜇
𝑟𝑟
= Mean return for the ‘buy’ or ‘sell’ transactions
𝜇𝜇
= Mean return for the buy and hold strategy (mean of the full sample)
𝜎𝜎
2
= Variance of the full sample
𝑁𝑁
= Number of full sample
𝑁𝑁
𝑟𝑟
= Number of signals (days) for the ‘buy’ or ‘sell’ transaction
t
−
statistics for the (buy
−
sell) mean returns =
𝜇𝜇
𝑏𝑏
− 𝜇𝜇
𝑠𝑠
�𝜎𝜎
𝑁𝑁
2
𝑏𝑏
+
𝜎𝜎
2
𝑁𝑁
𝑠𝑠
�
1/2
(9)
where ;
𝜇𝜇
𝑏𝑏
= Mean return for the ‘buy’ transactions
𝜇𝜇
𝑠𝑠
= Mean return for the ‘sell’ transactions
𝜎𝜎
2
= Variance of the full sample
𝑁𝑁
𝑏𝑏
= Number of signals (days) for the ‘buy’ transactions
𝑁𝑁
𝑠𝑠
=
Number of signals (days) for the ‘sell’ transactions
Page | 56
Similarly, t-statistics (and critical values) are used to accept or reject the null
hypothesis of equality. Rejection of the null hypothesis will mean that the values
(buy and sell mean returns) are significantly different which demonstrates that
the signals are meaningful.
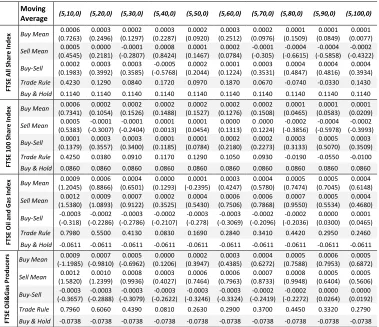
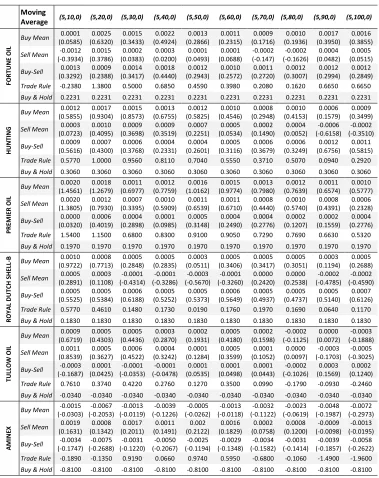
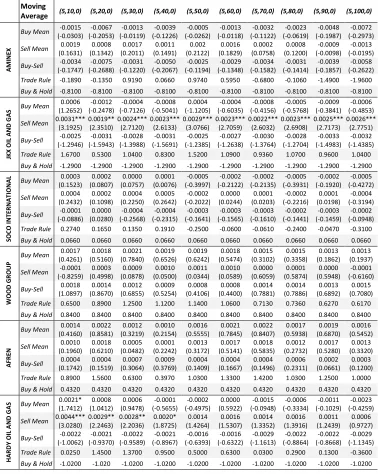
We specifically employed ten combinations of short moving average, long
moving average, and zero bandwidth or threshold ranging from (5,10,0) to
(5,100,0) as fixed moving averages (FMA) on the FTSE indices and oil and gas stock
series for three years from January 2014 to December 2016.
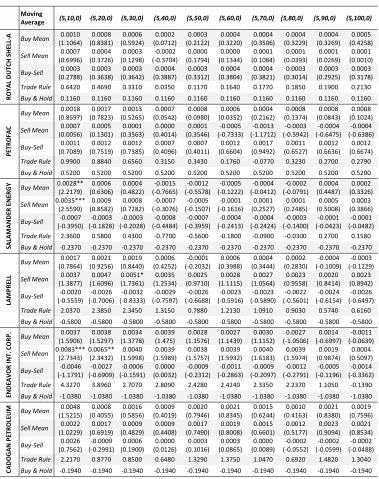
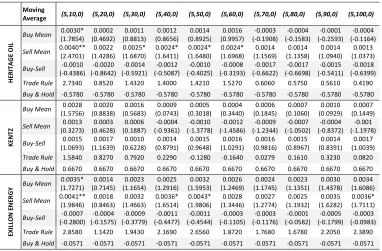
Table 2.
Moving Averages Trading Rules on Daily Returns Series from 2014 to 2016
Moving
Average
(5,10,0) (5,20,0) (5,30,0) (5,40,0) (5,50,0) (5,60,0) (5,70,0) (5,80,0) (5,90,0) (5,100,0)FT
SE
A
ll S
ha
re
In
de
x Buy Mean (0.7263) 0.0006 (0.2496) 0.0003 (0.1297) 0.0002 (0.2287) 0.0003 (0.0920) 0.0002 (0.2512) 0.0003 (0.0976) 0.0002 (0.1509) 0.0001 (0.0849) 0.0001 (0.0077) 0.0001
Sell Mean (0.4545) 0.0005 (0.2181) 0.0000 (-0.2807) -0.0001 (0.8424) 0.0008 (0.1467) 0.0001 (0.0784) 0.0002 -0.0001 (-0.305) (-0.6615) -0.0004 (-0.5858) -0.0004 (-0.4322) -0.0002
Buy-Sell (0.1983) 0.0002 (0.3992) 0.0003 (0.3585) 0.0003 (-0.5768) -0.0005 (0.2044) 0.0002 (0.1224) 0.0001 (0.3531) 0.0003 (0.4847) 0.0004 (0.4816) 0.0004 (0.3934) 0.0004 Trade Rule 0.4230 0.1290 0.0840 0.1720 0.0970 0.1870 0.0670 -0.0740 -0.0330 0.1430 Buy & Hold 0.1140 0.1140 0.1140 0.1140 0.1140 0.1140 0.1140 0.1140 0.1140 0.1140
FT
SE
1
00
S
ha
re
In
de
x Buy Mean (0.7341) 0.0006 (0.1054) 0.0002 (0.1526) 0.0002 (0.1488) 0.0002 (0.1527) 0.0002 (0.1276) 0.0002 (0.1508) 0.0002 (0.0465) 0.0001 (0.0583) 0.0001 (0.0209) 0.0001
Sell Mean (0.5383) 0.0005 (-0.3007) -0.0001 (-0.2404) -0.0001 (0.0013) 0.0001 (0.0454) 0.0001 (0.1313) 0.0000 (0.1224) 0 .0000 (-0.3856) -0.0002 (-0.5978) -0.0004 (-0.3993) -0.0002
Buy-Sell (0.1379) 0.0001 (0.3557) 0.0003 (0.3400) 0.0003 (0.1185) 0.0001 (0.0784) 0.0001 (0.2180) 0.0002 (0.2273) 0.0002 (0.3133) 0.0003 (0.5070) 0.0005 (0.3509) 0.0003 Trade Rule 0.4250 0.0380 0.0910 0.1170 0.1290 0.1050 0.0930 -0.0190 -0.0550 -0.0100 Buy & Hold 0.0860 0.0860 0.0860 0.0860 0.0860 0.0860 0.0860 0.0860 0.0860 0.0860
FT
SE
O
il a
nd
G
as
In
de
x Buy Mean 0.0009
(1.2045) (0.8866) 0.0006 (0.6501) 0.0004 (0.1293) 0.0000 (-0.2395) 0.0001 (0.4247) 0.0003 (0.5780) 0.0004 (0.7474) 0.0005 (0.7045) 0.0005 (0.6148) 0.0004 Sell Mean (1.5380) 0.0012 (1.0893) 0.0009 (0.9122) 0.0007 (0.3525) 0.0002 (0.5430) 0.0004 (0.7506) 0.0006 (0.7868) 0.0006 (0.9550) 0.0007 (0.5534) 0.0005 (0.4680) 0.0004
Buy-Sell -0.0003 (-0.318) (-0.2286) -0.0002 (-0.2786) -0.0003 (-0.2107) -0.0002 (-0.278) -0.0003 (-0.3069) -0.0003 (-0.2096) -0.0002 (-0.2036) -0.0002 (0.0300) 0.0000 (0.0465) 0.0001
Trade Rule 0.7980 0.5500 0.4130 0.0830 0.1690 0.2840 0.3410 0.4420 0.2950 0.2460 Buy & Hold -0.0611 -0.0611 -0.0611 -0.0611 -0.0611 -0.0611 -0.0611 -0.0611 -0.0611 -0.0611
FT
SE
O
il&
Ga
s P
ro
du
cer
s Buy Mean 0.0009
(-1.1985) (-0.9810) 0.0007 (-0.6962) 0.0005 (0.1206) 0.0000 (0.3947) 0.0002 (0.4385) 0.0003 (0.6272) 0.0004 (0.7588) 0.0005 (0.7953) 0.0006 (0.6872) 0.0005 Sell Mean (1.5820) 0.0012 (1.2399) 0.0010 (0.9936) 0.0008 (0.4027) 0.0003 (0.7464) 0.0006 (0.7963) 0.0006 (0.8733) 0.0007 (0.9948) 0.0008 (0.6404) 0.0005 (0.5606) 0.0005
Buy-Sell (-0.3657) -0.0003 (-0.2888) -0.0003 (-0.3079) -0.0003 (-0.2622) -0.0003 (-0.3246) -0.0003 (-0.3324) -0.0003 (-0.2419) -0.0002 (-0.2272) -0.0002 (0.0264) 0.0000 (0.0192) 0.0000
Page | 57
Table 2.
(continues)
Moving
Average
(5,10,0) (5,20,0) (5,30,0) (5,40,0) (5,50,0) (5,60,0) (5,70,0) (5,80,0) (5,90,0) (5,100,0)FT
SE
A
IM
SS
O
il &
G
as Buy Mean (1.5868) 0.0016 (1.0293) 0.0011 (1.1428) 0.0012 (0.8890) 0.0009 (1.4212) 0.0015 (1.5332) 0.0017 (1.3860) 0.0015 (1.0923) 0.0012 (0.8860) 0.0010 (1.4598) 0.0016
Sell Mean 0.0019* (1.8613) (1.1613) 0.0012 (1.219) 0.0012 (1.0036) 0.0010 (1.5284) 0.0016 (1.4391) 0.0015 (1.2687) 0.0013 (1.0237) 0.0010 (1.0231) 0.0010 (1.4215) 0.0014
Buy-Sell (-0.2409) -0.0003 (-0.1066) -0.0001 (0.0363) 0.0000 (-0.0846) -0.0001 (-0.0538) -0.0001 (0.1670) 0.0002 (0.1976) 0.0003 (0.1346) 0.0002 (-0.0497) -0.0001 (0.1478) 0.0002 Trade Rule 1.3500 0.8350 0.8940 0.7090 1.1100 1.0800 0.9660 0.7650 0.6910 1.0400 Buy & Hold -0.0280 -0.0280 -0.0280 -0.0280 -0.0280 -0.0280 -0.0280 -0.0280 -0.0280 -0.0280
AM
EC
Buy Mean (0.5988) 0.0009 (0.3865) 0.0007 (0.4080) 0.0007 (0.5760) 0.0009 (0.7979) 0.0012 (0.3961) 0.0007 (0.8157) 0.0012 (0.6107) 0.0010 (0.5285) 0.0009 (0.4070) 0.0007
Sell Mean (0.0996) 0.0004 (0.1077) 0.0002 (0.0417) 0.0003 (0.0931) 0.0004 (0.3965) 0.0008 (0.0169) 0.0003 (0.5867) 0.0010 (0.2377) 0.0006 (0.0120) 0.0003 (0.1472) 0.0001
Buy-Sell (0.3950) 0.0005 (0.4119) 0.0005 (0.3651) 0.0005 (0.3794) 0.0005 (0.2771) 0.0004 (0.3244) 0.0004 (0.1029) 0.0001 (0.2694) 0.0004 (0.4274) 0.0006 (0.4498) 0.0006
Trade Rule 0.5400 0.3700 0.4000 0.5200 0.7300 0.4000 0.7800 0.5600 0.4300 0.3400 Buy & Hold 0.2400 0.2400 0.2400 0.2400 0.2400 0.2400 0.2400 0.2400 0.2400 0.2400
BG GR
O
U
P
Buy Mean (0.4418) 0.0004 (0.1379) 0.0000 (0.1760) 0.0001 (0.3674) 0.0003 (0.2843) 0.0002 (0.1221) 0.0000 (0.3902) 0.0003 (0.5061) 0.0005 (0.5033) 0.0005 (0.7074) 0.0007
Sell Mean (0.7527) 0.0008 (0.4603) 0.0004 (0.5437) 0.0005 (0.7285) 0.0008 (0.6276) 0.0006 (0.4516) 0.0004 (0.7445) 0.0008 (0.7893) 0.0009 (0.7810) 0.0009 (0.9357) 0.0011
Buy-Sell (-0.2867) -0.0004 (-0.2934) -0.0004 (-0.3286) -0.0005 (-0.3282) -0.0005 (-0.3124) -0.0004 (-0.2957) -0.0004 (-0.3128) -0.0004 (-0.2676) -0.0004 (-0.2588) -0.0004 (-0.2351) -0.0004
Trade Rule 0.4250 0.1570 0.2130 0.3760 0.2910 0.1450 0.3880 0.4350 0.4310 0.5520 Buy & Hold -0.1020 -0.1020 -0.1020 -0.1020 -0.1020 -0.1020 -0.1020 -0.1020 -0.1020 -0.1020
BP
Buy Mean (0.9566) 0.0007 (0.9090) 0.0006 (0.9130) 0.0006 (0.4961) 0.0001 (0.8243) 0.0005 (0.8668) 0.0005 (0.8569) 0.0005 (0.7674) 0.0004 (0.6455) 0.0003 (0.4668) 0.0001
Sell Mean 0.0014* (1.7170) (1.6688) 0.0015* 0.0017* (1.7988) (1.3577) 0.0011 (1.8063) 0.0017* 0.0016* (1.6956) 0.0015* (1.6512) (1.5503) 0.0013 (0.5895) 0.0003 (0.3141) 0.0000
Buy-Sell (-0.5351) -0.0007 (-0.6821) -0.0009 (-0.8214) -0.0011 (-0.7666) -0.0010 (-0.8571) -0.0012 (-0.7379) -0.0010 (-0.6806) -0.0009 (-0.6608) -0.0009 (0.0067) 0.0000 (0.1020) 0.0002 Trade Rule 0.8430 0.7500 0.791 0.438 0.746 0.716 0.702 0.628 0.188 0.024 Buy & Hold -0.3440 -0.3440 -0.3440 -0.3440 -0.3440 -0.3440 -0.3440 -0.3440 -0.3440 -0.3440
CA
IR
N
EN
ER
GY
Buy Mean (-0.2216) -0.0002 (-0.1654) -0.0002 (0.6439) 0.0004 (0.3163) 0.0000 (-0.1530) -0.0007 (-0.2174) -0.0001 (-0.1827) -0.0007 (-0.0445) -0.0004 (-0.2168) -0.0008 (-0.4465) -0.0012
Sell Mean (1.0491) 0.0009 (0.9002) 0.0007 (1.3587) 0.0013 (1.0994) 0.0009 (0.9749) 0.0008 (1.2237) 0.0011 (0.9099) 0.0007 (1.0608) 0.0009 (1.2219) 0.0012 (1.0363) 0.0009
Buy-Sell (-0.6977) -0.0011 (-0.6212) -0.0010 (-0.5357) -0.0008 (-0.5873) -0.0009 (-0.8723) -0.0015 (-0.7317) -0.0012 (-0.8775) -0.0014 (-0.8188) -0.0013 (-1.1083) -0.0020 (-1.1689) -0.0021
Trade Rule 0.3080 0.2000 0.6860 0.4110 0.1720 0.4440 0.0950 0.2450 0.2550 0.0870 Buy & Hold -0.3520 -0.3520 -0.3520 -0.3520 -0.3520 -0.3520 -0.3520 -0.3520 -0.3520 -0.3520
DR
AG
ON OI
L
Buy Mean (0.6020) 0.0012 (0.1065) 0.0006 (0.3220) 0.0009 (0.0716) 0.0006 (0.2842) 0.0008 (0.1522) 0.0007 (0.0730) 0.0004 (0.2866) 0.0001 (0.1954) 0.0002 (0.018) 0.0005
Sell Mean (0.2806) 0.0008 (0.3322) 0.0000 (0.0778) 0.0006 (0.2086) 0.0002 (0.0075) 0.0004 (0.3003) 0.0000 (-0.5552) -0.0003 (-0.7757) -0.0006 (-0.6652) -0.0004 (-0.4435) -0.0002
Page | 58
Table 2.
(continues)
Moving
Average
(5,10,0) (5,20,0) (5,30,0) (5,40,0) (5,50,0) (5,60,0) (5,70,0) (5,80,0) (5,90,0) (5,100,0)FOR
TU
NE
OI
L
Buy Mean (0.0585) 0.0001 (0.6320) 0.0025 (0.3433) 0.0015 (0.4924) 0.0022 (0.2866) 0.0013 (0.2315) 0.0011 (0.1716) 0.0009 (0.1936) 0.0010 (0.3950) 0.0017 (0.3855) 0.0016
Sell Mean (-0.3934) -0.0012 (0.3786) 0.0015 (0.0383) 0.0002 (0.0200) 0.0003 (0.0493) 0.0001 (0.0688) 0.0001 -0.0002 (-0.147) (-0.1626) -0.0002 (0.0482) 0.0004 (0.0515) 0.0005
Buy-Sell (0.3292) 0.0013 (0.2388) 0.0009 (0.3417) 0.0014 (0.4440) 0.0018 (0.2943) 0.0012 (0.2572) 0.0010 (0.2720) 0.0011 (0.3007) 0.0012 (0.2994) 0.0012 (0.2849) 0.0012 Trade Rule -0.2380 1.3800 0.5000 0.6850 0.4590 0.3980 0.2080 0.1620 0.6650 0.6650 Buy & Hold 0.2231 0.2231 0.2231 0.2231 0.2231 0.2231 0.2231 0.2231 0.2231 0.2231
HU
N
TI
N
G
Buy Mean (0.5855) 0.0012 (0.9304) 0.0017 (0.8573) 0.0015 (0.6755) 0.0013 (0.5825) 0.0012 (0.4546) 0.0010 (0.2948) 0.0008 (0.4153) 0.0010 (0.1579) 0.0006 (0.3499) 0.0009
Sell Mean (0.0723) 0.0003 (0.4095) 0.0010 (0.3698) 0.0009 (0.3519) 0.0009 (0.2251) 0.0007 (0.0534) 0.0005 (0.1490) 0.0002 (0.0052) 0.0004 (-0.6158) -0.0006 (-0.3510) -0.0002
Buy-Sell (0.5616) 0.0009 (0.4300) 0.0007 (0.3768) 0.0006 (0.2331) 0.0004 (0.2601) 0.0004 (0.3116) 0.0005 (0.3679) 0.0006 (0.3249) 0.0006 (0.6756) 0.0012 (0.5815) 0.0011
Trade Rule 0.5770 1.0000 0.9560 0.8110 0.7040 0.5550 0.3710 0.5070 0.0940 0.2920 Buy & Hold 0.3060 0.3060 0.3060 0.3060 0.3060 0.3060 0.3060 0.3060 0.3060 0.3060
PR
EM
IE
R O
IL
Buy Mean (1.4561) 0.0020 (1.2679) 0.0018 (0.6977) 0.0011 (0.7759) 0.0012 (1.0162) 0.0016 (0.9774) 0.0015 (0.7980) 0.0013 (0.7639) 0.0012 (0.6574) 0.0011 (0.5777) 0.0010
Sell Mean (1.3805) 0.0020 (0.7930) 0.0012 (0.3395) 0.0007 (0.5909) 0.0010 (0.6539) 0.0011 (0.6710) 0.0011 (0.4440) 0.0008 (0.5740) 0.0010 (0.4391) 0.0008 (0.2328) 0.0006
Buy-Sell (0.0320) 0.0000 (0.4019) 0.0006 (0.2898) 0.0004 (0.0985) 0.0001 (0.3148) 0.0005 (0.2490) 0.0004 (0.2776) 0.0004 (0.1207) 0.0002 (0.1559) 0.0002 (0.2776) 0.0004 Trade Rule 1.5400 1.1500 0.6800 0.8300 0.9100 0.9050 0.7290 0.7690 0.6630 0.5320 Buy & Hold 0.1970 0.1970 0.1970 0.1970 0.1970 0.1970 0.1970 0.1970 0.1970 0.1970
RO
YA
L DU
TC
H S
HE
LL
-B Buy Mean (0.9722) 0.0010 (0.7713) 0.0008 (0.2848) 0.0005 (0.2835) 0.0005 (0.0511) 0.0003 (0.3406) 0.0005 (0.3417) 0.0005 (0.3051) 0.0005 (0.1194) 0.0003 (0.2688) 0.0005
Sell Mean (0.2891) 0.0005 (0.1108) 0.0003 (-0.4314) -0.0001 (-0.3286) -0.0001 (-0.5670) -0.0003 (-0.3260) -0.0001 (0.2420) 0.0000 (0.2538) 0.0000 (-0.4785) -0.0002 (-0.4590) -0.0002
Buy-Sell (0.5525) 0.0005 (0.5384) 0.0005 (0.6188) 0.0006 (0.5252) 0.0005 (0.5373) 0.0005 (0.5649) 0.0006 (0.4937) 0.0005 (0.4737) 0.0005 (0.5140) 0.0005 (0.6126) 0.0007 Trade Rule 0.5770 0.4610 0.1480 0.1730 0.0190 0.1760 0.1970 0.1690 0.0640 0.1170 Buy & Hold 0.1830 0.1830 0.1830 0.1830 0.1830 0.1830 0.1830 0.1830 0.1830 0.1830
TU
LLO
W O
IL
Buy Mean (0.6719) 0.0009 (0.4303) 0.0005 (0.4436) 0.0005 (0.2870) 0.0003 (0.1931) 0.0002 (0.4180) 0.0005 (0.1598) 0.0002 (-0.1125) -0.0002 (0.0072) 0.0000 (-0.1888) -0.0003
Sell Mean (0.8539) 0.0011 (0.3627) 0.0005 (0.4522) 0.0006 (0.3242) 0.0004 (0.1284) 0.0001 (0.3599) 0.0005 (0.1052) 0.0001 (0.0097) 0.0000 (-0.1703) -0.0003 (-0.3025) -0.0005
Buy-Sell (-0.1687) -0.0003 (0.0425) 0.0001 (-0.0353) -0.0001 (-0.0478) -0.0001 (0.0535) 0.0001 (0.0498) 0.0001 (0.0443) 0.0001 (-0.1026) -0.0002 (0.1569) 0.0003 (0.1240) 0.0002 Trade Rule 0.7610 0.3740 0.4220 0.2760 0.1270 0.3500 0.0990 -0.1790 -0.0930 -0.2460 Buy & Hold -0.0340 -0.0340 -0.0340 -0.0340 -0.0340 -0.0340 -0.0340 -0.0340 -0.0340 -0.0340
AM
IN
EX
Buy Mean (-0.0303) -0.0015 (-0.2053) -0.0067 (-0.0119) -0.0013 (-0.1226) -0.0039 (-0.0262) -0.0005 (-0.0118) -0.0013 (-0.1122) -0.0032 (-0.0619) -0.0023 (-0.1987) -0.0048 (-0.2973) -0.0072
Sell Mean (0.1631) 0.0019 (0.1342) 0.0008 (0.2011) 0.0017 (0.1491) 0.0011 (0.2122) 0.002 (0.1829) 0.0016 (0.0758) 0.0002 (0.1200) 0.0008 (-0.0098) -0.0009 (-0.0195) -0.0013
Buy-Sell (-0.1747) -0.0034 (-0.2688) -0.0075 (-0.1220) -0.0031 (-0.2067) -0.0050 (-0.1194) -0.0025 (-0.1348) -0.0029 (-0.1582) -0.0034 (-0.1414) -0.0031 (-0.1857) -0.0039 (-0.2622) -0.0058
Page | 59
Table 2.
(continues)
Moving
Average
(5,10,0) (5,20,0) (5,30,0) (5,40,0) (5,50,0) (5,60,0) (5,70,0) (5,80,0) (5,90,0) (5,100,0)AM
IN
EX
Buy Mean (-0.0303) -0.0015 (-0.2053) -0.0067 (-0.0119) -0.0013 (-0.1226) -0.0039 (-0.0262) -0.0005 (-0.0118) -0.0013 (-0.1122) -0.0032 (-0.0619) -0.0023 (-0.1987) -0.0048 (-0.2973) -0.0072
Sell Mean (0.1631) 0.0019 (0.1342) 0.0008 (0.2011) 0.0017 (0.1491) 0.0011 (0.2122) 0.002 (0.1829) 0.0016 (0.0758) 0.0002 (0.1200) 0.0008 (-0.0098) -0.0009 (-0.0195) -0.0013
Buy-Sell (-0.1747) -0.0034 (-0.2688) -0.0075 (-0.1220) -0.0031 (-0.2067) -0.0050 (-0.1194) -0.0025 (-0.1348) -0.0029 (-0.1582) -0.0034 (-0.1414) -0.0031 (-0.1857) -0.0039 (-0.2622) -0.0058 Trade Rule -0.1890 -0.1350 0.9190 0.0660 0.9740 0.5950 -0.6800 -0.1060 -1.4900 -1.9600 Buy & Hold -0.8100 -0.8100 -0.8100 -0.8100 -0.8100 -0.8100 -0.8100 -0.8100 -0.8100 -0.8100
JK
X O
IL
AN
D G
AS
Buy Mean (1.2652) 0.0006 (-0.2478) -0.0012 (-0.7126) -0.0004 (-0.5041) -0.0008 (-1.1205) 0.0004 (-0.6035) -0.0004 (-0.4156) -0.0008 (-0.5768) -0.0005 (-0.3841) -0.0009 (-0.4853) -0.0006
Sell Mean 0.0031*** (3.1925) 0.0019** (2.3510) 0.0024*** (2.7120) 0.0023*** (2.6133) 0.0029*** (3.0766) 0.0023*** (2.7059) 0.0022*** (2.6032) 0.0023*** (2.6908) 0.0025*** (2.7173) 0.0026*** (2.7751)
Buy-Sell (-1.2946) -0.0025 (-1.5943) -0.0031 (-1.3988) -0.0028 (-1.5691) -0.0031 (-1.2385) -0.0025 (-1.2638) -0.0027 (-1.3764) -0.0030 (-1.2704) -0.0028 (-1.4983) -0.0033 (-1.4385) -0.0032
Trade Rule 1.6700 0.5300 1.0400 0.8300 1.5200 1.0900 0.9360 1.0700 0.9600 1.0400 Buy & Hold -1.2900 -1.2900 -1.2900 -1.2900 -1.2900 -1.2900 -1.2900 -1.2900 -1.2900 -1.2900
SO
CO
IN
TE
RN
AT
IO
N
AL Buy Mean (0.1523) 0.0003 (0.0807) 0.0002 (0.0757) 0.0000 (0.0076) 0.0001 (-0.3997) -0.0005 (-0.2122) -0.0002 (-0.2135) -0.0002 (-0.3931) -0.0005 (-0.1920) -0.0002 (-0.4272) -0.0005
Sell Mean (0.2432) 0.0004 (0.1098) 0.0002 (0.2250) 0.0004 (0.2642) 0.0005 (-0.2022) -0.0002 (0.0244) 0.0000 (0.0203) 0.0001 (-0.2216) -0.0002 (0.0198) 0.0001 (-0.3194) -0.0004
Buy-Sell (-0.0886) -0.0001 (0.0280) 0.0000 (-0.2568) -0.0004 (-0.2315) -0.0004 (-0.1641) -0.0003 (-0.1565) -0.0003 (-0.1610) -0.0003 (-0.1441) -0.0002 (-0.1459) -0.0003 (-0.0948) -0.0002 Trade Rule 0.2740 0.1650 0.1350 0.1910 -0.2500 -0.0600 -0.0610 -0.2400 -0.0470 -0.3100 Buy & Hold 0.0660 0.0660 0.0660 0.0660 0.0660 0.0660 0.0660 0.0660 0.0660 0.0660
W
OOD
G
ROU
P Buy Mean
0.0017
(0.4261) (0.5160) 0.0018 (0.7840) 0.0021 (0.6526) 0.0019 (0.6242) 0.0019 (0.5474) 0.0018 (0.3102) 0.0015 (0.3358) 0.0015 (0.1862) 0.0013 (0.1937) 0.0013 Sell Mean (-0.8259) -0.0001 (0.4998) 0.0003 (0.0878) 0.0009 (0.0500) 0.0010 (0.0344) 0.0011 (0.0589) 0.0010 (0.6059) 0.0000 (0.5874) 0.0001 (0.5948) 0.0000 (-0.6160) -0.0001
Buy-Sell (1.0897) 0.0018 (0.8670) 0.0014 (0.6855) 0.0012 (0.5254) 0.0009 (0.4106) 0.0008 (0.4400) 0.0008 (0.7881) 0.0014 (0.7886) 0.0014 (0.6892) 0.0013 (0.7080) 0.0015 Trade Rule 0.6500 0.8900 1.2500 1.1200 1.1400 1.0600 0.7130 0.7360 0.6270 0.6170 Buy & Hold 0.8400 0.8400 0.8400 0.8400 0.8400 0.8400 0.8400 0.8400 0.8400 0.8400
AF
REN
Buy Mean (0.4160) 0.0014 (0.8581) 0.0022 (0.3219) 0.0012 (0.2154) 0.0010 (0.5555) 0.0016 (0.7845) 0.0021 (0.8407) 0.0022 (0.5938) 0.0017 (0.6870) 0.0019 (0.5452) 0.0016
Sell Mean (0.1960) 0.0010 (0.6210) 0.0018 (0.0482) 0.0005 (0.2242) 0.0001 (0.3172) 0.0013 (0.5141) 0.0017 (0.5835) 0.0018 (0.2732) 0.0012 (0.5280) 0.0017 (0.3320) 0.0013
Buy-Sell (0.1742) 0.0004 (0.1519) 0.0004 (0.3064) 0.0007 (0.3769) 0.0009 (0.1409) 0.0004 (0.1667) 0.0004 (0.1496) 0.0004 (0.2311) 0.0006 (0.0661) 0.0002 (0.1200) 0.0003 Trade Rule 0.8900 1.5600 0.6300 0.3970 1.0300 1.3300 1.4200 1.0300 1.2500 1.0000 Buy & Hold 0.4320 0.4320 0.4320 0.4320 0.4320 0.4320 0.4320 0.4320 0.4320 0.4320
HA
RDY
O
IL A
N
D G
AS Buy Mean 0.0021* (1.7412) (1.0412) 0.0008 (0.9478) 0.0006 (-0.5655) -0.0001 (-0.4975) -0.0002 (0.5922) 0.0000 (-0.0948) -0.0015 (-0.3334) -0.0006 (-0.1029) -0.0011 (-0.4259) -0.0023 Sell Mean 0.0044*** (3.0280) 0.0029** (2.2463) 0.0028** (2.2036) (1.8725) 0.0020* (1.4264) 0.0014 (1.5307) 0.0016 (1.3352) 0.0014 (1.3916) 0.0016 (1.2439) 0.0011 (0.9727) 0.0006
Buy-Sell (-1.0062) -0.0022 (-0.9370) -0.0021 (-0.9589) -0.0022 (-0.8967) -0.0021 (-0.6393) -0.0016 (-0.6322) -0.0016 (-1.1613) -0.0029 (-0.8864) -0.0022 (-0.8668) -0.0022 (-1.1345) -0.0029
Page | 60
Table 2.
(continues)
Moving
Average (5,10,0) (5,20,0) (5,30,0) (5,40,0) (5,50,0) (5,60,0) (5,70,0) (5,80,0) (5,90,0) (5,100,0)
RO
YA
L DU
TC
H S
HE
LL
-A Buy Mean (1.1064) 0.0010 (0.8381) 0.0008 (0.5924) 0.0006 (0.0712) 0.0002 (0.2122) 0.0003 (0.3220) 0.0004 (0.3506) 0.0004 (0.3229) 0.0004 (0.3269) 0.0004 (0.4258) 0.0005
Sell Mean (0.6996) 0.0007 (0.3726) 0.0004 (0.1298) 0.0003 (-0.3704) -0.0002 (0.1794) 0.0000 (0.1344) 0.0000 (0.1084) 0.0001 (0.0393) 0.0001 (0.0269) 0.0001 (0.0010) 0.0001
Buy-Sell (0.2788) 0.0003 (0.3638) 0.0003 (0.3642) 0.0003 (0.3887) 0.0004 (0.3312) 0.0003 (0.3804) 0.0004 (0.3821) 0.0004 (0.3014) 0.0003 (0.2925) 0.0003 (0.3178) 0.0003 Trade Rule 0.6420 0.4690 0.3310 0.0350 0.1170 0.1640 0.1770 0.1850 0.1900 0.2130 Buy & Hold 0.1160 0.1160 0.1160 0.1160 0.1160 0.1160 0.1160 0.1160 0.1160 0.1160
PET
RO
FA
C
Buy Mean (0.8597) 0.0018 (0.7823) 0.0017 (0.5265) 0.0013 (0.0542) 0.0007 (0.0980) 0.0008 (0.0352) 0.0006 (0.2162) 0.0004 (0.1374) 0.0008 (0.0843) 0.0008 (0.1024) 0.0008
Sell Mean (0.0056) 0.0007 (0.1301) 0.0005 (0.3563) 0.0001 (0.4014) 0.0000 (0.3546) 0.0001 (-0.7333) -0.0005 (-1.1712) -0.0013 (-0.5942) -0.0003 (-0.6475) -0.0004 (-0.6386) -0.0004
Buy-Sell (0.7089) 0.0011 (0.7519) 0.0012 (0.7385) 0.0012 (0.4096) 0.0007 (0.4011) 0.0007 (0.6604) 0.0012 (0.9492) 0.0017 (0.6527) 0.0011 (0.6636) 0.0012 (0.6674) 0.0012
Trade Rule 0.9900 0.8840 0.6560 0.3150 0.3430 0.1760 -0.0770 0.3230 0.2700 0.2790 Buy & Hold 0.5200 0.5200 0.5200 0.5200 0.5200 0.5200 0.5200 0.5200 0.5200 0.5200
SA
LA
M
AN
DER
E
N
ER
G
Y Buy Mean 0.0028**
(2.2179) (0.6306) 0.0006 (0.4822) 0.0004 (-0.7665) -0.0015 (-0.5578) -0.0012 (-0.1222) -0.0005 (-0.0412) -0.0004 (-0.0791) -0.0002 (0.4487) 0.0004 (0.3326) 0.0002 Sell Mean 0.0035*** (2.5590) (0.8582) 0.0009 (0.7282) 0.0008 (-0.3076) -0.0007 (-0.1507) -0.0005 (-0.1616) -0.0001 (0.2527) 0.0001 (0.2485) 0.0001 (0.5008) 0.0005 (0.3866) 0.0003
Buy-Sell (-0.3950) -0.0007 (-0.1828) -0.0003 (-0.2028) -0.0003 (-0.4484) -0.0008 (-0.3959) -0.0007 (-0.2413) -0.0004 (-0.2424) -0.0004 (-0.1400) -0.0003 (-0.0423) -0.0001 (-0.0482) -0.0001 Trade Rule 2.3600 0.5800 0.4300 -0.7700 -0.5600 -0.1800 -0.0900 -0.0300 0.2700 0.1580 Buy & Hold -0.2370 -0.2370 -0.2370 -0.2370 -0.2370 -0.2370 -0.2370 -0.2370 -0.2370 -0.2370
LA
M
PR
ELL
Buy Mean (0.7864) 0.0017 (0.9256) 0.0021 (0.8440) 0.0019 (0.4252) 0.0006 (-0.2032) -0.0001 (0.3988) 0.0006 (0.3444) 0.0004 (0.2830) 0.0002 (-0.1009) -0.0004 (-0.1229) -0.0003
Sell Mean (1.3877) 0.0037 (1.6096) 0.0047 (1.7361) 0.0051* (1.2534) 0.0035 (0.9710) 0.0025 (1.1115) 0.0028 (1.0564) 0.0027 (0.9558) 0.0023 (0.8414) 0.0020 (0.8942) 0.0023
Buy-Sell (-0.5559) -0.0020 (-0.7006) -0.0026 (-0.8333) -0.0032 (-0.7597) -0.0029 (-0.6688) -0.0026 (-0.5916) -0.0023 (-0.5890) -0.0023 (-0.5601) -0.0022 (-0.6154) -0.0024 (-0.6497) -0.0026 Trade Rule 2.0370 2.3850 2.3450 1.3150 0.7880 1.2130 1.0910 0.9030 0.5740 0.6160 Buy & Hold -0.5800 -0.5800 -0.5800 -0.5800 -0.5800 -0.5800 -0.5800 -0.5800 -0.5800 -0.5800
EN
DEA
VO
R
IN
T.
C
O
RP
. Buy Mean 0.0037
(1.5906) (1.5297) 0.0038 (1.3778) 0.0034 (1.475) 0.0039 (1.1576) 0.0028 (1.1439) 0.0027 (1.1152) 0.0030 (-1.0506) 0.0027 (-0.6997) 0.0014 (-0.0639) -0.0011 Sell Mean 0.0083*** (2.7343) 0.0065** (2.3432) (1.5998) 0.0040 (1.5989) 0.0039 (1.5757) 0.0038 (1.5932) 0.0039 (1.6183) 0.0040 (1.5974) 0.0039 (0.9874) 0.0019 (0.5097) 0.0004
Buy-Sell (-1.1791) -0.0046 (-0.6909) -0.0027 (-0.1591) -0.0006 (0.0032) 0.0000 (-0.2312) -0.0009 (-0.2863) -0.0011 (-0.2097) -0.0009 (-0.2791) -0.0012 (-0.1196) -0.0005 (-0.3362) -0.0014 Trade Rule 4.3270 3.8960 2.7070 2.8090 2.4280 2.4240 2.3350 2.2370 1.1050 -0.1390 Buy & Hold -1.0380 -1.0380 -1.0380 -1.0380 -1.0380 -1.0380 -1.0380 -1.0380 -1.0380 -1.0380
CA
DO
GA
N
P
ET
RO
LEU
M Buy Mean (1.5215) 0.0048 (0.4055) 0.0008 (0.5856) 0.0016 (0.4019) 0.0009 (0.7946) 0.0020 (0.8345) 0.0021 (0.6244) 0.0015 (0.4163) 0.0010 (0.8380) 0.0021 (0.7596) 0.0019
Sell Mean (1.0229) 0.0022 (0.6919) 0.0017 (0.4829) 0.0009 (0.4408) 0.0009 (0.7490) 0.0017 (0.8008) 0.0019 (0.6601) 0.0015 (0.5177) 0.0012 (0.9094) 0.0023 (0.8534) 0.0021
Buy-Sell (0.7562) 0.0026 (-0.2991) -0.0009 (0.1900) 0.0006 (0.0126) 0.0000 (0.1016) 0.0003 (0.0865) 0.0003 (0.0089) 0.0000 (-0.0552) -0.0002 (-0.0599) -0.0002 (-0.0488) -0.0002
Page | 61
Table 2.
(continues)
Moving
Average (5,10,0) (5,20,0) (5,30,0) (5,40,0) (5,50,0) (5,60,0) (5,70,0) (5,80,0) (5,90,0) (5,100,0)
HE
RIT
AG
E O
IL
Buy Mean 0.0030* (1.7854) (0.4692) 0.0002 (0.8813) 0.0011 (0.8656) 0.0012 (0.8925) 0.0014 (0.9957) 0.0016 (-0.1908) -0.0003 (-0.1583) -0.0004 (-0.2593) -0.0001 (-0.1164) -0.0004
Sell Mean 0.0040** (2.4701) (1.4286) 0.0022 (1.6870) 0.0025* (1.6411) 0.0024* (1.6480) 0.0024* 0.0024* (1.6968) (1.1569) 0.0014 (1.1358) 0.0014 (1.0940) 0.0014 (1.0373) 0.0013
Buy-Sell (-0.4386) -0.0010 (-0.8642) -0.0020 (-0.5921) -0.0014 (-0.5087) -0.0012 (-0.4025) -0.0010 (-0.3193) -0.0008 (-0.6622) -0.0017 (-0.6698) -0.0017 (-0.5411) -0.0015 (-0.6399) -0.0018 Trade Rule 2.7340 0.8520 1.4320 1.4000 1.4210 1.5270 0.6060 0.5750 0.5610 0.4190 Buy & Hold -0.5780 -0.5780 -0.5780 -0.5780 -0.5780 -0.5780 -0.5780 -0.5780 -0.5780 -0.5780
KE
N
TZ
Buy Mean (1.5756) 0.0028 (0.8838) 0.0020 (0.5683) 0.0016 (0.0743) 0.0009 (0.3018) 0.0005 (0.3440) 0.0004 (0.1845) 0.0006 (0.1060) 0.0007 (0.0929) 0.0010 (0.1449) 0.0007
Sell Mean (0.3273) 0.0013 (0.4628) 0.0003 (0.1887) 0.0006 (-0.9361) -0.0004 (-1.3778) -0.0010 (-1.4586) -0.0012 (-1.2344) -0.0009 (-1.0502) -0.0007 (-0.8372) -0.0004 (-1.1978) -0.001
Buy-Sell (1.0693) 0.0015 (1.1639) 0.0017 (0.6228) 0.0010 (0.8791) 0.0014 (0.9648) 0.0015 (1.0291) 0.0016 (0.9816) 0.0016 (0.8967) 0.0015 (0.8391) 0.0014 (1.0039) 0.0017
Trade Rule 1.5840 0.8270 0.7920 0.2290 -0.1280 -0.1640 0.0279 0.1610 0.3230 0.0820 Buy & Hold 0.6670 0.6670 0.6670 0.6670 0.6670 0.6670 0.6670 0.6670 0.6670 0.6670
EX
IL
LO
N
EN
ER
GY
Buy Mean 0.0035* (1.7271) (0.7145) 0.0014 (1.1654) 0.0023 (1.2916) 0.0025 (1.5953) 0.0032 (1.2469) 0.0026 (1.1745) 0.0024 (1.1351) 0.0023 (1.4378) 0.0030 (1.6086) 0.0034
Sell Mean 0.0041** (1.9846) (0.8463) 0.0018 (1.4663) 0.0032 (1.6514) 0.0036* (1.9806) 0.0043* (1.3446) 0.0028 (1.2774) 0.0027 (1.1932) 0.0025 (1.6282) 0.0035 0.0036* (1.7111)
Buy-Sell (-0.2800) -0.0007 (-0.1575) -0.0004 (-0.3779) -0.0009 (-0.4477) -0.0011 (-0.4544) -0.0011 (-0.1105) -0.0003 (-0.1176) -0.0003 (-0.0582) -0.0001 (-0.1799) -0.0005 (-0.0983) -0.0003 Trade Rule 2.8580 1.1420 1.9430 2.1690 2.6560 1.8720 1.7680 1.6780 2.2050 2.3890 Buy & Hold -0.0571 -0.0571 -0.0571 -0.0571 -0.0571 -0.0571 -0.0571 -0.0571 -0.0571 -0.0571
Notes:
The table show returns of combinations of short- and long-moving averages and
zero bandwith (5,10,0 ... 5,100,0). The Buy and Sell Mean returns are daily averages of the
total return generated from the buy and sell transactions, while the values in parenthesis
under them are t-statistics to be used in rejecting or accepting the null hypothesis of
equality at *: 10%, **: 5%, and ***: 1% significance levels. The Buy-Sell represents
difference between Buy and Sell mean returns. The “Trading Rule” and “Buy and Hold” are
total trading returns from each rule (moving average) and corresponding buy and hold
investment strategy returns over the same period. Number of days in a buy decision
ranges between 98 and 521 with average of 362 days. Likewise, number of days in a sell
decision ranges between 156 and 664 with average of 342 days.
Page | 62
In the case of BP, JKX Oil and Gas, Hardy Oil and Gas, Heritage Oil and Exillon
Energy, the null hypothesis is rejected. However, it cannot be concluded that the
trading rules are influential since the buy mean returns are not significantly
different from the buy and hold returns.
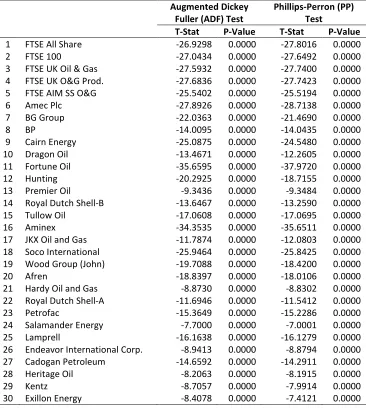
The reliability of the trading rule results presented in Table 2 has been tested
by a stationarity test conducted on the moving average (10) trading rule return
series (as a sample) to assess whether the series is stationary. If the series is
non-stationary, then the ‘buy’ and ‘sell’ mean returns used as a yardstick for assessing
the performance of a trading rule strategy would not be realistic since the series is
generated from a stochastic process. On the contrary, if the series is found to be
stationary by rejecting the null hypothesis of a unit root, then the trading rule buy
or sell mean returns can be assumed to be constant over which it can be
compared with the unconditional mean return of the buy and hold investment
strategy. Results of the stationarity test are presented in Table 3.
Page | 63
Table 3.
Stationarity Test for Moving Average (10) Trading Rule Return Series
Augmented Dickey
Fuller (ADF) Test
Phillips-Perron (PP)
Test
T-Stat
P-Value
T-Stat
P-Value
1 FTSE All Share
-26.9298
0.0000
-27.8016
0.0000
2 FTSE 100
-27.0434
0.0000
-27.6492
0.0000
3 FTSE UK Oil & Gas
-27.5932
0.0000
-27.7400
0.0000
4 FTSE UK O&G Prod.
-27.6836
0.0000
-27.7423
0.0000
5 FTSE AIM SS O&G
-25.5402
0.0000
-25.5194
0.0000
6 Amec Plc
-27.8926
0.0000
-28.7138
0.0000
7 BG Group
-22.0363
0.0000
-21.4690
0.0000
8 BP
-14.0095
0.0000
-14.0435
0.0000
9 Cairn Energy
-25.0875
0.0000
-24.5480
0.0000
10 Dragon Oil
-13.4671
0.0000
-12.2605
0.0000
11 Fortune Oil
-35.6595
0.0000
-37.9720
0.0000
12 Hunting
-20.2925
0.0000
-18.7155
0.0000
13 Premier Oil
-9.3436
0.0000
-9.3484
0.0000
14 Royal Dutch Shell-B
-13.6467
0.0000
-13.2590
0.0000
15 Tullow Oil
-17.0608
0.0000
-17.0695
0.0000
16 Aminex
-34.3535
0.0000
-35.6511
0.0000
17 JKX Oil and Gas
-11.7874
0.0000
-12.0803
0.0000
18 Soco International
-25.9464
0.0000
-25.8425
0.0000
19 Wood Group (John)
-19.7088
0.0000
-18.4200
0.0000
20 Afren
-18.8397
0.0000
-18.0106
0.0000
21 Hardy Oil and Gas
-8.8730
0.0000
-8.8302
0.0000
22 Royal Dutch Shell-A
-11.6946
0.0000
-11.5412
0.0000
23 Petrofac
-15.3649
0.0000
-15.2286
0.0000
24 Salamander Energy
-7.7000
0.0000
-7.0001
0.0000
25 Lamprell
-16.1638
0.0000
-16.1279
0.0000
26 Endeavor International Corp.
-8.9413
0.0000
-8.8794
0.0000
27 Cadogan Petroleum
-14.6592
0.0000
-14.2911
0.0000
28 Heritage Oil
-8.2063
0.0000
-8.1915
0.0000
29 Kentz
-8.7057
0.0000
-7.9914
0.0000
30 Exillon Energy
-8.4078
0.0000
-7.4121
0.0000
Page | 64
Figure 1.
Performances of Moving Averages Trading Rules Returns against the
Return from Simple Buy and Hold Investment Strategy
10 9 8 7 6 5 4 3 2 1 0.4 0.3 0.2 0.1 0.0 -0.1
MA Length (Tens)
To ta l R et ur ns ( x1 00 = % ) Trading Rule Buy & Hold Variable
FTSE All Share Index
10 9 8 7 6 5 4 3 2 1 0.4 0.3 0.2 0.1 0.0
MA Length (Tens)
To ta l R et ur ns ( x1 00 = % ) Trading Rule Buy and Hold Variable
FTSE 100 Share Index
10 9 8 7 6 5 4 3 2 1 0.8 0.6