Available online: http://edupediapublications.org/journals/index.php/IJR/ P a g e | 55
A Novel approach to detect node failure for disconnected
network for WSN
Priyanka Patil & gouri Patil
1,2 Guru Nanak Dev Engineering College, Mailoor Road, Bidar, Karnataka
Email :- [email protected] & Email: [email protected]
Abstract
In MANETs the communication is a very primary thing to exchange messages and information. Due to some environment and radiation constrains, the node tends to get failure, which leads to disruption and network disconnected scenarios and also due to the battery drain the nodes also get failure. Detection of faulty node is very important and it is a challenging issue because of node mobility and changing topology. Many researchs have been done for the static network. In proposed system, a probabilistic approach for node failure scheme is implemented, this scheme combines the nodes location and location monitoring of nodes, which helps two nodes to collaborate and transmit data to achieve efficient data transmission, this scheme helps to detect the faulty nodes in both connected and disconnected topology. The simulation of the proposed system is carried on network simulator NS2 tool and the performance metrics in terms of throughput, delay and communication over head are evaluated
INTRODUCTION Wireless sensor networks
It includes heaps and heaps of low value points which can either have a fixed position or randomly communicating nodes to monitor the surroundings. Deploying big quantity small nodes are included in the WSNs which are trend from past few years.
The nodes then experience environmental modifications and document these different nodes over the network design. In the huge environmental sensor nodes are great for deploying.
This lets in random deployment in inaccessible terrains or disaster comfort operations. WSNs may be organized in an expansion of different approaches, and a solution designed for a flat network will not likely is highest quality for a clustered network. To be powerful and efficient, an answer needs to be tailor-made to the unique network agency to hand.
Due to their confined energy and quick range, sensor nodes want to collaboratively work in multi-hop wireless communication architectures to permit the transmission in their sensed and amassed statistics to the closest base station. Moreover, the aid-starved nature of sensor nodes makes the safety issue very critical; in reality, the deployment of maximum protection offerings in every node will produce a full-size drain at the system resources, and as a consequence reduce the node’s lifetime.
WSN compromises of randomly deployed sensor nodes which monitors various environmental phenomena‟s, considering temperature‟,„sound‟,„vibration‟, pressure‟ etc. at various locations. WSN compromises of n number of mobile nodes which gets randomly deployed and they might have a fixed location to look after the environment. WSNs are the development considering past years and indulge in scattering sensor nodes in the network. Usually sensor within network observes all environment changes & informs other sensors within the network over system architecture. Node deployment takes in hostile environment or even over geographical areas.
Available online: http://edupediapublications.org/journals/index.php/IJR/ P a g e | 56 network since sensor nodes are randomly
deployed the position of sensors are not predetermined. The needs for the
implementation for low-power
consumption, low-cost utilization, multifunctional sensors have made WSN an important data gathering mechanism. These multifunctional sensors in the network underwent a rapid growth as a new information gathering mechanism taking into account various different examples of applications. In many such applications, sensors in the network are randomly positioned & dispersed entirely over the detecting (sensing) area and are unattended once deployment, hence leading to battery replacement.
Four basic components to consider in WSN: (i) an interconnecting wireless network (ii) group of randomly distributed sensor nodes. (iii) Sink node (iv) a group of computing devices at base station which helps in analysing & interpreting the data obtained from other sensor nodes in a network.
Figure 1.1: WSN components
As shown in figure 1.1, sensor nodes are outfitted with „sensing unit‟, a wireless
communication device (or radio
transceiver), a micro controller &source of energy usually a battery. In network while relaying data from one sensor node to another, the sensor which is near to the sink node typically exhaust their energy much faster than other because of further relaying data traffic. Due to the depletion of energy by the sensors it may not guarantee the
connectivity & coverage of network. Limiting to these, it is very tough to build (or design) an energy-efficient data collection scheme which aims in consuming uniform energy throughout the sensing area to accomplish extended lifetime of network. Some applications considers certain time specification for data gathering, hence effective, significant data gathering mechanism must be selected which aims at various network parameters such as high scalabi1ity, 1ong network 1ifetime and 1ow data 1atency.
The Characteristics of Sensor Networks
This section briefs the sensor network characteristics:
The sensor network contains several lots of nodes.
The topology adjustments very regularly because of node disasters.
It contains controlled resources.
It consists of specifically use of broadcast communication concept.
1.1.1 Sensor Node Structure
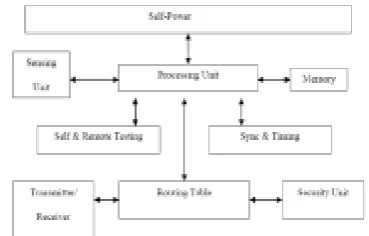
Figure 1.1: Structure of Sensor Node
Figure 1.1 suggests a wireless regular sensor node. The typical block diagram consists of the self-power unit, Sensing unit, Processing unit, memory, self and remote testing unit, sync and time unit, transmitter and receiver, routing tables and also security units. The nodes in the system are spread in the network. On-board far flung self-trying out unit is the alternative.
Available online: http://edupediapublications.org/journals/index.php/IJR/ P a g e | 57 a vicinity locating gadget. The processing
unit consists of the conversation & protection protocol gadgets. For computing first-class direction and protection for the facts being transmitted these two devices are used.
Sensing unit:
Analog to digital converter & a sensor are present in sensing unit. A couple of sensors are present in the clever sensor node. Before feeding the analog signal which is produced by the sensor, are totally converted into the virtual alerts with the help of the converter. On the coronary heart of the node this units segregates statistics externally and do some activity with the relevant processor.
Memory and Processing unit:
Several computations are performed on the processing unit, relying how the programming is made additionally sending all the results to outside the network. The memory unit is commonly related to the processing unit. The input which is arrived at the sensor nodes are processed here. All the processing is done in this stage and can be stored in memory. As we know sensor nodes are very small and all the nodes in the network are engaged, the communication uses the hierarchical arrangement from the cluster nodes.
Self-power unit:
For restricting the area for the battery the sensor nodes are placed in the little space. As the node movement is not stationery it is very difficult to recharge the battery. As the lifetime of the nodes depends on the energy, the power unit in a sensor node is the maximum unusable unit. Therefore to lengthen the existence of the sensor community power-efficient algorithm is must. The transmitter and the receiver unit takes the energy from nodes.
Applications
The monitoring & controlling are done by the packages for Wireless Sensor Network. The user of the Wireless Sensor Network is worldwide. This can be used in many fields and can also provide the standard utility.
Tracking:
Tracking is one of the common place functions where the wireless sensor network is used. If any area or a region is to be tracked then the wireless sensor network is deployed all over. Now consider a battlefield where all the sensor nodes are placed for stumbling on enemy attack to the usage of the landmines. While tracking if anything is detected then the nearer base station first collects data.
Environmental tracking
For the purpose of environmental tracking a range of wireless sensor networks are placed. If there is any hazardous change in the environment then it can be tracked through this.
Detection of vehicles:
To detect the number of cars, bikes present can be located by placing the wireless sensor nodes.
Monitoring flare stack:
In the manufacturing of methane gasoline it is very necessary to monitor the removal, venting & smouldering so wireless sensor networks can be used. T o identify the when the methane is spread to the environment landfill managers should know the
knowledge of methane waft and
temperature. In the methane manufacturing gadget one need to determine the degrees and flow a strain transducer which can hit on both strain and vacuum.
Monitoring water tower level:
This is one of the major problems in big cities, the water has to be filled to bigger tanks and circulated among the entire city in small groups. Tracking of water is important in this area.
Energy Optimization
The main problem with deploying of sensor network is to optimize the consumption of energy. Due to low power and short range of communication, the sensor nodes have to
work in multi-hop communication
Available online: http://edupediapublications.org/journals/index.php/IJR/ P a g e | 58 applications such as environmental
monitoring, intrusion detection etc.
LITERATURE SURVEY
H. M. Rehmani, et al., [1] The performance of the nodes in traditional Wireless Sensor Networks is very low due to limited processing and communication power and uses fixed spectrum assignment policy. In addition, these wireless sensor nodes requirement are application specific and require high bandwidth and their QoS are specific. Wireless sensor nodes with cognitive radio capabilities (i.e., Cognitive Radio Sensor Networks (CRSNs)), can help to address these challenges. However, there are several challenges and research problems which are needed to be addressed in CRSNs. In fact, cognitive radio sensor network evolved from Wireless Sensor Networks (WSNs) in order to optimize the bandwidth and Quality-of-Service (QoS) requirements of wireless sensor nodes. Furthermore, CRSNs improve the spectrum utilization, and multiple overlaid sensor networks can be deployed in a specific region. But due to inherent hardware and energy limitation of sensor nodes, the realization of incorporating CR capability in sensor nodes imposes challenges. On top of that, CRSN nodes must handle additional challenges incurred by CR functionalities such as spectrum sensing, spectrum sharing, and spectrum management.
Suresh Nandikol and Udaya Rani [2]
Under wireless sensor network, the nodes are aligned and reconfigured according to the purpose of design and working environment; certain nodes are not successfully configured and thus termed as transfaulty nodes. The mode updating the information is via single node path or via multi node path. Reliable and efficient mode of node connectivity for transfaulty detection in network data fusion is performed to get actual information from the redundant information received from the radiation-affected area.
Ian F. Akyildiz et al., [3] Recent advances in wireless communications and electronics have enabled the development of lowcost, low-power, multifunctional sensor nodes that are small in size and communicate untethered in short distances. These tiny sensor nodes, which consist of sensing, data
processing, and communicating
components, leverage the idea of sensor networks. Sensor networks represent a significant improvement over traditional sensors.
Available online: http://edupediapublications.org/journals/index.php/IJR/ P a g e | 59
Cesare Alippi et al., [4] Energy conservation techniques for wireless sensor networks generally assume that data acquisition and processing have an energy consumption significantly lower than that of communication. Unfortunately, this assumption does not hold in a number of practical applications, where sensors may consume even more energy than the radio. In this context, effective energy management should include policies for an efficient utilization of the sensors, which become one of the main components affecting the network lifetime. In this work they proposed an Adaptive Sampling Algorithm that estimates on line the optimal sampling frequencies for sensors. This approach, which requires the design of adaptive measurement systems, minimizes the energy consumption of the sensors and, incidentally, also that of the radio, while maintaining a very high accuracy of collected data. As a case study, they considered a sensor for snow monitoring applications.
Ing-Ray Chen et al., [5] Data sensing and retrieval in wireless sensor systems have a widespread application in areas such as security and surveillance monitoring, and command and control in battlefields. In query-based wireless sensor systems, a user would issue a query and expect a response to be returned within the deadline. While the use of fault tolerance mechanisms through redundancy improves query reliability in the presence of unreliable wireless communication and sensor faults, it could cause the energy of the system to be quickly depleted. Therefore, there is an inherent trade-off between query reliability versus energy consumption in query-based wireless sensor systems. In this work , they developed adaptive fault-tolerant quality of service (QoS) control algorithms based on hop-by-hop data delivery utilizing “source” and “path” redundancy, with the goal to satisfy application QoS requirements while
prolonging the lifetime of the sensor system. They also developed a mathematical model for the lifetime of the sensor system as a function of system parameters including the “source” and “path” redundancy levels utilized and discovered that there exists optimal “source” and “path” redundancy under which the lifetime of the system is maximized while satisfying application QoS requirements. Numerical data are presented and validated through extensive simulation, with physical interpretations given, to demonstrate the feasibility of our algorithm design
Steven Kisseleff et al., [6] Wireless underground sensor networks (WUSNs) present a variety of new research challenges. Magnetic induction (MI) based transmission has been proposed to overcome the very harsh propagation conditions in underground communications in recent years. In this approach, induction coils are utilized as antennas in the sensor nodes. This solution achieves larger transmission ranges compared to the traditional electromagnetic (EM) waves based approach. In the past, some efforts have been made to characterize the signal
transmission in MI-WUSNs. Those
investigations, however, refer mostly to the information transmission. One of the open issues, that may constrain the systemdesign in some of the applications, is the powering of the individual sensor nodes. Due to the low accessibility of the nodes, a new method of wireless power transfer (WPT) for MI-WUSNs is proposed in this work.
This method is mainly based on
Available online: http://edupediapublications.org/journals/index.php/IJR/ P a g e | 60 system performance in terms of energy
efficiency.
Kealan McCusker and Noel E. O’Connor [7] developed a scheme for key distribution and network access in a Wireless Sensor Network (WSN) that utilizes Identity- Based Cryptography (IBC) is presented. The scheme is analyzed on the ARM920T processor and measurements were taken for the runtime and energy of its components. It was found that the Tate pairing component of the scheme consumes significant amounts of energy, and so should be ported to hardware. An accelerator was implemented in 65 nm Complementary Metal Oxide Silicon (CMOS) technology and area, timing, and energy figures have been obtained for the design. Results indicate that a hardware implementation of IBC would meet the strict energy constraint required of a wireless sensor network node.
Saad Ahmad Khan et al., [8] Sensor networks operating in the field might be subject to catastrophic events which destroy a large number of nodes in the geographic area. Often, the aftermath of such an event is the creation of a network of bridged fragments where connectivity is maintained by one or several bridge nodes. These networks are vulnerable, because the bridge nodes will soon exhaust their energy resources leading to the fragmentation of the network. This work describes a bridge protection algorithm (BPA), a combination of techniques which, in response to a catastrophic event, change the behavior of a set of topologically important nodes in the network. These techniques protect the bridge node by letting some nodes take over some of the responsibilities of the sink. At the same time, they relieve some other overwhelmed nodes and prevent the apparition of additional bridge nodes. To achieve this, the algorithm sacrifices the length of some routes in order to distribute
routes away from critical areas. In a variation on the BPA algorithm, we show that if geographic information about the nodes is available, replacing shortest path routing with a routing model which follows the edges of the relational neighborhood graph will lead to further improvements in the expected connected lifetime of the network.
J. Yoon, M. Liu, and B. Noble [9] This study examines the random waypoint model widely used in the simulation studies of mobile ad hoc networks. Our findings show that this model fails to provide a steady state in that the average nodal speed consistently decreases over time, and therefore should not be directly used for simulation. We show how unreliable results can be obtained by using this model.
In particular, certain ad hoc routing metrics can drop by as much as 40% over the course of a 900-second simulation using the random waypoint model. We give both an intuitive and a formal explanation for this phenomenon. We also propose a simple fix of the problem and discuss a few alternatives. Our modified random waypoint model is able to reach a steady state and simulation results are presented.
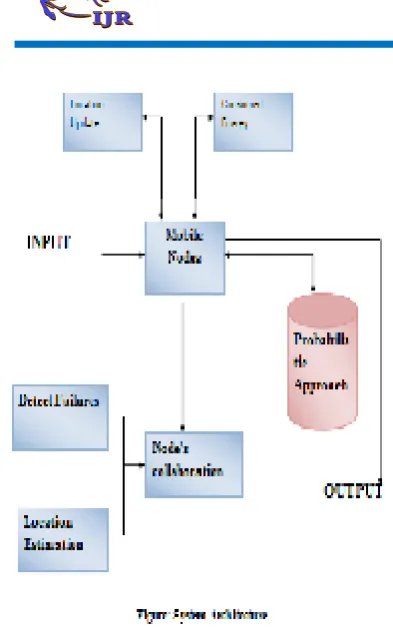
SYSTEM ARCHITECTURE
Available online: http://edupediapublications.org/journals/index.php/IJR/ P a g e | 61 In the above figure, the sensor node with the
components for sensing and detecting failures are discussed
The sensor node updates its location using GPS and updates its residual energy to balance the energy.
In the node collaboration block, the detection of failure nodes is done based on the probabilistic.
Once the failure is detected, the node gets collaborated with active nodes and updates its location and tries to route the data.
IMPLEMENTATION
In this project, Network Simulator 2 is used as a simulation tool. It contains an open source code that can be modified and extended. It is an object oriented, discrete event simulator for networking and provides best support for simulation. It is written in c++. For command and configuration interface, Otcl interpreter is used. When executed, Otcl instructions are translated to machine code by the interpreter.
Fig. 3 Basic Architecture of NS2
Various parameters are used to evaluate the performance of this system.
TABLE 1: Parameters used
Simulator NS2
Front End Otcl
No. of sensor nodes 43
RESULTS AND ANALYSIS
The result step or phase of project is the last step where the system can be evaluated in terms of performance and the results are verified using the graphs if the goals in the project that are described in the starting are met or not. The performance is checked using the values obtained. The performance is evaluated using the graphs.
PARAMETERS OF SIMULATION
Table 6.1: Simulation Parameters required for Performance Evaluation
Simulation Area 500*500 m2
No of nodes 30
Mac 802.11
Antenna Omni antenna
Transmission
Available online: http://edupediapublications.org/journals/index.php/IJR/ P a g e | 62 The proposed protocol is checked using
NS-2 simulator. A Wireless network is replicated. The simulation parameters required for the performance evaluation of the probabilistic of failure nodes are summarized in Table 6.1.
The traffic is generated at stable speed. 512 bytes is the size of the packet and moves at different random speed. The area is set to 500 * 500 m2 with 30 nodes. Each node moves randomly in this area, with speed of 0 to 15 m/s. The duration of each simulation is 180 seconds. Source and destination pairs are selected randomly. Source sends a packet to destination at an interval of 2 seconds which deployed in the simulation area. Each mobile node in the area are assigned with speed before start of simulation. Nodes are deployed randomly and assigned with direction of movement.
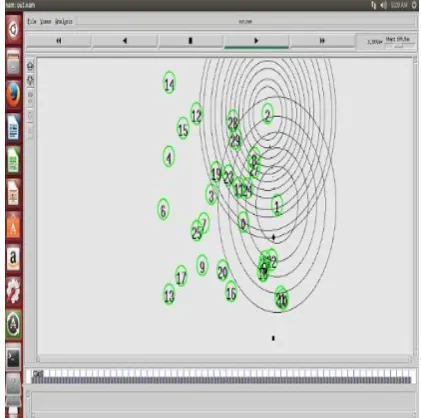
Figure 6: Node Deployment
In the above figure, initial node deployment is done using 30 nodes, nodes are deployed randomly, and these node are moving randomly in an area, all nodes are homogenous having the same configuration, the transmission range is set to 550 mts.
Figure 6.1 : Selecting source and destination
In the above figure shows the transmission of data between pair of source and destination, once source and destination is selected, the data being transmitted can be seen as dotted line, the source and destination is within the range, the probability of node getting failed is observed, since the nodes are mobile in nature
Available online: http://edupediapublications.org/journals/index.php/IJR/ P a g e | 63
Figure 6.3 : Nodes changing its location
In the above figure, the destination node changes its location, when the nodes location is changed the alter path is chosen to transmit data.
Figure 6.4 : Selecting alternate path
In the above figure, the alternate path is selected and data is transmitted, since the node is detected as failure, the node is turned into color and started dropping the packets
Performance Analysis Throughput
Throughput is defined as “the amount of data rates which are delivered to each node in a network”. Throughput is measured in bits per second.
The results are averaged for simulation runs. The different values of throughput for different nodes are tabulated in Table 6.2.
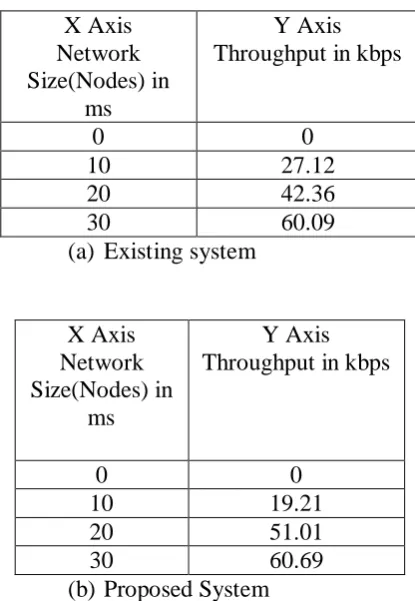
Table 6.2: Throughput Values for Existing, Proposed and Enhancement of the system
X Axis Network Size(Nodes) in
ms
Y Axis Throughput in kbps
0 0
10 27.12
20 42.36
30 60.09
(a) Existing system
X Axis Network Size(Nodes) in
ms
Y Axis Throughput in kbps
0 0
10 19.21
20 51.01
30 60.69
(b) Proposed System
Figure 6.5 shows the graph for comparison of throughput for existing, and proposed system. The throughput increases gradually in proposed system compared with the existing system.
Available online: http://edupediapublications.org/journals/index.php/IJR/ P a g e | 64
Figure 6.5 : Throughput Graph
Delay of the network”
The time taken for the node to travel from one node to the other along the network is referred to as delay. It is calculated in terms of fractions of seconds.
The results are averaged for simulation runs. The different delay values for different nodes are tabulated in Table 6.3.
Table 6.3: Delay Values for Existing and Proposed system
X Axis Network Size(Nodes) in
ms
Y Axis Delay in micro
seconds
0 0
10 28.92
20 75.10
30 119.92
(a) Existing System
X Axis Network Size(Nodes)
in ms
Y Axis
Delay in micro seconds
0 0
10 21.34
20 54.35
30 81.04
(b) Proposed System
Figure 6.6 shows the graph for comparison of delay for existing and proposed system. The delay decreases gradually compared with the existing.
Figure 6.6: Delay Graph
Packet Delivery Ratio”
PDR is defined as the ratio connecting the destinations of received packet to the packets generated at the source. Results are averaged for simulation runs. The different delay values for different nodes are tabulated in Table 6.5.
Table 6.5: Packet delivery ratio Values for Existing and Proposed system
X Axis Network Size(Nodes) in ms
Y Axis PDR in %
0 0
10 28
20 42
30 60
Available online: http://edupediapublications.org/journals/index.php/IJR/ P a g e | 65 X Axis
Network Size(Nodes) in ms
Y Axis PDR in %
0 0
10 25
20 51
30 66
(b) Proposed System
Figure 6.7 shows the graph for comparison of packet delivery ratio for existing and proposed System.
Figure 6.7 : PDF Graph
Overhead
Overhead is the excess combination time. The results are averaged for simulation runs. The different delay values for different nodes are tabulated in Table 6.6.
Table 6.6: Overhead Values for Existing and Proposed system
X Axis
Network Size(Nodes) in ms
Y Axis Overhead
0 0
10 0.8
20 1.3
30 2.1
(a) Existing System
X Axis
Network Size(Nodes) in ms
Y Axis Overhead
0 0
10 0.6
20 1.6
30 2.1
(b) Proposed System
Figure 6.8 shows the graph for comparison of overhead values for existing and proposed system
Figure 6.8: Overhead Graph
ADVANTAGES AND APPLICATIONS ADVANTAGES
The system is simple and reliable.
The cost of the system is less.
The system is well suitable for any environmental conditions.
There is gradual increase in throughput, decrease in delay.
Energy efficient.
APPLICATIONS
Used in monitoring of environment, fire detection.
For military applications
Available online: http://edupediapublications.org/journals/index.php/IJR/ P a g e | 66
CONCLUSION AND FUTURE WORK
In the proposed system, the detection of node failure using probabilistic approach is implemented, which combines the concept of location monitoring and the collaborative of nodes to transmit data in case of node failure, this scheme has been implemented for disconnected networks for WSN, the simulation results and analysis shows the detection of failure nodes and its alternative solution for efficient data transmission. The results shows increase in throughput, and less communication delay thus achieving efficient data communication and detection of failure nodes.
In the future enhancement, the failure detecting scheme can be implemented for transfaulty nodes in WSN using sleep and active cycle mode, within the nodes transmission range, thus to reduce energy consumption and to achieve more network lifetime.
REFERENCES
[1] H. M. Rehmani, M. Shadaram, S. Zeadally, and P. Bellavista, “Special issue on recent developments in cognitive radio sensor networks,” Pervasive Mobile Comput., 2015.
[2] I. F. Akyildiz, S. Weilian, Y. Sankarasubramaniam, and E. Cayirci, “A survey on sensor networks,” Commun. Mag., vol. 40, no. 8, pp. 102–114, Nov. 2002.
[3] I. F. Akyildiz, W. Su, Y. Sankarasubramaniam, and E. Cayirci, “Wireless sensor networks: A survey,” Comput. Netw., vol. 38, no. 4, pp. 393–422, 2002.
[4] K. McCusker and N. E. O. Connor, “Low-energy symmetric key distribution in wireless sensor networks,” IEEE Trans. Depend. Secure Comput., vol. 8, no. 3, pp. 363–376, May/Jun. 2011.
[5] C. Alippi, G. Anastasi, M. D. Francesco, and M. Roveri, “An adaptive sampling
algorithm for effective energy management in wireless sensor networks with energy-hungry sensors,” IEEE Trans. Instrum. Meas., vol. 59, no. 2, pp. 335–344, Feb. 2010.
[6] L. Buttyan, L. Czap, and I. Vajda, “Detection and recovery from pollution attacks in coding-based distributed storage schemes,” IEEE Trans. Depend. Secure Comput., vol. 8, no. 6, pp. 824–838, Nov./Dec 2011.
[7] I. Chen, A. P. Speer, and M. Eltoweissy, “Adaptive fault-tolerant QOS control algorithms for maximizing system lifetime of query-based wireless sensor networks,” IEEE Trans. Depend. Secure Comput., vol. 8, no. 2, pp. 161–176, Mar./Apr. 2011. [8] S. Khan, D. Turgut, and L. Boloni, “Bridge protection algorithms–A technique for fault-tolerance in sensor networks,” Ad Hoc Netw., vol. 24, pp. 186–199, Jan. 2015. [9] M. Miyazawa, M. Hayashi, and R. Stadler, “vNMF: Distributed fault detection using clustering approach for network function virtualization,” in Proc. IFIP/IEEE Int. Symp. Integr. Netw. Manage., May 2015, pp. 640–645.
[10] Rajeshwari B S, Dr. M Dakshayini, "Optimized Service Level Agreement Based Workload Balancing Strategy for Cloud Environment", an International Journal of
Advanced Computer Technology (IEEE
International Advance Computing
Conference (IACC)), May 2015, pp:160-165, ISSN: 978-1-4799-8047.
[11] Suresh Nandikol and Udaya Rani
(2016). Transfaulty Node Detection for a Reliable Data Transmission. International Journal of Electrical, Electronics and Computer Systems (IJEECS). 2016. ISSN (Online): 2347-2820, Volume -4, Issue-10_11.