Modeling, Simulation & VSI Frequency
Analysis of AC and DC interfaced PV/Wind
Hybrid System under Dynamic Conditions
Nagendra K1, N Krishnamurthy2, Raghu N3 and Trupti V N4
Research Scholars, Dept. of EEE, SET, Jain University, Karnataka, India1, 3 &4
Professor, Dept. of EEE, SET, Jain University, Karnataka, India, India2
ABSTRACT: Nowadays due to energy crises the renewable energy systems are contributing to meet load demand. Photovoltaic (PV) and wind energy systems are two major sharing sources among all renewable energy systems. The technology advancement and mass production of the equipments are taking place. Therefore the generation cost is coming down day by day.
This paper is to model and simulate AC shunted and DC shunted gird interfaced PV/wind hybrid systems to study the frequency response under different dynamic conditions.
KEYWORDS: AC shunted system, DC shunted system, hybrid energy system (HES), wind model, PV model, power
conditioning system, and MATLAB/Simulink.
I.INTRODUCTION
Renewable energy sources are playing the major role nowadays to meet the load demand. Due to increasing population and way of living the energy demand increases. The conventional power plants are providing the energy but one or the other day the fuel sources for conventional power plants will at the verge. Therefore by using renewable sources like wind, PV, fuel cell, micro turbine, wave and tidal energy the power plants are coming up to meet load demand. In renewable energy sources the major contribution is from PV and wind energy systems. Hybrid energy systems are commonly consists of two or more non conventional or conventional energy sources. In hybrid energy systems, majorly two topologies are in use. One is wind power with fuel cell will avoid disadvantage of wind power intermittency. Another one is PV and wind energy systems are used because of their inherent nature. Due to inherent nature, the hybrid PV and wind energy system is the best option to produce the reliable power.
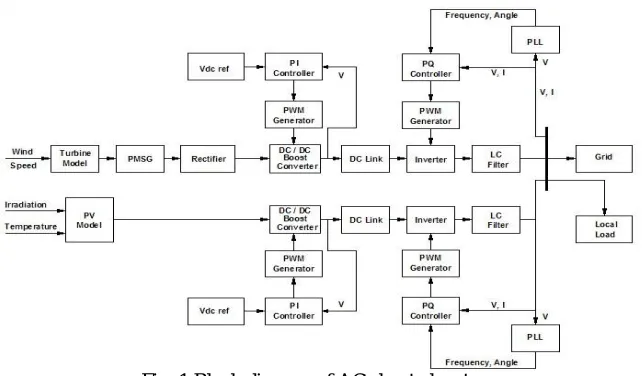
Fig. 1 shows the block diagram of AC shunted PV/Wind hybrid energy system. Here the model of wind turbine is interfaced to Permanent magnet synchronous generator (PMSG). AC output of PMSG is rectified by rectifier. The rectified output is controlled by boost converter. Output of DC/DC boost converter is connected to voltage source inverter (VSI). The VSI is connected to grid and it is controlled by PQ controller technique. The DC output of modeled photovoltaic array is connected to boost converter to control the DC voltage. Then it is connected to VSI. The VSI is connected to grid through LC filter and it is controlled by one more PQ controller as shown in Fig. 1.
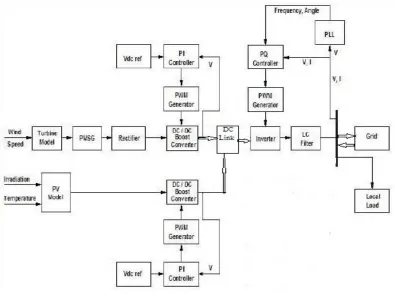
Fig. 2 Block diagram of DC shunted system
Fig. 2. shows block diagram of DC shunted system. Here model of wind turbine is connected to PMSG. The AC output of PMSG is rectified by rectifier. Rectified output is controlled by boost converter. Output of boost converter is connected to common DC link. The DC output of modeled photovoltaic array is connected to boost converter to control the DC voltage. Then it is connected to common DC link. Output of DC link is connected to VSI. A single VSI is connected to grid and it is controlled by PQ controller technique.
II. MODELING AND POWER CONVERTER SYSTEM FOR WIND AND PV HES
2.1 PV model
Equations from theory of semiconductors which mathematically describe the I-V characteristic of an ideal PV cell is used in modeling.
I = I , −
I , [exp( qV akT)−1] I
I = I, {exp qV
A ∗k∗T −1 (2.2)
Where,
Ipv,cell is current produced by incident light, Id is diode current, I0,cell is reverse saturation current of the diode, q is
electron charge [1.60217646 x 10⁻¹⁹ C], k is Boltzmann constant [1.3806503 x 10⁻²³ J/K], T is temperature of
junction [K] and a is diode ideality constant.
2.2 Wind turbine model
Following equations are used in wind model:
P = C (λ,β)ρA 2 V
(2.3)
CP is power coefficient and characterizes ability of the wind turbine to extract energy. Cq is torque coefficient and is
related to CP:
C =C λ
(2.4)
T =P
ω =
1
2ρ∏R C (λ,β)V
(2.5)
λ=R∗ ω
V
(2.6)
Where,
ρ is the air density, Vwind is speed of wind, A is swept area of turbine, ½ρA Vwind3is kinetic energy, λ is tip speed
ratio, R is radius of blades, Cp is coefficient of performance, Pm is shaft output power, T is torque of turbine, ω is
angular frequency and β is blade pitch angle.
The Cp (λ, β), which depends on tip speed ratio λ and blade pitch angle β, determines how much kinetic energy can be
captured by the turbine system.
C (λ,β) = C C
λ −C β+ C e + C
(2.7)
Where, C1=0.5176, C2=116, C3=0.4, C4=5, C5=21and C6=0.0068
1
λ =
1 λ+ 0.08β−
0.035
β + 1
(2.8)
2.3 Boost converter design
The main components parameters of boost converter are designed as follow:
D = 1− V
V (2.9)
R =V
P (2.10)
L =D(1−D) R
2∗f (2.11)
C≥ V ∗D
R∗f ∗ ΔV (2.12)
Fig. 3 PI controller for boost converter
The boost converter is tuned in closed loop using PI controller as shown in Fig. 3.
2.4 Three phase inverter
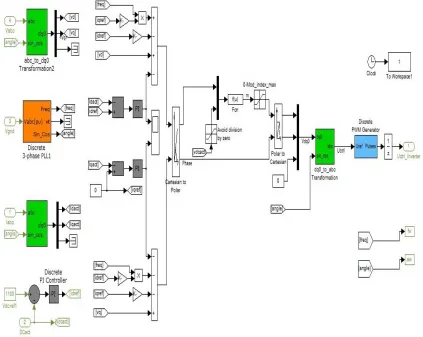
The VSI is controlled by two methods. Active and reactive power control scheme (PQ control) during grid connected operation and active power and voltage scheme (PV control) during isolated operation. In this paper the PQ control scheme is implemented using park transformation and PI controllers using SIMULINK as shown in Fig. 4.
III. RESULTS AND DISCUSSION
The performance study has been done using simulated model under different dynamic conditions. The results are as follow:
3.1 Load Variation
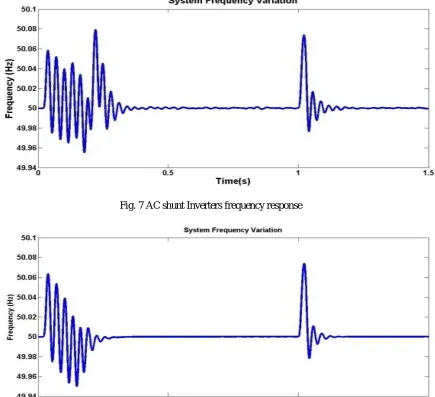
The inputs like irradiation, temperature, wind speed and load are constant. The irradiation 1000 W/m2, temperature 250C, wind seed 12 m/s and load parameters as 125 kW active power, 41.08 kVAR reactive power are given. In this case the load is increased during 1s. Remaining parameters are kept constant. The results are as follows:
Fig. 7 AC shunt Inverters frequency response
In Fig. 7 starting transient oscillations and magnitude of frequency deviation is higher than Fig. 8 which shows DC shunted system performance.
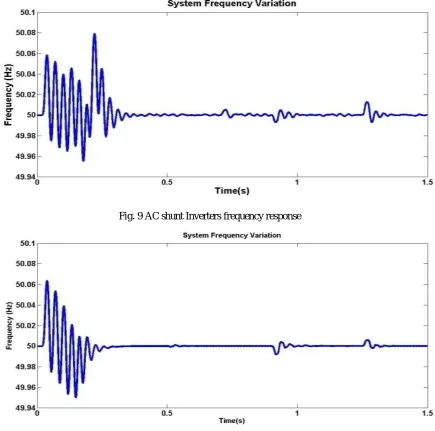
3.2 Generation Variation
The inputs like irradiation, temperature, wind speed and load are constant. The irradiation 1000 W/m2, temperature 250C, wind seed 12 m/s and load parameters as 125 kW active power, 41.08 kVAR reactive power are given. In this case wind seed increased from 12 m/s to 14 m/s 0.7s, temperature is changed from 200C to 300C at 0.9s and Irradiation is increased from 1000 W/m2 to 1800 W/m2 at 1.25s. The results are as follows:
Fig. 9 AC shunt Inverters frequency response
In Fig. 9 the oscillations and frequency deviation magnitude is more than DC shunted system which is represented in Fig. 10. Even the disturbance magnitude is more in Ac shunted system when there is a change in input power from PV-wind.
3.3 LG fault
The inputs like irradiation, temperature, wind speed and load are constant. The irradiation 1000 W/m2, temperature 250C, wind seed 12 m/s and load parameters as 125 kW active power, 41.08 kVAR reactive power are given. Here LG fault is created during (0.5 - 0.55) s. The results are as follows:
Fig. 11 AC shunt Inverters frequency response
Fig. 12 DC shunt inverter frequency response
Over all the frequency responses are within the limit of synchronization parameter as mentioned in (IEEE 1547 2008) i.e; (49.3-50.5) Hz for >30 kW rated energy systems. The DC shunted system is having less frequency disturbances for all different conditions compare to AC shunted systems.
VI. CONCLUSION
The modeling of AC shunted and DC shunted grid interfaced HES have been implemented using MATLAB/SIMULINK.
The model is performed under different possible conditions to study system response. From the results, it seen that the DC shunted system is having less disturbance in frequency variation in all cases compared to AC shunted hybrid energy system. It is better to go DC shunted topology resulting into single inverter which is more economical.
The PI controller can be tuned using Fuzzy and ANN techniques to minimize the disturbances and to improve power quality.
REFERENCES
[1] Alejandro Rolan, Alvaro Luna, Gerardo Vazquez and Gustavo Azevedo, “Modeling of a Variable Speed Wind Turbine with a Permanent Magnet Synchronous Generator,” IEEE International Symposium on Industrial Electronics, 2009.
[2] Azuki Abdul Salam, Ismail Adam, Fatimah Zaharah, Ahmed M. A. Haidar, “Behaviour of Grid Connected Photovoltaic Systems,” ISIEA-IEEE, 2011.
[3] B. M Hasaneen and Adel A. Elbaset Mohammed, “Design and Simulation of DC/DC Boost Converter,” IEEE, 2008.
[4] Frede Blaabjerg, Zhe Chen and Soeren Baekhoej Kjaer, “Power Electronics as Efficient Interface in Dispersed Power Generation Systems” IEEE Transaction on power electronics, VOL 19, NO. 5, 2004.
[5] IEEE 1547, “IEEE Standard for Interconnecting Distributed Resources with Electric Power Systems,” IEEE Standards Coordinating Committee 21 on Fuel Cells, Photovoltaics, Dispersed Generation, and Energy Storage, 2008.
[6] Kiam Heong Ang, Gregory Chong and Yun Li, “PID Control System Analysis, Design, and Technology,” IEEE Transactions on Control Systems Technology, vol. 13, no. 4, 2005.
[7] Marcelo Gradella Villalva, Jonas Rafael Gazoli, and Ernesto Ruppert Filho, “Comprehensive Approach to Modeling and Simulation of Photovoltaic Arrays,” IEEE TRANSACTIONS ON POWER ELECTRONICS, VOL. 24, NO. 5, MAY 2009.
[8] Nagendra K, Vinatha U, Krishnamurthy N, Raghu N, “Performance study of grid connected wind and photovoltaic hybrid energy system under variation of generation”, The Journal of CPRI, Vol. 10, No. 3, pp. 501-506, September 2014.
[9] Nagendra K, Krishnamurthy N, Raghu N, Trupti V.N, “Analysis of AC-shunted grid interfaced hybrid Photovoltaic/wind energy system using dynamic Simulation model”, Journal of Electrical Engineering, Mar 31, 2016.
[10] Nagendra K, Krishnamurthy N, Raghu N, Sowjanya reddy, Sai Mahesh, ”Modeling and simulation study of permanent magnet synchronous generator based wind turbine system in micri grid applications”, Vol 1, issue 5, IJARIIE, ISSN-(O)-2395-4396, 2016.
[11] Sajib Chakraborty, S M Salim Reza, Wahidul Hasan, “Design and Analysis of Hybrid Solar-Wind Energy System Using CUK & SEPIC Converters for Grid Connected Inverter Application”, IEEE PEDS, 2015.
[12] Vechiu, A. Llaria, O. Curea and H. Camblong, “Control of Power Converters for Microgrids,” MONACO, 2009.