Copyright1999 by the Genetics Society of America
Fine Mapping and Characterization of Linked Quantitative Trait
Loci Involved in the Transition of the Maize Apical Meristem From
Vegetative to Generative Structures
Cristian Vla˘dut¸u, John McLaughlin and Ronald L. Phillips
Department of Agronomy and Plant Genetics, University of Minnesota, Saint Paul, Minnesota 55108 Manuscript received November 13, 1998
Accepted for publication June 25, 1999
ABSTRACT
Quantitative trait locus (QTL) mapping has detected two linked QTL in the 8L chromosome arm segment introgressed from Gaspe´ Flint (a Northern Flint open-pollinated population) into the background of N28 (a Corn Belt Dent inbred line). Homozygous recombinant lines, with a variable length of the introgressed segment, confirmed the presence of the two previously identified, linked QTL. In the N28 background, Gaspe´ Flint QTL alleles at both loci induce a reduction in node number, height, and days to anthesis (pollen shed). Given the determinate growth pattern of maize, the phenotypic effects indicate that the two QTL are involved in the transition of the apical meristem from vegetative to generative structures. Relative to the effects of the two QTL in the background of N28, we distinguish two general developmental factors affecting the timing of pollen shed. The primary factor is the timing of the transition of the apical meristem. The second, derivative factor is the global extent of internode elongation. Having separated the two linked QTL, we have laid the foundation for the positional cloning of the QTL with a larger effect.
T
HE formal distinction between qualitative (discon- phenotypic effect of the introgressed QTL. Following tinuous) and quantitative (continuous) types of a whole-genome QTL analysis, the molecular marker-trait variation lies in the magnitude of the phenotypic assisted generation of BDLs and a subsequent allelism effect of particular alleles in given genetic backgrounds test led to the identification of teosinte branched1 as one and environments. Depending on the genetic constitu- of the genes responsible for the drastic morphological tion of the parental material used to generate the segre- differences between maize (Zea mays ssp. mays) and its gating population and the environmental conditions, probable progenitor, teosinte (Z. mays ssp. parviglumis; virtually any trait can display a range of distributions, Doebley and Stec 1993; Doebley et al. 1995). The from discontinuous with clear-cut phenotypic classes to potential of the BDL method has been exploited on a continuous unimodal. On the one hand, every major broader scale in tomato through the development of gene can be involved in the quantitative type of trait an introgression library comprising 50 BDLs, each car-variation, i.e., it may behave as a quantitative trait locus rying a single chromosomal segment from Lycopersicon (QTL;Robertson1985). On the other hand, there is pennellii, a green-fruited wild tomato species, within the a putative class of genes—those that are functionally background of L. esculentum, the cultivated tomato redundant—for which extreme phenotypes cannot be (EshedandZamir1994). The 50 BDLs with L. pennellii identified in heterogeneous genetic backgrounds. overlapping chromosomal segments spanning the en-Genes belonging to the latter class would always behave tire tomato genome provide a valuable, continual tool as QTL in heterogeneous backgrounds and conse- for the fine genetic dissection of various traits (Eshed quently, increased efforts are required for their genetic andZamir1994). One of the BDLs generated byEshed analysis. andZamir(1994, 1995) has been used for the construc-Following the example of Wehrhahn and Allard tion of a high-resolution map around a fruit mass QTL (1965), attempts to genetically dissect the quantitative (Alpertet al. 1995;AlpertandTanksley1996). behavior of trait variation have utilized backcross- Employing the BDL method, in this study we have derived lines (BDLs). In principle, the absence of other detected two linked QTL in maize, each affecting node segregating QTL in crosses between the BDL and the number, height, and maturity (days to pollen shed). recurrent parent allows for enhanced resolution of the Given the determinate growth pattern of maize, the phenotypic effects indicate that the two QTL are in-volved in the transition of the apical meristem from Corresponding author: Ronald L. Phillips, Department of Agronomy vegetative to generative structures. The two QTL, ofand Plant Genetics, University of Minnesota, 411 Borlaug Hall, 1991
unequal effect, are located 12–20 cM apart on the
chro-Upper Buford Circle, St. Paul, MN 55108.
E-mail: [email protected] mosome 8 L segment introgressed from Gaspe´ Flint
cept for the chromosomal segments retained from GF in 1L, (GF), the donor parent of “early maturity” genes, into
6L, and 8 L (Figure 1), the genome of the E20 versions is the background of N28, the recurrent parent. We have
assumed to be that of N28. The use of E20 plants in some confined the major QTL within a 5-cM interval. experiments preceded the identification of their exact
geno-Relative to the effects of the two QTL in the back- type.
Eighty-eight E20-A3N28 F3 families were used for QTL ground of N28, we distinguish two developmental
fac-mapping in the background of N28. Because two linked QTL tors affecting the timing of anthesis (pollen shed). The
were detected (seeresults), we selected homozygous recom-primary factor, clearly affected by the two QTL, is the
binant F3and F4plants with a variable length of the 8 L segment timing of the transition of the apical meristem. The introgressed from GF in the otherwise homogeneous back-second factor is the extent of stem elongation, which ground of N28. The recombinant plants with an “A” designa-tion were selected from E20-A 3 N28 F2:4 families whereas depends on the total number of phytomer primordia
those with a “C” designation were selected from E20-C3N28 formed until the transition of the apical meristem from
F3families (seeresults). vegetative to generative growth. The trait values of the
In each experiment (see below), the experimental unit con-four homozygous genotypes at the two linked QTL were sisted of a row 6.7 m in length. Thirty-five kernels were planted subjected to additive3additive contrasts. In the back- in each row; later the stands were thinned to 30 plants/row. The distance between rows was 76 cm, resulting in 58,917 ground of N28, the two linked QTL, in homozygous
plants/ha. condition, behave in an additive manner with respect
Fifteen to 25 14-day-old seedlings, grown in pots in the to node number (ND), suggesting the possibility of their
greenhouse, from F3, F3:4, and F4:5families, were pooled for being involved in different pathways during tassel initia- DNA extraction to infer the molecular marker genotype of tion. The significant deviations from additivity for their progenitor plant.
RFLP analysis:DNA isolation, Southern blotting, and32
P-height (HT) and days to pollen shed (DPS) may suggest
labeled hybridization were performed according to estab-(1) differences in the systemic coordination of
in-lished procedures (FeinbergandVogelstein1983;
Saghai-ternode growth when the total number of stem units
Maroofet al. 1984;Sambrooket al. 1989). The DNA clones (phytomers) is altered; (2) that the two QTL interact used as probes were provided by the University of Missouri at during the post-transitional growth; or (3) introgression Columbia (UMC and CSU ), Plant Gene Expression Center, Albany, CA (Ec2-11), University of California at Berkeley (UC-of other, linked QTL with a small effect, affecting shoot
Banp1), CSIRO, Division of Plant Industry, Australia (PIC6), development. Finally, we discuss the feasibility of
posi-University of Bologna, Italy (PG7 ), Kansas State posi-University tional cloning of the QTL with a larger effect.
(DGG9), Native Plants Inc. (NPI ), Brookhaven National Labo-ratory (BNL), and Universita¨t zu Ko¨ln, Germany (ZmHox1).
Trait measurement, experimental design, and statistical
MATERIALS AND METHODS analysis:The three traits measured in each experiment were DPS, ND, and HT. DPS was invariably measured as the number
Plant materials:GF, the donor parent of the “early maturity”
of days from planting until 50% of the plants within a row genes, is a Northern Flint open-pollinated population
col-had the first healthy anther extruded. DPS was recorded on lected from the Gaspe´ Peninsula of Quebec, Canada, and
a daily basis. Within a given experiment, ND and HT (in homogenized for early maturity through mass selection
centimeters) were measured (see below) a few days after the (Brawn1968). N28, the recurrent parent, is a Corn Belt Dent
latest entries shed pollen. inbred line derived from Nebraska Stiff Stalk Synthetic (SSS),
QTL mapping in the background of N28: The 88 E20-A3N28 which, through Iowa SSS, traces back to Reid Yellow Dent, a
F3families were grown within a randomized complete block Corn Belt Dent open-pollinated population (Gerdes et al.
design (RCBD) in two locations situated z60 km apart, St. 1993). E20, the early maturing derivative of N28, is the result
Paul and Rosemount, Minnesota, in 1994. Two replications of 20 uninterrupted backcrosses following the cross between
were planted in each location, May 10 in St. Paul and May 11 GF and N28 (D. Shaver,personal communication). Within
in Rosemount. HT was measured from ground to the level of each backcross generation, several of the earliest plants were
the ligule of the top leaf and ND was counted from the first backcrossed again to N28. After the 20th backcross within
node above the ground to the node corresponding to the top each backcross progeny, the earliest plants were sib-mated
leaf. For each row, a single, average plant was measured for twice and thereafter selfed. Pooled kernels from one of the
ND and HT. resulting selfed ears were the source of E20 (D. Shaver,
per-Within each location, the phenotypic data were first sub-sonal communication). Kernels of GF, N28, and E20 were
jected to an analysis of variance with the (random effect) provided by D. Shaver (Cornnuts Inc., Salinas, CA). E20 sheds
model, pollen earlier, is shorter, and has fewer nodes than N28. An
initial survey of N28 and E20 with 95 genomic clones, covering Y5 m 1B1G1ε, all 10 chromosomes of maize, identified restriction fragment
length polymorphism (RFLP) for UMC12a on chromosome where Y is the trait value of a row, mis the mean of the F3 population, B is the effect of the replication, G is the effect arm 8 L and UMC84a on 1L (Kim1992). Only UMC12a showed
significant association with the variation of days to pollen shed, of the F3family, and εis the error. This model was used to estimate the genetic variances and broad-sense heritabilities days to silking, height, and node number in E203 N28 F2
and F3populations, each of 90 entries (Kim1992). within each location. For each trait, an F-test was used to check the homogeneity of the error variances between the Screening the E20 material more extensively with DNA
clones, we detected heterogeneity within E20 relative to the two locations. The F-test was not significant (P. 0.05) for DPS but significant (P,0.05) for ND and HT. Nonetheless, chromosomal segments retained from GF (Figure 1). This
indicates that the source of E20 was heterozygous/heteroge- considering the small differences between the error variances for ND (0.67 for St. Paul vs. 0.45 for Rosemount) and HT neous. The three E20 genotypes identified so far, E20-A,
each trait and molecular marker data to an analysis of variance the number of nodes situated above the insertion of the top ear.
across the two locations. The following (mixed, unbalanced)
model was used for the analysis of variance across locations, HT was measured from ground to the tip of the tassel. A single, average plant was measured for HT in each row.
Y5 m 1L1B(L)1M1G(M )1M * L The homogeneity of variances was checked and validated
(at a 5 0.05 for DPS and ND, and at a 5 0.01 for HT)
1G(M * L)1ε,
by the Hartley test (Hartley 1950). Multiple comparisons between lines were carried out only for DPS, ND, and HT. where Y is the trait value of a row,mis the mean of the F3
Pairwise comparisons were performed using t -tests with a com-population, L is the effect of the location, B(L) is the effect
parisonwise type I error set by the Bonferroni inequality of the replication nested in location, M is the effect of the
(Miller1981) ata 50.00064 (this ensures an experimentwise molecular marker, G(M ) is the effect of the F3family nested
a , 0.05). Four contrasts (Steel and Torrie 1980) were in molecular marker, M * L is the effect of the interaction
preplanned. Three contrasts were intended to discriminate between molecular marker and location, G(M * L) is the effect
between groups of lines. The fourth, additive3additive (A3 of the interaction between the F3family nested in molecular
A), contrast tested the null hypothesis, H0, NN1GG5NG1 marker and location, andεis the error. All factors were
consid-GN, vs. the alternative hypothesis, Ha, NN 1 GG ≠ NG 1 ered random except the molecular marker, which was
consid-GN, where N designates homozygosity for the N28 alleles, ered fixed. The above model is essentially the one proposed
G designates homozygosity for the GF alleles, and for each byKnapp(1994); the slight modification consisted in nesting
genotype, the first letter represents the major QTL and the the replication in location. The above model was used for
second letter represents the minor QTL of chromosome arm each pairwise combination of trait and molecular marker.
8L. Using the Bonferroni inequality for each contrast, the Because significant interactions were found between
molecu-comparisonwise type I error was set ata 50.0125. lar markers and location, the data were further analyzed
sepa-The raw phenotypic data were used in all statistical analyses rately for each location.
mentioned above. The analyses of variance and multiple com-Composite interval mapping (CIM) by multiple regression
parisons were performed using the GLM procedure of SAS using selected markers as cofactors (Jansen1993;Zeng1994)
version 6.3 (SAS Institute1994). The segregation ratios for was performed with the PLABQTL software (Utzand
Mel-the molecular markers were analyzed using LINKAGE-1
ver-chinger1996). The inclusion of appropriate markers as
cofac-sion 3.5 (Suiteret al. 1983). The linkage maps (in Haldane tors in multiple regression models removes the confounding
centimorgans) were assembled using MAPMAKER/EXP ver-effects of QTL placed outside the intervals being tested (
Jan-sion 3.0 (Lincolnet al. 1992).
sen1993;Zeng1994). Compared to simple interval mapping (SIM; without cofactors), CIM provides an increased power to detect linked QTL (Zeng1994). Empirical threshold levels
RESULTS for the LOD score (DoergeandChurchill1996) were
estab-lished for each chromosomal arm (1L and 8L) and trait. The
RFLP composition of E20 and linkage analysis in the
empirical threshold levels (a 5 0.05) were based on 1000
background of N28:RFLP screening detected heteroge-permutations of the phenotypic data using model 3 (simple
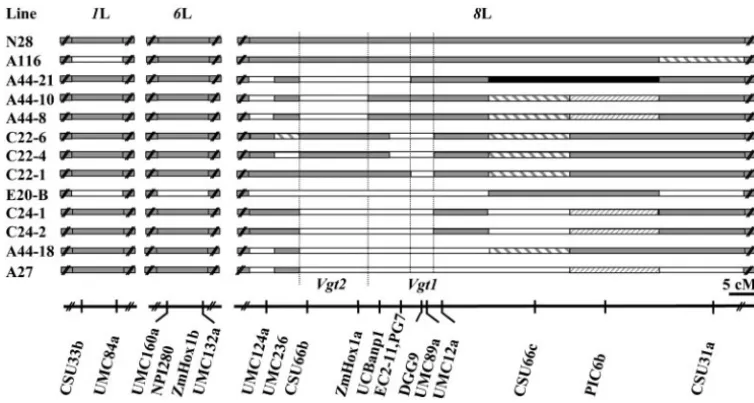
interval mapping) of the QTL CARTOGRAPHER software neity within E20 relative to chromosome arms 1L, 6L, (Bastenet al. 1995–1996). and 8L (Figure 1). The only common chromosomal SIM was the first step performed with PLABQTL. SIM could segment retained from GF by the three E20 versions lies not distinguish between a single or linked QTL on 8L. Next,
on 8L between UMC236 and UMC12a. The phenotypic the 8L marker with the highest LOD score detected by SIM
similarity of the three E20 genotypes suggests that the (either PG7 or DGG9, depending on the trait and location)
was used as cofactor. A secondary, linked region marked by common GF segment of 8L largely accounts for the ZmHox1a was identified for DPS but not for ND and HT. phenotypic differences between the E20 genotypes and The inclusion of both DGG9 and ZmHox1a as cofactors in the N28. The 6L segment retained from GF in E20-B shares regression models for DPS evidenced a significant QTL on
duplicated DNA sequences (such as ZmHox1) with the 1L for the St. Paul data. For each trait and location, the
8L segment retained from GF by all three E20 variants. final regression model, which used the exact coordinates of
The interspersed RFLP composition of the 8L seg-significant QTL peaks, was the model that minimized the
Aikaike’s information criterion (Jansen1993). ments is likely the result of recombination (after the Confirmation of the two linked QTL on chromosome arm 8L: The completion of the backcross program) between two hy-selfed progenies of the homozygous recombinant F3and F4 pothetical original versions: one with an uninterrupted plants (see Plant materials), along with several other lines
(Fig-GF segment between UMC236 and UMC12a and the ure 5), were planted within a RCBD with six replications in
other with an uninterrupted GF segment encompassing St. Paul, May 10, 1997. In each row, seven random plants were
measured for ND and several other traits (see below). For UMC124a and CSU31a. each row, the mean value of the seven plants was used in the In the E20-A3N28 F
2population, the P values associ-statistical analyses. In this experiment ND represents the total ated with the goodness-of-fit (x2) tests for 1:2:1 or 3:1 (leaf ) ND and it was counted as follows. The sixth leaf
(exclud-segregation ratios ranged from 0.09 for CSU66c to 0.97 ing the coleoptile) was marked when the first leaf was still
for UMC89a. visible ( June 19). The 12th leaf was marked when the 6th,
previously marked leaf was still visible ( July 5). The 12th leaves After 20 backcrosses, z5 cM are expected to be re-marked were still attached to plants when the total number tained on each side of the selected gene (Naveiraand of leaves was counted (August 5). On June 19 and July 5, the Barbadilla1992). Ignoring the interspersed configu-number of the last leaf emerging from the whorl was recorded.
ration of the 8L segments, all chromosomal fragments On July 5 we also counted the leaf on which the transition
retained from GF exceed the expected linkage drag (Fig-from juvenile to adult traits (marked by the occurrence of
Figure1.—RFLP hetero-geneity within E20 and link-age maps of chromosome arms 1 L, 6 L and 8 L. , ho-mozygous N28; h, homo-zygous GF. The maps (in Haldane centimorgans) were constructed using 88 E20-A3N28 F2plants. The marker order and approxi-mate genetic distances for 6L are based on the UMC and BNL 1995 maps (Coe
et al. 1995;Matzet al. 1995). The relative position of UMC236 in 8L is based on the UMC 1995 map (Coeet al. 1995) and on the map-ping data obtained from a GF3 N28 F2population (Vla˘dut¸u1998). 1L and 6L are not scaled relative to 8L. For each chromosomal segment, the left and right ends indicate the proximal and distal ends, respectively.
genes and/or reflects sampling variability during selec- Rosemount) distributions of DPS suggest segregation of a QTL with a large effect(s). The genetic variances tion in each backcross generation.
QTL mapping in the background of N28: Figure 2 for each trait were highly significant (P,0.001) in each location.
shows the distribution of the three traits (DPS, ND, and
HT) within the E20-A3 N28 F3population in the two In the analyses of variance across locations, all mark-ers (the M term in the linear model) of chromosome locations. The trimodal (in St. Paul) and bimodal (in
tween CSU66b and UCBanp1, was also detected for DPS in both locations (Figure 4). For chromosome arm 1L, the LOD score (2.45) exceeded the threshold level (1.89) only for DPS in St. Paul (not shown). The de-tected QTL explain most of the genetic variance for each trait and location (Table 1). Compared with the analyses of variance (Figure 3) and SIM (not shown), which could not resolve the two linked QTL of 8L, these results (Figure 4 and Table 1) exemplify the increased power of CIM to detect linked QTL.
The negative value of the additive effect (a) for the QTL detected on 1L (DPS, St. Paul; Table 1) would indicate that the GF allele increases the trait value. The differences between the a values at the major 8L-QTL for DPS and ND in the two locations (Table 1) alone could explain the significance of the M * L terms in the analyses of variances across locations. Across traits and locations, the d/a ratios (which can be computed using the d and a values from Table 1) are in the range of additivity-semidominance (toward the N28 allele) at the major 8L-QTL and additivity at the minor 8L-QTL and 1L-QTL.
Given the determinate growth pattern of maize, the
Figure3.—Graphic display of the associations between the fact that the major 8L-QTL is approximately placed at DNA markers of chromosome arm 8L and the variation of
the same chromosomal position for each of the three the three traits (HT, DPS, and ND) within the E20-A3N28
traits (Figures 3 and 4) indicates that the high correla-F3population as established by the analysis of variance across
tions between the traits (Table 2) are likely the result the two locations (St. Paul and Rosemount, 1994). The lines
uniting the sum of squares were used only to help visualize of pleiotropy.
the data; they do not indicate the values between the markers. Confirmation of the two linked QTL of chromosome
be-Figure4.—QTL likelihood maps for DPS, HT, and ND on chromosome arm 8L in the E20-A3N28 F3population. The QTL maps, corresponding to the final regression models computed by PLABQTL, are shown separately for each location, St. Paul and Rosemount, in 1994. For each location, the trait values were the means of two replications. The horizontal dashed line indicates the threshold value (also shown above the dashed line).
for DPS and HT, three contrasts (C1 for DPS, C2 and (Table 3) indicate that the combined effect of the GF alleles at Vgt1, Vgt2, 1L-QTL, and the putative 6L-QTL C3 for HT) were tested (Table 4). The Bonferroni
groupings (Table 3) and the statistical significance of is not stronger than the effect of the GF alleles at Vgt1 and Vgt2 alone.
the three contrasts (Table 4) together with the RFLP
composition of the selected lines (Figure 5) provide A3A contrasts—partial tests of interaction between the two linked genes: The A 3 A contrast comparing compelling evidence for the presence of two linked QTL
on 8L. These results indicate that the minor 8L-QTL, the homozygous genotypes at the two linked genes (Vgt1 and Vgt2) was significant for DPS and HT but not sig-detected by QTL mapping only for DPS (Figure 4),
actually is involved, like the major 8L-QTL, in the vegeta- nificant for ND (Table 4). The graphic representation of the statistical significance of the A3 A contrasts is tive-to-generative transition.
The four groups of lines defined by the Bonferroni provided in Figure 6. The morphological and phenolog-ical differences among the four homozygous genotypes grouping for ND, relative to the RFLP composition of
8L, correspond to the four homozygous genotypes at are illustrated in Figure 7. the two linked QTL. Assuming that each QTL harbors
a single gene, we named the respective genes Vegetative
DISCUSSION to generative transition1 (Vgt1, at the major QTL) and -2
(Vgt2, at the minor QTL; Figure 5 and Table 4). E20 as a product of backcrossing: Map distances: It
appears that the discrepancy between the expected ge-Because line A116 was significantly different than N28
for each trait (Table 3), the Bonferroni groupings also netic lengths of the introgressed segments (Naveira andBarbadilla 1992) and the genetic distances esti-confirmed the presence of a QTL, with a small effect,
placed on 1L. The 1L-QTL, like the 8L-QTL, seems to mated in the E20-A3N28 F2population (Figure 1), as previously suggested, can be explained by at least two be involved in the transition of the apical meristem to
intro-TABLE 1
Estimates of genetic parameters in the E20-A3N28 F3population
St. Paul, 1994 Rosemount, 1994
Parameter DPS ND HT DPS ND HT
H2 0.96 0.79 0.82 0.92 0.66 0.84
(0.93, 0.97) (0.69, 0.86) (0.73, 0.88) (0.88, 0.95) (0.48, 0.78) (0.76, 0.89)
GVE 0.94 0.90 0.84 0.86 0.93 0.82
a8M 3.20*** 1.52*** 11.21*** 2.44*** 0.90*** 9.68***
d8M 0.90** 0.13 (NS) 0.61 (NS) 0.84* 0.15 (NS) 0.86 (NS)
a8m 1.14*** — — 1.10*** — —
d8m 20.46 (NS) — — 0.42 (NS) — —
a1 20.80*** — — — — —
d1 0.30 (NS) — — — — —
H2, broad-sense heritability estimated on a F
3family basis by the variance components method (Hallauer andMiranda1988); the numbers in parentheses represent the 95% confidence interval for the corresponding H2(computed as described byKnappet al. 1985); GVE, proportion of the genetic variance explained by the final regression model, computed as R2/H2, where R2is the coefficient of determination for the final regression model; a, additive effect, representing half the difference between the means of the homozygous classes at a given QTL; negative value of a indicates that the GF allele increases the trait value; d, dominance effect (adjusted for the use of F3families), representing the difference between the mean of the heterozygous class and the mean of the homozygous classes at a given QTL; negative value of d indicates that the dominance is toward the GF allele; 8M, the major OTL on chromosome arm 8L; 8m, the minor OTL on 8L (see Figure 4); 1, the QTL on 1L.
*P,0.05; **P,0.01; and ***P,0.001; NS, not significant ata 50.05; —, the QTL effect was below the LOD threshold (the QTL was not included in the final regression model). The estimates of GVE, a and d, and levels of significance were provided by the PLABQTL software (UtzandMelchinger1996).
gressed segment of chromosome arm 8L, is selection biased estimates. Nonetheless, the consistency of the statistical results suggests that overall, the genetic param-for linked genes (Figures 4 and 5). The second factor,
suggested again by the case of the 8L segment, is likely eters were estimated accurately. Also, with the exception of one trait in one location (ND in St. Paul; P,0.05), represented by sampling variability during the backcross
program. the distributions of the residuals from the final regres-sion models did not significantly deviate from normality Also, the gradual homogenization of the genetic
back-ground during the backcross program may induce grad- (P.0.2) as judged by the Shapiro-Wilk test (Shapiro andWilk1965). Furthermore, the presence and posi-ual or sudden changes in recombination frequencies in
successive backcross generations. Therefore, the genetic tion of the three QTL detected by QTL interval mapping have been unambiguously confirmed by the analysis of distances estimated in the E20-A3N28 F2 population
would reflect the recombinogenic activity, in the respec- recombinant lines.
In the background of N28 the GF alleles at both Vgt1 tive chromosomal regions, attained only at the end of
the backcross program. and Vgt2, as expected, reduce the values of the three correlated traits relative to the N28 alleles (the positive QTL and phenotypic selection: Although both analysis
of variance and regression are robust to deviations from values of a8Mand a8min Table 1; Table 5). However, QTL
mapping in the E20-A3N28 F3population somewhat normality (SteelandTorrie1980), the nonnormality
of the trait distributions (Figure 2) could have led to unexpectedly indicated that at the 1L-QTL with a small effect, the GF allele delays the timing of anthesis relative to the N28 allele (the negative value of a1 in Table 1).
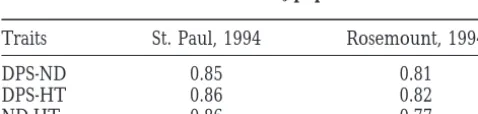
TABLE 2
In contrast, the phenotypic means of line A116, which
Correlation coefficients (r) among the traits presumably is homozygous for the GF allele at the
1L-in the E20-A3N28 F3population QTL and homozygous for the N28 alleles at Vgt1 and
Vgt2 (Figure 5), were significantly smaller than the phe-Traits St. Paul, 1994 Rosemount, 1994 notypic means of N28 (Table 3). This apparent
contra-diction can be readily explained by interaction of
1L-DPS-ND 0.85 0.81
DPS-HT 0.86 0.82 QTL with either one or both genes of 8L. The fact that
ND-HT 0.86 0.77 the combined effect of the GF alleles at Vgt1, Vgt2,
1L-QTL, and the putative 6L-1L-QTL, present in E20-B (Figure The mean values of two replications were used for the
esti-5), was not significantly different for DPS and HT and mation of r for each location. All values of r are highly
Figure 5.—RFLP composi-tion of selected lines. The lines are listed in the same order as in Tables 3 and 4. , homozy-gous N28; h, homozygous GF; , heterozygous; , het-erozygous or homozygous GF; j, not determined. The A lines were derived from E20-A 3 N28 crosses; the C lines were derived from an E20-C3N28 cross. The dotted lines delimit the position of the two 8L-QTL as detected by QTL mapping (Figure 4) and confirmed by the data of Tables 3 and 4. As-suming that each QTL harbors a single gene we named the re-spective genes Vegetative to gen-erative transition1 and -2 (Vgt1 and Vgt2). Chromosome arms 1L and 6L are not scaled rela-tive to 8L. The scale bar refers only to 8L.
effect of the GF alleles at Vgt1 and Vgt2 alone (Table transgressive segregation for DPS, ND, and HT in the E20-A3 N28 F3 population.
3), is also suggestive of gene interaction.
The relatively large magnitude of transgressive segre- Although, when homozygous, the GF alleles at 1L-QTL and the putative 6L-1L-QTL do not lower the pheno-gation apparent for ND and HT in Figure 2 is likely
an artifact due to inadequate sampling of the parental typic values in the presence of homozygous GF alleles at Vgt1 and Vgt2 (Table 3), it is unlikely that during genotypes. However, the potential interaction(s)
be-tween 1L-QTL and either one or both genes of 8L, 20 backcrosses they had been retained by chance. The retention of the GF alleles at 1L-QTL and the putative although with a presumably small effect (see GVE values
in Table 1), could have induced a certain amount of 6L-QTL may suggest that the respective alleles have a
TABLE 3
The grouping of selected lines based on pairwise Bonferronit-tests
Trait
ND DPS HT
Linea Mean Bonb Mean Bonb Mean Bonb
N28 23.5 m 88.5 m 190.3 m
A116 22.9 m 86.0 m 175.8 m
A44-21 22.1 m 82.7 m 167.3 m m
A44-10 21.9 m 83.5 m 167.2 m m
A44-8 21.8 m 83.0 m 174.7 m
C22-6 21.0 m 79.8 m 158.7 m m
C22-4 21.0 m 80.0 m 157.2 m m
C22-1 20.7 m 80.0 m 148.5 m m
E20-B 20.0 m 77.7 m 145.7 m m
C24-1 19.4 m 78.8 m m 147.2 m
C24-2 19.4 m 79.0 m m 139.8 m m
A44-18 19.4 m 77.2 m 143.0 m m
A27 19.2 m 77.8 m 137.8 m
aThe lines are listed in the descending order of the total number of nodes (ND).
bThe grouping of lines based on Bonferroni t -tests with a comparisonwise type I error set ata 50.00064.
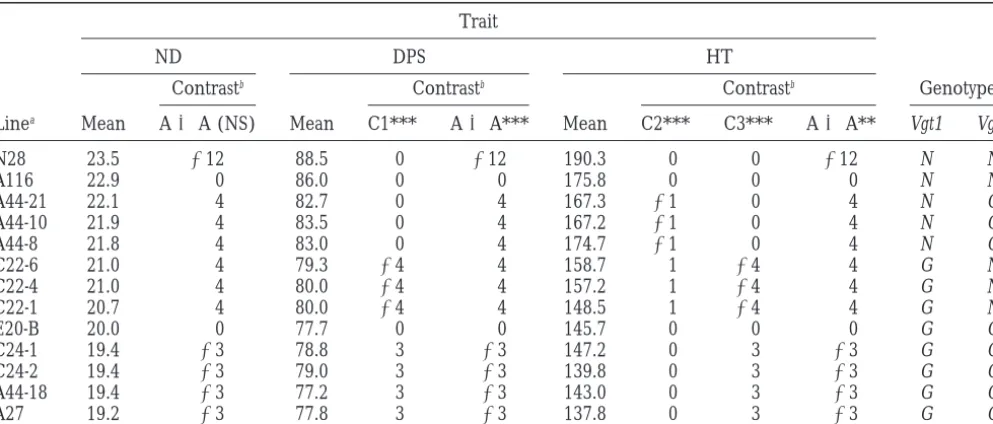
TABLE 4
Contrasts and8L-QTL genotypes of selected lines
Trait
Genotypec
ND DPS HT
Contrastb Contrastb Contrastb
Linea Mean A3A (NS) Mean C1*** A3A*** Mean C2*** C3*** A3A** Vgt1 Vgt2
N28 23.5 212 88.5 0 212 190.3 0 0 212 N N
A116 22.9 0 86.0 0 0 175.8 0 0 0 N N
A44-21 22.1 4 82.7 0 4 167.3 21 0 4 N G
A44-10 21.9 4 83.5 0 4 167.2 21 0 4 N G
A44-8 21.8 4 83.0 0 4 174.7 21 0 4 N G
C22-6 21.0 4 79.3 24 4 158.7 1 24 4 G N
C22-4 21.0 4 80.0 24 4 157.2 1 24 4 G N
C22-1 20.7 4 80.0 24 4 148.5 1 24 4 G N
E20-B 20.0 0 77.7 0 0 145.7 0 0 0 G G
C24-1 19.4 23 78.8 3 23 147.2 0 3 23 G G
C24-2 19.4 23 79.0 3 23 139.8 0 3 23 G G
A44-18 19.4 23 77.2 3 23 143.0 0 3 23 G G
A27 19.2 23 77.8 3 23 137.8 0 3 23 G G
**P,0.01; ***P,0.001; NS, not significant ata 50.0125.
aThe lines are listed in the descending order of the total number of nodes (ND).
bContrast coefficients are shown below each contrast designation; C1, C2, and C3 compare means of groups of lines (as
established by the Bonferroni grouping for ND, Table 3) not resolved by the Bonferroni grouping for DPS and HT, respectively (Table 3). A3A, additive3additive contrast (seematerials and methods).
cInferred genotypes at the two linked QTL on chromosome arm 8L, under the assumption that each QTL harbors a single
gene. The genotypes were inferred by corroborating information from Figures 4 and 5, Table 3, and this table. Vgt1, the gene with the larger effect, placed between PG7 and UMC89a; Vgt2, the gene with the smaller effect, placed between CSU66b and ZmHox1a. G, homozygosity for the GF alleles; N, homozygosity for the N28 alleles.
stronger phenotypic effect in the environments where the donor parent to semidominance toward the pheno-type of the recurrent parent. The allelic relationship at the backcrosses were conducted (Brookhaven, NY and
Salinas, CA;D. Shaver,personal communication) rela- Vgt1 and Vgt2 estimated in both E20-A3N28 and GF3 N28 F3populations (Table 1;Vla˘dut¸u1998) conforms tive to the St. Paul environment. But given the potential
interactions with Vgt1 and Vgt2, in our opinion, the most to this expectation. Also, because Vgt2 and the putative 6L-QTL map within duplicated regions (Figure 5), they probable explanation for the retention of the GF alleles
at 1L-QTL and the putative 6L-QTL could relate to the might be structurally related.
At least three of the loci (Vgt1, Vgt2, and 1L-QTL) backcross procedure itself. Because the 20 backcrosses
were never interrupted by selfing (D. Shaver,personal introgressed from GF into the background of N28 ap-pear to be involved in the transition of the apical meri-communication), the phenotypic selection always
dis-criminated between heterozygotes and homozygotes for stem from vegetative to generative structures. These findings are in agreement with previous observations the N28 alleles. Therefore, it is likely that in a
heterozy-gous condition, the 1L-QTL and the putative 6L-QTL (Brawn1968), which indicated that the extreme early maturity of GF is due to the very early timing of tassel would visibly lower DPS in the presence of
heterozygos-ity at Vgt1 and Vgt2. The reason for no significant interac- initiation rather than a fast rate of growth.
In a GF3N28 population of 91 F3families, the effects tion between the introgressed QTL, as detected by
two-factor analyses of variance in the E20-A3N28 mapping of the 1L-QTL and the putative 6L-QTL were not detect-able and the cumulative effect of Vgt1 and Vgt2 ac-population (not shown), presumably was the small size
of the population. counted for only 13% of the genetic variance for ND (Vla˘dut¸u1998). These results indicate that other loci Ignoring the complexity that may arise due to gene
interaction (epistasis), the fact that the backcrosses were are also responsible for the 12–16 node difference be-tween GF and N28.
not interrupted by selfing would also impose constraints
on the type of relationship between the alleles of the The effects of Vgt1 and Vgt2: Tassel initiation, stem elongation, and anthesis: Five to six incipient leaves (ex-donor and recurrent parents at the introgressed loci.
For QTL with moderate or large individual (nonepi- cluding the coleoptile) are usually formed in the maize embryo before it becomes dormant. The growth of the static) effects, the allelic relationship is expected to
Figure6.—Graphic representation of the mean trait values for the four homozygous genotypes at the two linked genes (Vgt1 and Vgt2) in the background of N28 (see Table 5). G
indicates homozygosity for the GF alleles; N indicates homozy- Figure7.—Morphological and phenological (as indicated gosity for the N28 alleles. Parallel lines (for ND) indicate by the development of the topmost ear) differences among additivity; nonparallel lines (for DPS and HT) indicate devia- and within the four homozygous genotypes at Vgt1 and Vgt2 tions from additivity (see also A3A contrasts in Table 4). in the background of N28. The leaves and lower ears were removed and the brace roots trimmed to illustrate the aboveground internodes. The total number of nodes (phyto-mers) and the genotype (see Table 5) are indicated below of leaf primordia are resumed soon after the onset of
each plant. The numbers on the left side of each plant indicate germination. AbbeandPhinney(1951) reported that
the phytomer bearing the topmost ear (upper number) and under field conditions, the rate of successive postembry- the first phytomer above the soil level (lower number). The onic leaf primordia initiation increased exponentially. tick marks are placed at 5-cm intervals. The plants, grown in the summer of 1998 in St. Paul, were photographed after N28 Given that in controlled environments, under constant
(NN ) had shed pollen. In comparison with 1997 (Table 5), temperature, the rate of leaf initiation is relatively
con-in 1998 the total number of nodes was similar for the NG and stant (Greyson et al. 1982; Kiniry and Bonhomme
NN genotypes but averaged about one less node for the GG 1991;LejeuneandBernier1996), the exponential in- and GN genotypes.
crease in the rate of leaf initiation noted by Abbeand Phinney(1951) likely reflects the increase in the
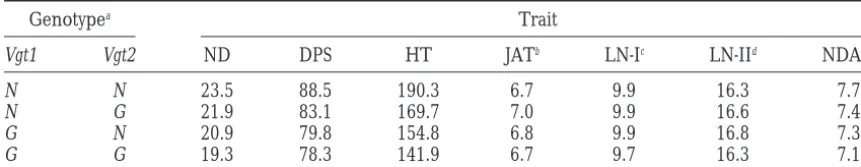
TABLE 5
Mean phenotypic values of the four homozygous genotypes at the two linked genes
Genotypea Trait
Vgt1 Vgt2 ND DPS HT JATb LN-Ic LN-IId NDAEe
N N 23.5 88.5 190.3 6.7 9.9 16.3 7.7
N G 21.9 83.1 169.7 7.0 9.9 16.6 7.4
G N 20.9 79.8 154.8 6.8 9.9 16.8 7.3
G G 19.3 78.3 141.9 6.7 9.7 16.3 7.1
The lines with GF segments in chromosome arm 1L (A116) and in 1L and 6L (E20-B) were excluded from the computations of means (see Figure 5).
aSame as in Table 4.
bThe number of the leaf on which the transition from juvenile to adult traits (occurrence of epidermal
hairs) was first apparent.
cThe number of the last leaf visible in the whorl on June 19. dThe number of the last leaf visible in the whorl on July 5. eThe number of nodes (leaves) above the topmost ear.
although at different rates (Morrisonet al. 1994). Simi- that the rate of phytomer initiation and the rate of post-transitional growth are similar for the four genotypes. lar observations were made bySharman (1942) using
Therefore, the small average difference (0.9) in DPS, a different maize genotype (Sutton’s White Horse
corresponding to one added node (phytomer) between Tooth), indicating that the stepwise elongation of the
the GN and GG genotypes (Table 6), can be taken as a stem is a common feature across different backgrounds.
rough, average estimate of the plastochrons 20 and 21 The tassel, which tips the maize stem, likely conforms
for GN, 20–22 for NG, and 20–24 for NN. This average to the same developmental rule, that is, its elongation
estimate of the last plastochrons for the three homozy-is held in check (at variable degrees depending on the
gous genotypes (GN, NG, and NN) is likely biased up-genotype) by the elongation of the internodes below.
ward for two reasons. First, the average difference in Anthesis usually occurs only after the tassel has emerged
DPS, corresponding to one added phytomer between from the whorl.
the GN and GG genotypes, should include a component While GF and its F1 hybrids with a number of Corn
representing the delay in DPS caused by the elongation Belt Dent lines (including N28) continue to elongate
of the extra phytomer. Second, considering the results the internodes and tassel peduncle after the tassel starts
ofAbbe andPhinney(1951), successive plastochrons shedding pollen, in the N28 background, irrespective
become shorter under field conditions. This average of the alleles present at Vgt1 and Vgt2, the increase in
estimate (0.9 days) of the last plastochrons can be used height occurring after the first anthers shed pollen is
to compute approximately the differences in the timing none or negligible (up to 6 cm) in the St. Paul
environ-of tassel initiation and the relative contribution environ-of in-ment (C.Vla˘dut¸u,personal observation).
ternode elongation to the delay in the timing of pollen Given the general features of shoot development
sum-shed between the homozygous genotypes at Vgt1 and marized above, the interval from planting to anthesis
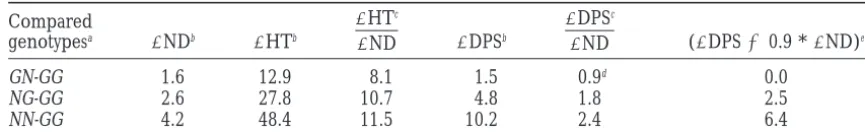
Vgt2. For example, the average delay in the timing of can be formally divided into two phases. The first phase,
pollen shed between the NN and GG genotypes is 10.2 consisting of the initiation of phytomers, encompasses
days, of which at least 6.4 days are presumably due to the interval from planting to the transition of the apical additional stem elongation caused by the extra (4.2) meristem. The second phase, characterized by stem internodes formed in the NN genotype relative to the elongation, represents the interval from tassel initiation GG genotype (Table 6). The difference of,3.8 days in to anthesis. Based on a comparative study of inbred the timing of tassel initiation between the NN and GG lines and F1 hybrids,Leng (1951) suggested that the genotypes is augmented by the growth of the additional two phases of shoot development may be under the phytomers (formed in the NN genotype relative to the control of different sets of genes. GG genotype) to a difference in the timing of anthesis
The LN-I and LN-II values (the trait acronyms are of 10.2 days.
TABLE 6
Differences between the mean phenotypic values of the homozygous genotypes at the two linked genes (St. Paul, 1997)
Compared
genotypesa DNDb DHTb
DHTc
DND DDPSb
DDPSc
DND (DDPS20.9 *DND)e
GN-GG 1.6 12.9 8.1 1.5 0.9d 0.0
NG-GG 2.6 27.8 10.7 4.8 1.8 2.5
NN-GG 4.2 48.4 11.5 10.2 2.4 6.4
aG designates homozygosity for the GF alleles; N designates homozygosity for the N28 alleles; for each
genotype, the first letter represents Vgt1 and the second letter Vgt2; the reference genotype is GG.
bDifferences in node number (ND), height (HT), and days to pollen shed (DPS); the trait means are shown
in Table 5.
cThe average increase in HT and delay in DPS corresponding to one added node (phytomer).
dBecause this value is so small, it was taken as a rough estimate of the average interval of time between the
initiation of two successive leaf primordia (starting with the interval between the 19th and 20th leaf primordia); it was used for computing the last column.
eThese values estimate the delay in DPS presumably caused only by additional internode elongation; see
discussion.
is the global extent of internode elongation, which de- types, is needed for more conclusive results in this re-gard.
pends on the total number of phytomer primordia
formed until tassel initiation. We consider that these The significant deviations from additivity for HT and timing of anthesis (DPS) can be interpreted in three inferences, although approximate, would remain valid
in principle even if one or both genes (Vgt1 and Vgt2) broad ways. First, note that by only altering the timing of tassel initiation, and thus the total number of phytom-slightly affect the rate of leaf initiation and/or the rate
of post-transitional growth. ers, particular phytomers will change their position in the stem relative to the tassel and topmost ear. Conse-The differences in the DPS and HT values (Table 3)
among lines belonging to a given group (as defined by quently, a change in the total number of phytomers would bring about changes in thickness, final length, the Bonferroni grouping for ND) could be caused by
the individual or combined effect of several factors: (1) and duration of elongation for particular internodes. Taking GG as the reference genotype, the average introgressed gene(s), other than Vgt1 and Vgt2, with
a small effect, affecting shoot development; (2) slight difference in HT and DPS, corresponding to one added node, increases as the difference in the total ND in-differences in the epigenetic state of genes involved in
post-transitional growth; and (3) experimental errors, creases (Table 6). For each genotype, seven to eight very short internodes remain underground (Figure 7). such as uneven distribution of fertilizers within the plot.
A3A contrasts: As shown in Figure 7, the maize stem Although somewhat fewer for the GG genotype, the phytomers placed between the tassel and the topmost gradually tapers from bottom to top. Along the stem,
the internodes vary in length and thickness, paralleling ear are relatively constant in number, length, and thick-ness among the four genotypes (Table 5 and Figure 7). the variation in shape and size of leaves (Greysonet al.
1982). Morrisonet al. (1994) found that the position It is the phytomers placed between the topmost ear and soil level that vary considerably in number, final length, of the internode in the stem and its function in the
plant influence its growth rate and elongation pattern. and thickness among the four genotypes (Figure 7). From the GG to the NN genotypes there is an increase in The same authors noted that for the aboveground
in-ternodes, the duration of elongation increased from the number, length, and thickness of the phytomers placed below the topmost ear (Figure 7). The progressive in-basal internodes to the internodes with subtending ears;
then it decreased for the internodes above. For in- crease in thickness of the basal internodes can be viewed as a systemic adjustment to sustain the additional vegeta-ternodes without subtending ears, the longer the
elon-gation period, the longer was the final length; the in- tive growth induced by the formation of additional phy-tomers. Also, more nodes generate brace roots in NN ternodes with subtending ears had the longest period
of elongation but their final length was shorter than relative to GG (Figure 7). Therefore, one possible inter-pretation of the significance of the A3A contrasts for that of adjacent internodes without subtending ears.
The additive behavior of the four homozygous geno- HT and DPS (Table 4 and Figure 6) is that, through systemic regulation of post-transitional shoot develop-types with respect to node number (Table 4 and Figure
6) suggests the possibility that Vgt1 and Vgt2 are involved ment, alterations in the total number of phytomers could induce nonadditive changes in HT and DPS. This in different pathways during tassel initiation. However,
regard-ing the state of activity of Vgt1 and Vgt2 durregard-ing post- role in the variation of maturity across diverse genetic backgrounds. Therefore, Vgt1 and Vgt2 are probably transitional growth.
The second possible explanation is that the two genes among the important loci in maize subjected to selec-tion in geographic regions with a short growing season. interact during post-transitional growth. However, the
8L-recombinant lines are heterogeneous in respect to Feasibility of positional cloning ofVgt1:To our knowl-edge, no maize mutant has been identified that, on the GF segments in 8L outside the intervals harboring Vgt1
and Vgt2 (Figure 5). Therefore, a third possible explana- basis of map position and phenotype, could represent a strong candidate gene for either Vgt1 or Vgt2. Knock-tion for the nonadditivity of DPS and HT would invoke
introgression of linked genes, other than Vgt1 and Vgt2, out mutations may not have been identified by chance or because they are lethal, or, due to functional redun-with a small effect, affecting shoot development.
Regard-ing this third hypothesis, note that for each genotype, dancy, the loss of function for either gene does not produce a striking phenotype in heterogeneous back-the relatively long internodes placed immediately below
the topmost ear are considerably thicker than the in- grounds. Because, in principle, it is difficult to accom-modate the directed transposon-tagging approach for ternodes above it (Figure 7). These thick internodes
would require a longer time to attain their final length isolating genes with relatively small effects in heteroge-neous backgrounds, a potentially feasible option for in comparison with the thinner internodes placed above
the topmost ear. Therefore, within a given background, isolating Vgt1 and Vgt2 is positional cloning.
To date, there has been no gene isolated through the placement of the topmost ear would affect, to a
certain extent, the timing of anthesis. Conceivably, the positional cloning in a maize YAC library. The map-based approach for cloning maize genes has been dis-lower the placement of the topmost ear (the fewer the
number of thick internodes), the earlier the timing of couraged by several features of the maize genome: large average ratio of physical/genetic distance (z1.5 Mb/ anthesis. However, with the same total number of
phy-tomers, the lines A44-18 and A27 shed pollen consis- cM; Civardi et al. 1994), large amount (60–80%) of medium and highly repetitive DNA sequences (Hake tently earlier than the lines C24-1 and C24-2 (Table
3). This fact could be attributed to differences in the andWalbot1980;Springeret al. 1994), and the rela-tive ease of cloning maize genes by transposon tagging. placement of the topmost ear, which on average was
z0.5 phytomers lower in A44-18 and A27 than in One of the strategies proposed to overcome the limita-tions imposed by the maize genome to positional clon-C24-1 and C24-2 (not shown). Given the differences in
RFLP composition between A44-18, A27 and C24-1, ing is chromosome landing (Tanksley et al. 1995). It requires flanking markers at a physical distance from C24-2 (Figure 5), a gene(s) controlling the position of
the topmost axillary bud (ear) relative to the tassel could the target gene that is less than the average insert size of the genomic library being used (Tanksleyet al. 1995). reside either around UMC124a or UMC12a. Isolation of
additional N28 derivatives from the existing 8L-recombi- Having separated the GF alleles at the two linked loci, we have laid the foundation for the positional cloning nant lines (Figure 5), with even smaller, unique GF
fragments will help clarify the phenotypic effects of of Vgt1. The additive effects of the GF allele relative to the N28 allele at Vgt-1, in the background of N28, are other genes introgressed along with Vgt1 and Vgt2.
Potential functions: With the data in hand we cannot relatively large (compare the ND, DPS, and HT values of the GN and NN genotypes in Table 5). This allows distinguish between the two ultimate, potential
func-tions of Vgt1 and Vgt2. They may act in pathways that for unambiguous inference of the allelic constitution at Vgt1 based on the phenotypic values of individuals either promote or repress the transition from vegetative
to generative growth. Both GF and N28 are considered homozygous at DNA markers closely flanking the gene. For simplicity of discussion, thus far we have assumed insensitive to photoperiod (RussellandStuber1983),
a fact that suggests that both genes are components of that each of the two linked QTL of 8L harbors a single gene (Vgt1 and Vgt2, respectively). Although the short endogenously controlled pathway(s) of tassel initiation.
Because the florally determined state is labile (Irish interval (z5 cM) delimiting the position of the major 8L-QTL (Figures 4 and 5) suggests the possibility of a and Nelson 1991; Colasanti et al. 1998), Vgt1 and
Vgt2 could be (again) expected to be expressed post- single gene (Vgt1) being present at the QTL, it does not guarantee it. For example, five genes encoding en-transitionally irrespective of the pathway in which they
act. The similarity of juvenile-adult transition ( JAT) val- zymes of the biosynthetic pathway of cyclic hydroxamic acids in maize are clustered within 6 cM on chromosome ues among the four homozygous genotypes (Table 5)
suggests that the two genes are probably not involved in arm 4S (Frey et al. 1997). The presence of two (or more) linked genes within the major 8L-QTL would the transition from juvenile to adult phases of vegetative
development. complicate their identification.
Generally, the choice of the parental material for From this and other QTL experiments (Ableret al.
1991;Kim1992;Zehret al. 1992;Koester et al. 1993; QTL studies is based upon morphological and physio-logical differences resulting from repeated cycles of nat-Kozumpliket al. 1996;Vla˘dut¸u1998) it appears that
cation and fine mapping of yield-associated QTL. Genetics 141:
linked genes underlying the phenotypic differences
1147–1162.
would always constitute a potential problem for isolating Feinberg, A. P.,andB. Vogelstein,1983 A technique for
radiola-belling DNA restriction endonuclease fragments to high specific
genes using the BDL approach. Despite the potential
activity. Anal Biochem. 132: 6–13.
presence of closely linked genes affecting the traits
in-Frey, M., P. Chomet, E. Glawisching, C. Stettner, S. Gru¨ net al., vestigated and the extensive amount of time and labor 1997 Analysis of a chemical plant defense mechanism in grasses.
Science 277: 696–699.
required to develop the BDLs, the construction of
intro-Galinat, W. C.,1959 The phytomer in relation to the floral
homolo-gression libraries, such as the one generated byEshed
gies in the American Maydeae. Bot. Mus. Leaflets, Harvard U.
andZamir(1994) in tomato, would be a useful compo- 19:1–32.
Gerdes, J. T., C. F. Behr, J. G. CoorsandW. F. Tracy,1993 Compila-nent of structural and functional genomics in any crop
tion of North American Maize Breeding Germplasm. Crop Science species.
Society of America Inc., Madison, WI.
Greyson, R. I., D. B. WaldenandW. J. Smith,1982 Leaf and stem We thank D. Shaver for providing plant material and detailed
infor-heteroblasty in Zea. Bot. Gaz. 143: 73–78. mation regarding the backcrossing procedure; B. Burr, B. Gill, S.
Hake, S.,andV. Walbot,1980 The genome of Zea mays, its organiza-Hake, T. Musket, T. Pryor, R. Tuberosa, J. Vogel, and W. Werr for
tion and homology to related grasses. Chromosoma 79: 251–270. providing DNA clones; S. Livingston, J. Suresh, R. Schierman, and C.
Hallauer, A. R.,andJ. B. Miranda,1988 Quantitative Genetics in
Castell for technical help; S. Salvi for technical help and discussions; Maize Breeding, Ed. 2. Iowa University Press, Ames, IA. J. Doebley, R. Shaw, M. Olsen, and two anonymous reviewers for Hartley, H. O.,1950 The maximum F-ratio as a short-cut test for comments or discussions. This research was supported in part by the heterogeneity of variance. Biometrika 37: 308–312.
U.S. Department of Agriculture–National Research Initiative grant Irish, E. E.,andT. M. Nelson, 1991 Identification of multiple stages in the conversion of maize meristems from vegetative to floral number 92-37300-7524 and Northrup King Inc. This article is
publica-development. Development 112: 891–898. tion number 98-1-13-0090 of the Minnesota Agricultural Research
Jansen, R. C.,1993 Interval mapping of multiple quantitative trait Station.
loci. Genetics 135: 205–211.
Kiesselbach, T. A.,1949 The structure and reproduction of corn. University of Nebraska Press, Lincoln, NE.
Kim, T. S.,1992 Identification of genomic regions controlling
matu-LITERATURE CITED rity in maize (Zea mays L.). Ph.D. Thesis, University of Minnesota, St. Paul, MN.
Abbe, E. C.,andB. O. Phinney,1951 The growth of the shoot apex Kiniry, J. R.,andR. Bonhomme,1991 Predicting maize phenology, in maize: external features. Am. J. Bot. 38: 737–744.
pp. 115–131 in Predicting Crop Phenology, edited byT. Hodges. Abler, B. S. B., M. D. EdwardsandC. W. Stuber,1991 Isoenzymatic CRC Press, Boca Raton, FL.
identification of quantitative trait loci in crosses of elite maize Knapp, S. J.,1994 Mapping quantitative trait loci, pp. 58–96 in DNA-inbreds. Crop Sci. 31: 267–274. Based Markers in Plants, edited byR. L. PhillipsandI. K. Vasil.
Alpert, K. B.,andS. D. Tanksley,1996 High-resolution mapping Kluwer Academic Publishers, Dordrecht, The Netherlands. and isolation of a yeast artificial chromosome contig containing Knapp, S. J., W. W. StroupandW. M. Ross,1985 Exact confidence
fw2.2: a major fruit weight quantitative trait locus in tomato. Proc. intervals for heritability on a progeny mean basis. Crop Sci. 25:
Natl. Acad. Sci. USA 93: 15503–15507. 192–194.
Alpert, K. B., S. GrandilloandS. D. Tanksley,1995 fw 2.2: a Koester, R. P., P. H. SiscoandC. W. Stuber,1993 Identification
major QTL controlling fruit weight is common to both red- and of quantitative trait loci controlling days to flowering and plant green-fruited tomato species. Theor. Appl. Genet. 91: 994–1000. height in two near isogenic lines of maize. Crop Sci. 33: 1209–
Askenasy, E.,1880 Ueber eine neue Methode, um die Vertheilung 1216.
der Wachstumsintensita¨t in wachsenden Theilen zu bestimmen. Kozumplik, V., I. Pejic, L. Senior, R. Pavilna, G. Grahamet al., Verhandl. Naturhist.-Medic. Ver. Heidelberg. N.F. 2: 70–153. 1996 Use of molecular markers for QTL detection in
segregat-Basten, C. J., B. S. WeirandZ. B. Zeng,1995–1996 QTL CARTOG- ing maize populations derived from exotic germplasm. Maydica RAPHER: A Reference Manual and Tutorial for QTL Mapping. Depart- 41:211–217.
ment of Statistics, North Carolina State University, Raleigh, NC. Lejeune, P.,andG. Bernier,1996 Effect of environment on the
Brawn, R. I.,1968 Breeding corn for earliness. Proc. Annu. Corn early steps of ear initiation in maize (Zea mays L.). Plant Cell Sorghum Res. Conf. 23: 59–66. Environ. 19: 217–224.
Civardi, L., Y. Xia, K. J. Edwards, P. S. SchnableandB. J. Nikolau, Leng, E. R.,1951 Time relationships in tassel development in inbred
1994 The relationship between genetic and physical distances and hybrid corn. Agron. J. 43: 445–449.
in the cloned a1-sh2 interval of the Zea mays L. genome. Proc. Lincoln, S., M. DalyandE. Lander,1992 Constructing Genetic Maps Natl. Acad. Sci. USA 91: 8268–8272. with MAPMAKER/EXP 3.0, Ed. 3. Whitehead Institute Technical
Coe, E. H., G. Davis, M. McMullenandM. Polacco,1995 RFLP Report, Cambridge, MA.
and genetic maps. Maize Genet. Coop. Newsl. 69: 247–256. Matz, E. C., F. A. BurrandB. Burr,1995 Molecular map based
Colasanti, J., Z. YuanandV. Sundaresan,1998 The indeterminate on T3CM and Co3Tx recombinant inbred families. Maize gene encodes a zinc finger protein and regulates a leaf-generated Genet. Coop. Newsl. 69: 257–267.
signal required for the transition to flowering in maize. Cell 93: Miller, R. G. Jr., 1981 Simultaneous Statistical Inference.
Springer-593–603. Verlag, New York.
Doebley, J.,andA. Stec,1993 Inheritance of the morphological Morrison, T. A., J. R. Kessler andD. R. Buxton, 1994 Maize differences between maize and teosinte: comparisons of results internode elongation patterns. Crop Sci. 34: 1055–1060. for two F2populations. Genetics 134: 559–570. Naveira, H.,andA. Barbadilla,1992 The theoretical distribution Doebley, J., A. StecandC. Gustus, 1995 teosinte branched1 and of lengths of intact chromosome segments around a locus held the origin of maize: evidence for epistasis and the evolution of heterozygous with backcrossing in a diploid species. Genetics dominance. Genetics 141: 333–346. 130:205–209.
Doerge, R. W.,andG. A. Churchill,1996 Permutation tests for Robertson, D. S., 1985 A possible technique for isolating genic multiple loci affecting a quantitative character. Genetics 142: DNA for quantitative traits in plants. J. Theor. Biol. 117: 1–10. 285–294. Russell, W. K.,andC. W. Stuber,1983 Effects of photoperiod and
Eshed, Y.,and D. Zamir,1994 A genomic library of Lycopersicon temperatures on the duration of vegetative growth in maize. Crop
pennelli in L. esculentum: a tool for fine mapping of genes. Euphy- Sci. 23: 847–850.
tica 79: 175–179. Sachs, R. M.,1965 Stem elongation. Annu. Rev. Plant Physiol. 16:
Eshed, Y.,andD. Zamir,1995 An introgression line population of 73–97.
Saghai-Maroof, M. A., K. M. Soliman, R. Jorgenson and R. A.
identifi-Allard, 1984 Ribosomal DNA spacer length polymorphisms landing: a paradigm for map-based gene cloning in plants with large genomes. Trends Genet. 11: 63–68.
in barley: Mendelian inheritance, chromosomal location, and
Utz, H. F.,andA. E. Melchinger,1996 PLABQTL: a program for population dynamics. Proc. Natl. Acad. Sci. USA 81: 8014–8018.
composite interval mapping of QTL. J. Quant. Trait Loci, http://
Sambrook, J., E. F. FritschandT. Maniatis,1989 Molecular
Clon-probe .nalusda . gov:8000 /otherdocs /jqtl /jqtl1996-01/utz.html
ing: A Laboratory Manual. Cold Spring Harbor Laboratory Press,
(verified 10 Sept. 1999). Cold Spring Harbor, NY.
Vla˘dut¸u, C. I.,1998 Fine mapping and characterization of linked
SAS Institute,1994 Introductory Guide for Personal Computer, Version
QTL involved in the transition of the maize apical meristem from
6.01 Edition. SAS Institute, Cary, NC.
vegetative to generative structures. Ph.D. Thesis, University of
Shapiro, S. S.,andM. B. Wilk,1965 An analysis of variance test
Minnesota, St. Paul, MN. for normality (complete samples). Biometrika 52: 591–611.
Wehrhahn, C.,andR. W. Allard,1965 The detection and
mea-Sharman, B. C.,1942 Developmental anatomy of the shoot of Zea
surement of the effects of individual genes involved in the
inheri-mays L. Ann. Bot. (N. S.) 6: 245–282.
tance of a quantitative trait in wheat. Genetics 51: 109–119.
Springer, P. S., K. J. EdwardsandJ. L. Bennetzen,1994 DNA
Zehr, B. E., J. W. Dudley, J. Chojecki, M. A. Saghai-Maroofand class organization on maize Adh1 yeast artificial chromosomes.
R. P. Mowers,1992 Use of RFLP markers to search for alleles Proc. Natl. Acad. Sci. USA. 91: 863–867. in a maize population for improvement of an elite hybrid. Theor.
Steel, R. G. D.,andJ. H. Torrie,1980 Principles and Procedures of Appl. Genet. 83: 903–911.
Statistics: A Biometrical Approach, Ed. 2. McGraw-Hill, New York. Zeng, Z-B.,1994 Theoretical basis for separation of multiple linked
Suiter, K. A., J. F. Wendeland J. S. Case, 1983 LINKAGE-1: a gene effects in mapping quantitative trait loci. Proc. Natl. Acad. Pascal computer program for the detection and analysis of genetic Sci. USA. 90: 10972–10976.
linkage. J. Hered. 74: 203–204.