Three Correlates of the Typological Frequency of Quantity-Insensitive
Stress Systems
Max Bane and Jason Riggle Department of Linguistics
University of Chicago Chicago, IL 60637, USA
[email protected],[email protected]
Abstract
We examine the typology of quantity-insensitive (QI) stress systems and ask to what extent an existing optimality theoretic model of QI stress can predict the observed typolog-ical frequencies of stress patterns. We find three significant correlates of pattern attesta-tion and frequency: the trigram entropy of a pattern, the degree to which it is “confusable” with other patterns predicted by the model, and the number of constraint rankings that specify the pattern.
1 Introduction
A remarkable characteristic of human language is that the typological distribution of many linguis-tic properties is extremely uneven. For example, Maddieson’s (1984) survey of phonemic inventories finds that a total of 921 distinct sounds are used by a sample of 451 languages, yet the average language employs only about 30 of those. Furthermore, some sounds are so commonly attested as to be almost uni-versal (e.g., /m/, /k/), while others are vanishingly
rare (/K/, /œ/). Heinz (2007) combines two
pre-vious typologies of accentual stress (Bailey, 1995; Gordon, 2002), and finds that among a sample of 306 languages with quantity-insensitive (QI) stress
systems, 26 distinct stress patterns are found,1while
over 60% of the languages surveyed use one of just 3 of these patterns. If we begin to look at morphosyn-tactic or semantic properties, the combinatorics of
1
These figures include only those quantity-insensitive stress patterns according to which there is exactly one possible assign-ment of stress per word length in syllables.
possible systems veritably explodes, leaving each at-tested language with an even smaller slice of the log-ical possibilities.
Most typological studies have attempted to give accounts of linguistic phenomena that simultane-ously:
• predict as many attested languages or patterns
as possible, and
• predict as few unattested languages or patterns
as possible.
We will refer to this goal as the “inclusion-exclusion” criterion of a linguistic model. Com-paratively few attempts have been made to explain
or predict the relative frequencies with which
lan-guages or patterns are observed to occur in cross-linguistic samples (though see Liljencrants and Lindblom 1972, de Boer 2000, Moreton to appear, and others for work proceeding in this direction).
This paper examines the typology of QI stress systems, as reported by Heinz (2007), and asks to what extent an existing optimality theoretic (Prince and Smolensky, 1993) model of QI stress, developed by Gordon (2002) to meet the inclusion-exclusion criterion, can predict the observed typological fre-quencies of stress patterns. Gordon’s model pre-dicts a total of 152 possible stress patterns, which, as far as we are aware, represent the current best at-tempt at satisfying the inclusion-exclusion criterion for QI stress, failing to generate only two attested stress patterns (unknown to Gordon at the time), and generating 128 unattested patterns. We show that Gordon’s model can offer at least three novel, sta-tistically significant predictors of which of the 152 generated patterns are actually attested, and of the
cross-linguistic frequencies of the attested patterns. Namely:
i. Of the 152 stress patterns predicted by Gor-don’s model, the attested and frequent ones ex-hibit significantly lower trigram entropy than the unattested and infrequent,
ii. the length of forms, in syllables, that must be observed to uniquely identify a stress pattern is significantly lower for the attested patterns than for the unattested, and
iii. the number of constraint rankings in Gordon’s model that are consistent with a stress pattern is a significant predictor both of which patterns are attested and of the relative frequencies of the attested patterns.
In what follows, Section 2 presents an overview of the basic theoretical background and empirical facts of quantity-insensitive stress that guide this study, including a review of Heinz’s (2007) typology and a description of Gordon’s (2002) OT model. Section 3 then introduces the three proposed correlates of at-testedness and frequency that can be applied to Gor-don’s framework, together with statistical analyses of their significance as predictors. Finally, Section 4 offers a discussion of the interpretation of these find-ings, as well as some concluding remarks.
2 Quantity-Insensitive Stress Patterns
2.1 Assumptions and Definitions
We will follow Gordon (2002) and Heinz (2007) in taking a stress system to be any accentual system that satisfies “culminativity” in the sense of Prince (1983); that is, any accentual system in which there is always one most prominent accentual unit per ac-centual domain. In this case, we assume that the accentual unit is the syllable, and that the domain is the prosodic word. Thus, any given syllable of a word may bear primary, secondary, or no stress (we ignore the possibility of tertiary or other stress), but there must always be exactly one primary stressed syllable per word.
We further restrict our attention in this study to quantity-insensitive (QI) stress systems, which are those stress systems according to which the assign-ment of stresses to a word’s syllables depends only
n Albanian Malakmalak
2 σσ´ σσ´
3 σσσ´ σσσ´
4 σσσσ´ σσ´ σσ`
5 σσσσσ´ σσσ´ σσ`
[image:2.612.362.485.57.138.2]6 σσσσσσ´ σσ´ σσ` `σσ
Table 1: The stress assignments ofn-syllable words for
2 ≤ n ≤ 6 in the QI stress patterns of Albanian and Malakmalak.
on the number of syllables present (a quantity as-sumed to be fixed when stress is assigned), and not on the segmental contents of the syllables. We will refer to “stress systems” and “stress patterns” inter-changeably.
As two concrete examples of QI stress systems, consider those of Albanian (Chafe, 1977; also shared by many other languages) and Malakmalak (an Australian language; Birk, 1976). These pat-terns are illustrated in Table 1 for words of length
two through six syllables.2 The former is a simple
fixed system in which primary stress is always lo-cated on the penultimate syllable, while no other syl-lable bears stress. The latter is rather more complex, requiring stress on even numbered syllables from the right, the leftmost being primary. Crucially, neither system is sensitive to notions like syllabic weight, nor to any other properties of the syllables’ contents. Formally, one can consider a QI stress pattern up
to lengthn(in syllables), Pn, to be a set of strings
over the alphabetΣ ={σ,σ,` σ}´ :
(1) Pn={w2, . . . , wn},
where eachwi encodes the locations of stress in a
word ofisyllables, satisfying:
(2) |wi|=i, wi ∈Σ∗, and
wi containsσ´exactly once.
Thus for a given maximum number of syllablesn,
there are
n
Y
i=2
i2(i−1) =n!·2n(n2−1)
2
L076 L118 L004 L132 L110 L044 L008 L022 L143 L065 L054 L095 L040 L077 L071 L033 L113 L037 LXX1 L047 L042 L089 LXX2 LXX3 L082 L084
0.00
0.05
0.10
0.15
0.20
0.25
Frequencies of Attested Stress Patterns
Stress Pattern
[image:3.612.75.516.75.204.2]Frequency
Figure 1: Frequency of attestation of each of the 26 distinct stress patterns. Error bars indicate standard Poisson sampling error.
logically possible QI stress patterns. We will fol-low Gordon (2002) by imposing a maximum word length of 8 syllables for purposes of distinguishing one stress pattern from another in the typology, and of determining the set of distinct patterns predicted by the model. We are therefore dealing with a
uni-verse of 8!228 =10,823,317,585,920 theoretically
possible stress systems.
2.2 The Typology
The typological data on which this study is based are due to Heinz (2007), who has made them freely
available.3 This database is a combination of
• that from Bailey (1995), itself gathered from
Halle and Vergnaud (1987) and Hayes (1995), and
• the collection put together by Gordon (2002)
from previous surveys by Hyman (1977) and Hayes (1980), as well as from additional source grammars.
The combined database is intended to be fairly ex-haustive, sampling a total of 422 genetically and ge-ographically diverse languages with stress systems.
Of those 422 languages, 318 are identified as pos-sessing quantity-insensitive stress, and we further confine our attention to the 306 of those with sys-tems that uniquely determine the stress of each word as a function of syllable-count (i.e., with no option-ality). We should note that it is possible for one
lan-3The typology is available as a MySQL database at http://www.ling.udel.edu/heinz/diss/
● ● ●
● ● ● ●
● ● ●
● ●
● ●
● ●
● ●
● ●
● ●
●
● ● ●
0 5 10 15 20 25
0.00
0.05
0.10
0.15
0.20
0.25
Zipf Fit of Frequency−Rank vs Frequency of Attested Stress Patterns
Frequency Rank
Frequency
Fitted zipf distribution 95% Confidence interval of fit Fitted zipf distribution 95% Confidence interval of fit
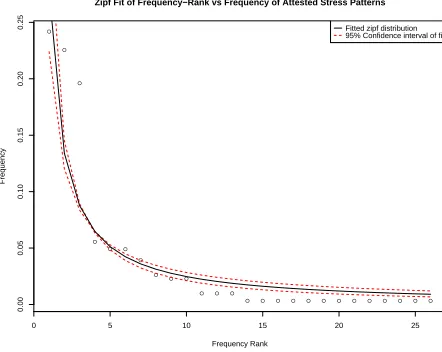
Figure 2: Regressed Zipf distribution of stress pattern fre-quencies; Zipf’s exponent is found to be1.05±0.15at 95% confidence.
guage to contribute more than one distinct stress pat-tern to our dataset, as in the case of Lenakel (Lynch, 1974), for instance, which employs one regular pat-tern for nouns and another for verbs and adjectives.
Between these 306 languages, we find a total of 26 distinct QI stress systems, which is quite a bit fewer than expected by chance, given the
sam-ple size and the 10.8 trilliona priori possible
sys-tems. Figure 1 shows the frequency with which
each pattern is attested, arranged in decreasing order of frequency. The distribution of patterns is essen-tially Zipfian; a nonlinear regression of the frequen-cies against Zipf’s law (using the Gauss-Newton
method) achieves strong statistical significance (p <
[image:3.612.315.536.268.444.2]Constraint(s) Penalizes. . .
ALIGNEDGE each edge of the word with no stress.
ALIGN({`σ,σ}´ , L/R) each (primary or secondary) stressed syllable for each other (stressed or
un-stressed) syllable between it and the left/right edge.
ALIGN(σ´, L/R) each primary stressed syllable for each secondary stressed syllable between it and
the left/right edge.
NONFINALITY the last syllable if it is stressed.
*LAPSE each adjacent pair of unstressed syllables.
*CLASH each adjacent pair of stressed syllables.
*EXTLAPSE each occurrence of three consecutive unstressed syllables.
*LAPSELEFT/RIGHT the left/right-most syllable if more than one unstressed syllable separates it from
the left/right edge.
*EXTLAPSERIGHT the right-most syllable if more than two unstressed syllables separate it from the
right edge.
Table 2: Gordon’s (2002) constraint set.
frequency (Figure 2).
The top three most common patterns, together ac-counting for over 60% of the sampled languages, are all simple fixed primary stress systems: fixed final stress (24.2% of systems), fixed initial stress (22.5% of systems), and fixed penultimate stress (19.6% of systems). It is possible that fixed primary systems may be somewhat overrepresented, as the descrip-tive sources can be expected to occasionally fail to report the presence of secondary stress; even so, the preponderance of such systems would seem to be substantial. The great majority of distinctly attested systems are quite rare, the median frequency being 0.65% of sampled languages. Some examples of cross-linguistically unlikely patterns include that of Georgian, with antepenultimate primary stress and initial secondary stress, and that of Ic¸u˜a Tupi, which shows penultimate primary stress in words of four or fewer syllables, but antepenultimate stress in longer words.
There is some reason to believe that this sample is fairly representative of the whole population of QI stress patterns used by the world’s languages. While it is true that the majority of sampled patterns are rare, it is by no means the case that the majority
of sampled languages exhibit rare stress patterns.
In fact, of the N = 306 sampled languages, just
n1 = 13 of them present stress patterns that are
attested only once. Thus, according to the com-monly used Good-Turing estimate (a distribution-free method of estimating type frequencies in a
pop-ulation from a sample of tokens; Good, 1953), we
should expect to reserve approximately n1
N = 4.3%
of total probability-mass (or frequency-mass) for un-seen stress patterns. In other words, we would be surprised to find that the actual population of
lan-guages contains much more than1−Nn1
N
= 27.15
dis-tinct patterns, i.e., about one more than found in this sample.
2.3 Gordon’s (2002) Model
Gordon (2002) has developed an optimality theo-retic model of QI stress with the goal of satisfying the inclusion-exclusion criterion on an earlier subset of Heinz’s (2007) typology. The model is footless, consisting of twelve constraints stated in terms of a metrical grid, without reference to feet or other met-rical groupings (or, equivalently, simply in terms of
linear{σ,σ,` σ}´ -sequences). The twelve constraints
are summarized in Table 2.
In addition to these, Gordon’s model imple-ments a sort of “meta-constraint” on rankings: he assumes that one of the primary alignment
con-straints ALIGN(σ´, L/R) is always lowest ranked,
so that in any given tableau either ALIGN(σ´, L) or
ALIGN(σ´, R) is “active,” but never both. Formally,
we take this to mean that the model specifies two
EVALS: an EVAL-L with ALIGN(σ´, R) excluded
from CON, and an EVAL-R with ALIGN(σ´, L)
ex-cluded. The set of stress systems predicted by the whole model is then simply the union of the systems
restriction is meant to capture the probably univer-sal generalization that primary stress always appears either to the left or right of the secondary stresses in a word, without vacillating from side to side for different word lengths. Gordon also assumes that candidate forms violating culminativity (i.e., forms without exactly one primary stressed syllable), are always excluded, either by some filter on the output
of GENor by an always highly ranked CULMINATE
constraint against them.4
Gordon’s model is capable of representing 2 ·
11! = 79,833,600 QI stress grammars (11!
rank-ings of the constraints associated with EVAL-L plus
the 11! rankings for EVAL-R). We replicated
Gor-don’s (2002) calculation of the factorial typology of distinct QI stress patterns that this grammar space predicts by implementing the constraints as
finite-state transducers,5composing the appropriate
com-binations of these to produce finite-state
implemen-tations of EVAL-L and EVAL-R, respectively (see
Riggle, 2004), and iteratively constructing consis-tent subsets of the members of the cross-products of candidate forms for each word length (two through
eight syllables). See Riggleet al(2007) and Prince
(2002) for the mathematical and algorithmic details. The factorial typology of stress systems that is yielded agrees with that reported by Gordon (2002). The model predicts a total of 152 distinct possible
systems. All but two of the 26 systems attested
in Heinz’s (2007) database are among these. The two patterns that Gordon’s model fails to generate are those of Bhojpuri (as described by Tiwari, 1960; Shukla, 1981), and Ic¸u˜a Tupi (Abrahamson, 1968). Both of these patterns were unknown to Gordon at the time he proposed his model, and each is attested only once in the typology.
In addition to failing to generate two of the at-tested stress systems, Gordon’s model also predicts
4
We follow Gordon in remaining agnostic on this point, as the same set of possible stress patterns results from either im-plementation.
5
The reader may notice that the ALIGN(σ, L/R) and´
ALIGN({σ,` σ´}, L/R) constraints (defined in Table 2) involve a kind of counting that cannot generally be accomplished by finite-state transducers. This is perhaps a theoretically unde-sirable property of Gordon’s model (see Heinzet al(2005) for such a critique), but in any case, this general problem does not affect us here, as we ignore the possibility of words any longer than eight syllables (following Gordon; see Section 2.1).
● ● ●
● ●
● ● ●
● ● ●
●
● ● ● ● ●
Attested Unattested
0.5
0.6
0.7
0.8
0.9
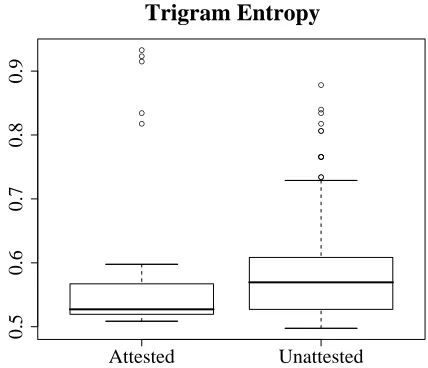
[image:5.612.321.535.65.249.2]Trigram Entropy
Figure 3: Trigram entropy (average bits per symbol) of attested versus unattested stress patterns; attested patterns have significantly lower entropy.
128 patterns that are unattested. Gordon (2002) ar-gues that a certain amount of overgeneration is to be expected of any model, since the majority of distinct attested systems are extremely rare; thus failure to observe a pattern in a limited sample is not strong evidence that the pattern is impossi-ble. The Good-Turing estimate of unseen patterns (Section 2.2 above), however, suggests that signifi-cantly less overgeneration may still be desired. Gor-don also argues that the overgenerated patterns are not pathologically different from the sorts of pat-terns that we do see (though Section 3 below de-scribes several statistically detectable differences). In any case, Gordon’s model of QI stress is among the most explicitly formulated approaches currently available, and offers a comparatively “tight” fit to the typological data.
3 Predicting Typological Frequency
3.1 k-gram Entropy
(a) (b)
● ● ● ● ●
● ●
●
● ●
●
●
● ●
●● ●
●
● ●
● ● ●
●
● ●
0.00 0.05 0.10 0.15 0.20 0.25
0.5
0.6
0.7
0.8
0.9
Frequency vs Trigram Entropy
Typological Frequency of Pattern
Trigram Entropy (bits/symbol)
●
high low
0.5
0.6
0.7
0.8
0.9
Trigram Entropy
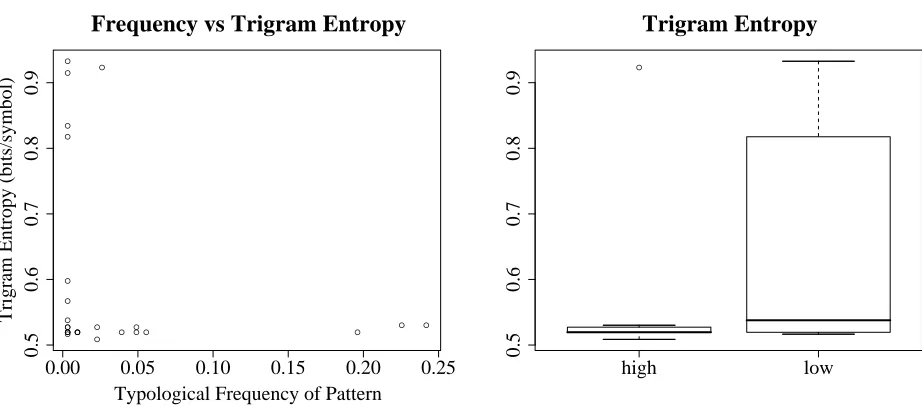
Figure 4: (a) typological frequency of attested stress patterns versus their trigram entropy, and (b) the trigram entropy of high-frequency (above median) patterns versus low-frequency (below median) patterns.
greater simplicity (according to some metric) than those that are rarer. One also expects, according to this hypothesis, that among the set of patterns pre-dicted by a linguistic model such as Gordon’s, the simpler ones should have a greater chance of attes-tation in typological samples. We find evidence con-sistent with both of these expectations in the case of QI stress systems, according to at least one informa-tion theoretic definiinforma-tion of complexity.
In order to calculate measures of complexity for each attested and predicted stress pattern, we con-struct bigram and trigram models of the
transi-tion probabilities between syllable types (σ,`σ,σ´) in
forms of two through eight syllables for each pat-tern. That is, if each stress is taken to be a set of
forms as in (1) (withn= 8in this case), satisfying
(2), then across all forms (i.e., word-lengths) one can
count the number of occurrences of each k-length
sequence (k-gram) of σ,`σ,σ´ and word boundaries
to arrive at conditional probabilities for each sylla-ble type (or a word boundary) given the previous
k−1syllables. With these probabilities one can then
compute the Shannon entropy of the stress pattern as an index of its complexity; this is interpreted as the number of bits needed to describe the pattern (i.e., list its forms) under an efficient encoding, given the
k-gram probability model. Stress patterns in which
it is difficult to accurately predict the value of a
syl-lable on the basis of the previousk−1syllables will
possess greater entropy, and thus be deemed more complex, than those in which such predictions can be made with greater accuracy.
We find that in the case of a bigram probability
model (k= 2), the attested stress systems predicted
by Gordon’s model do not differ in entropy
signifi-cantly6 from those that are unattested; we also find
no significant correlation between bigram entropy and the typological frequency of attested systems.
Under a trigram probability model (k= 3),
how-ever, entropy is a significant predictor of both whether a system is attested, and if it is attested, of its frequency in the sample. Figure 3 gives box-plots comparing the distribution of trigram entropy for those systems predicted by Gordon’s model (plus the two unpredicted systems) that are attested ver-sus those that are unattested. The attested QI stress systems are significantly less entropic than the
unat-tested, according to a two-sided Mann-WhitneyU
-test: U = 1196, p = 0.021(if the two unpredicted
patterns are excluded, thenU = 923.5, p <0.01).
Among attested systems, trigram entropy appears to bear a nonlinear relationship to typological
[image:6.612.78.539.73.276.2]quency (see Figure 4). A significant linear correla-tion does not exist, and the 13 attested patterns with greater than median frequency have only mildly sig-nificantly lower entropy than the 13 with less than median frequency (according to another two-sided
U-test: U = 51.5, p = 0.0856); if, however,
the single high-frequency pattern with outlying en-tropy is excluded (the lone point indicated in Fig-ure 4b), then the difference is more robustly
signifi-cant: U = 39.5, p = 0.0323. Interestingly, the
en-tropies of the above-median patterns are tightly con-strained to a narrow band of values (variance 0.012 square bits/symbol), whereas the below-median pat-terns show much greater variation in their complex-ity (variance 0.028 square bits/symbol).
3.2 Confusability Vectors
The second metric we examine is motivated by con-siderations of learnability. Some QI stress patterns are very similar to each other in the sense that one must observe fairly long forms (i.e., forms with many syllables) in order to distinguish them from each other. For instance, in the case of Albanian and Malakmalak (Table 1 above), the two systems give identical stress assignments for words of two or three syllables; to tell them apart, one must com-pare words with four or more syllables. The de-gree of similarity, or “confusability” in this sense, between stress systems varies considerably for dif-ferent pairs of languages. Assuming a tendency for short words to be encountered more frequently by language learners than long words, we might ex-pect stress patterns that are easily identified at short word-lengths to be more faithfully acquired than those requiring longer observations for unambigu-ous identification. In particular, if we take the 152 patterns predicted by Gordon’s model to constitute the set of possible QI stress systems, then we hy-pothesize that those patterns that stand out as unique at shorter lengths should be more typologically “sta-ble”: more likely to be attested, more frequently at-tested, or both.
To test this, we determine a confusability vector
for each predicted pattern. This is simply a tuple of
7 integers in which the value of the ith component
indicates how many of the other 151 predicted pat-terns the given pattern agrees with on forms of two
throughi+1 syllables. For example, the
confusabil-● ● ● ● ● ●
Attested Unattested
3
4
5
6
7
8
[image:7.612.323.536.61.250.2]Syllable−Count for Unique Identification
Figure 5: Attested stress patterns have significantly lower pivots than unattested ones.
ity vector of Albanian’s (fixed penultimate primary; see Table 1) stress pattern is:
h101,39,10,0,0,0,0i
This means that for words of two syllables, this stress system agrees with 101 of the other predicted systems, for words of two through three syllables it agrees with 39, and for two through four syllables it agrees with 10. Once words of five or more syllables are included in the comparison, it is unique among the stress patterns predicted, confusable with none.
A confusability vector allows us to calculate two
quantities for a given stress pattern: its
confusabil-ity sum, which is just the sum of all the components
of the vector, and aconfusability pivot, which is the
numberisuch that the(i−1)th component7 of the
vector is the first component with value 0. Thus the confusability sum of the fixed penultimate primary
stress system is101+39+10 = 150, and its
confus-ability pivot is 5, indicating that it achieves unique-ness among Gordon’s predicted systems at five syl-lables.
We find that those of the predicted systems that are typologically attested have very significantly lower confusability pivots than the unattested
sys-tems (see Figure 5; Mann-Whitney U-test: U =
1005.5, p < 0.001). One might wonder whether
this is simply due to the fact that primary-only stress
7
systems are most likely to be attested, and that such systems are independently expected to have lower confusability pivots than those with secondary stress (indeed, a two-sided Mann-Whitney test indicates that the pivots of primary-only systems are
signifi-cantly lower: U = 214, p < 0.01). However, it
appears that confusability pivots are in fact indepen-dently robust predictors of attestedness. When only the predicted patterns with secondary stress are con-sidered, the pivots of the attested ones remain signif-icantly lower than those of the unattested, albeit by
a smaller margin (U = 846, p = 0.027).
Confus-ability sums, on the other hand, are not significant predictors of attestedness in either case.
Neither pivots nor sums alone correlate well with the typological frequency of attested systems, but to-gether they can predict approximately 27% of the variance in frequencies; a multilinear regression of the form
f(x) =α+βs(x) +γp(x),
wheref(x),s(x), andp(x)are the frequency,
con-fusability sum, and pivot of patternx, respectively,
yields significant (p < 0.05) values for all
coeffi-cients (R2 = 0.271).
3.3 Ranking Volume
The two typological predictors discussed above (en-tropy and confusability) are only weakly “post-theoretical” in the sense that, while they depend on a set of predicted stress patterns according to some linguistic theory or model (such as Gordon’s), they can be computed without reference to the particular form of the model. In contrast, the third and last cor-relate that we consider is entirely specified and mo-tivated by the optimality theoretic form of Gordon’s model.
We define the ranking volume, or r-volume, of
a language generated by an optimality theoretic model as the number of total constraint orderings
(i.e., grammars) that specify the language.
Rig-gle (2008) describes a method of applying the logic of Prince’s (2002) elementary ranking conditions to compute this quantity. Using this method, we find that the number of rankings of Gordon’s constraints that are consistent with a stress pattern predicted by his model is a significant correlate of attestedness,
● ●
Attested Unattested
10
11
12
13
14
15
16
[image:8.612.329.529.71.264.2]log(r−volume)
Figure 6: Of the predicted stress patterns, those that are attested are consistent with significantly more constraint-rankings. The natural logarithms ofr-volume are shown here for greater ease of comparison.
and if the pattern is attested, of its typological fre-quency. In the case of Gordon’s model, with its
ranking meta-constraint and bifurcated EVAL(as
de-scribed in Section 2.3), the total r-volume of each
pattern is actually the sum of two quantities: the
pat-tern’sr-volume under the 11 constraints
correspond-ing to EVAL-L (which excludes ALIGN(´σ, R)), and
its r-volume under the 11 constraints of EVAL-R
(which conversely excludes ALIGN(σ´, R)). Most of
the predicted patterns are only generated by one of
the EVALS, but some can be specified by either
con-straint set, and thus will tend to be consistent with
more rankings. It just so happens that Gordon’s
choice of constraints ensures that these doubly gen-erated patterns are of precisely the same sort that are typologically most frequent: fixed primary stress systems. This appears to account for much of the
predictive power ofr-volume in this model.
The distribution ofr-volume among the 152
pre-dicted stress patterns is almost perfectly Zipfian.
A nonlinear Gauss-Newton regression ofr-volumes
against Zipf’s law finds a highly significant fit (with
Zipf’s exponent = 0.976±0.02, p < 0.001) that
accounts for 96.8% of the variance. The attested
patterns tend to have significantly greaterr-volumes
than those unattested; two-sided Mann-Whitney’s
aver-11 12 13 14 15 16
0.00
0.05
0.10
0.15
0.20
log(r−volume) vs Frequency
log(r−volume)
Pattern Frequency
● ● ●
●
● ●
●
● ●
●
●
●
●
● ● ●
●
● ●
●
●
● ●
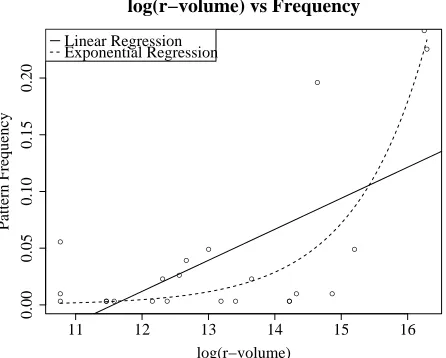
[image:9.612.73.296.67.246.2]Linear Regression Exponential Regression
Figure 7: Linear and exponential regressions of typologi-cal frequency as a function of the natural logarithm of the pattern’sr-volume.
age, the attested stress patterns are consistent with 1,586,437 rankings each, versus 299,118.1 rankings for the unattested ones.
Furthermore, the frequency of attested patterns
has a strong linear correlation withr-volume:R2=
0.7236, p < 0.001. However, a linear
rela-tion is probably not appropriate, as a normal Q-Q plot of the residuals of the regression indicates an upper-quartile deviation from linearity, and Cook’s distance metric indicates that several data-points exert disproportionate influence on the explained variance. Instead, typological frequency seems to be better modeled as a function of the logarithm
of the r-volume; Figure 7 illustrates both a
lin-ear (R2 = 0.39, p < 0.05) and exponential
(R2 = 0.704, p < 0.001) fit of frequencies to
log-transformedr-volumes.
4 Interpretation and Future Work
The correlates of attestation and frequency reported here suggest novel ways that linguistic models might be used to make testable predictions about
typol-ogy. Two of these correlates—k-gram entropy and
confusability—are particularly general, their calcu-lation requiring only the set of possible languages or patterns that a model can specify. It remains an interesting question whether these same quantities retain predictive power for other sorts of data and
models than are considered here, and whether such correlations might fruitfully be incorporated into an evaluation metric for linguistic models.
Ther-volume result motivates a particular line of
further research on the nature of constraints in OT: how exactly the contents of a constraint set
deter-mine the distribution of r-volumes in the factorial
typology. In addition, there are several other po-tentially relevant concepts in the literature, includ-ing Anttila’s (1997, 2002, 2007) rankinclud-ing-countinclud-ing model of variation, Anttila and Andrus’ (2006) “T-orders” and Prince and Tesar’s (1999)
“restrictive-ness measure,” whose relations to r-volume merit
examination. Our results forr-volume in this case
also suggest that a fully generalized notion of
para-metric grammar volumemay be worth investigating across different kinds of models and various typo-logical phenomena.
Insofar as the three correlates’ strength as typo-logical predictors depends on the set of stress pat-terns generated by Gordon’s model, their signif-icance is consistent with the hypothesis that the model is useful and has some predictive power. Such statistical significance is rather surprising, since Gordon’s model was developed primarily as an at-tempt to satisfy the inclusion-exclusion criterion, without any explicit eye toward the kinds of pre-dictions that these correlates seem to suggest it can
make. This is especially true ofr-volume, as it is the
correlate most tightly coupled to the OT particulars of Gordon’s model. These findings motivate further research on the general relationship, if any, between the inclusion-exclusion predictions of a model (opti-mality theoretic or otherwise) and its frequency pre-dictions according to the measures presented here. On the other hand, the entropy and confusability re-sults suggest the intriguing possibility of discarding such a model altogether, and instead picking the at-tested stress systems (and their frequencies) directly from the large pool of logically possible ones, ac-cording to these measures and others like them.
Acknowledgements
We owe many thanks to Jeff Heinz for the typologi-cal data used in this study, and to Alan Yu, Morgan
Sonderegger, and the anonymous reviewers of SIG
References
A. Abrahamson. 1968. Constrastive distribution of phoneme classes in Ic¸u˜a Tupi. Anthropological Lin-guistics, 10(6):11–21.
Arto Anttila and Curtis Andrus. 2006. T-Orders. Manuscript, Stanford University.
Arto Anttila. 1997. Deriving variation from gram-mar. In Frans Hinskens, Roeland van Hout, and Leo Wetzels, editors,Variation, Change and Phonological Theory, pages 35–68. John Benjamins Press, Amster-dam/Philadelphia.
Arto Anttila. 2002. Variation and phonological the-ory. In Jack Chambers, Peter Trudgill, and Na-talie Schilling-Estes, editors, Handbook of Language Variation and Change, pages 206–243. Blackwell, Malden, Mass.
Arto Anttila. 2007. Variation and optionality. In Paul de Lacy, editor,The Cambridge Handbook of Phonol-ogy. Cambridge University Press, Cambridge. Todd Bailey. 1995. Nonmetrical Constraints on Stress.
Ph.D. thesis, University of Minnesota.
D.B.W. Birk. 1976. The Malakmalak Language, Daly River (Western Arnhem Land). Australian National University, Canberra.
Bart de Boer. 2000. Self-organization in vowel systems. Journal of Phonetics, 28:441–465.
I.J. Good. 1953. The population frequencies of species and the estimation of population parameters. Biometrika, 40(3/4):237–264, December.
Matthew Gordon. 2002. A factorial typology of quantity-insensitive stress. Natural Language and Linguistic Theory, 20(3):491–552.
Morris Halle and Jean-Roger Vergnaud. 1987. An Essay on Stress. MIT Press, Cambridge, MA.
Bruce Hayes. 1980. A Metrical Theory of Stress Rules. Ph.D. thesis, MIT, Cambridge, MA.
Bruce Hayes. 1995. Metrical Stress Theory: Princi-ples and Case Studies. University of Chicago Press, Chicago.
Jeffrey Heinz, Greg Kobele, and Jason Riggle. 2005. Ex-ploring the typology of quantity-insensitive stress sys-tems without gradient constraints. Handout, 2005 An-nual Meeting of the Linguistic Society of America. Jeffrey Nicholas Heinz. 2007. Inductive Learning of
Phonotactic Patterns. Ph.D. thesis, UCLA.
Larry Hyman. 1977. On the nature of linguistic stress. In Larry Hyman, editor,Studies in Stress and Accent, pages 37–82. University of Southern California, De-partment of Linguistics, Los Angeles.
Johan Liljencrants and Bjorn Lindblom. 1972. Numer-ical simulation of vowel quality systems: The role of perceptual contrast. Language, 48(4):839–862.
John Lynch. 1974. Lenakel Phonology. Ph.D. thesis, University of Hawaii.
Ian Maddieson. 1984. Patterns of Sounds. Cambridge University Press, Cambridge.
Elliott Moreton. in press. Learning bias as a factor in phonological typology. In Charles Chang and Anna Havnie, editors, Proceedings of the 26th Meeting of the West Coast Conference on Formal Linguistics. Alan Prince and Paul Smolensky. 1993. Optimality
theory: Constraint interaction in generative grammar. Ms., Rutgers University and University of Colorado, Boulder.
Alan Prince and Bruce Tesar. 1999. Learning phonotac-tic distributions. Ms., ROA 535.
Alan Prince. 1983. Relating to the grid. Linguistic In-quiry, 14:19–100.
Alan Prince. 2002. Entailed ranking arguments. Rutgers Optimality Archive, ROA-500.
Jason Riggle, Max Bane, James Kirby, and Jeremy O’Brien. 2007. Efficiently computing OT typologies. In 2007 Annual Meeting of the Linguistic Society of America.
Jason Riggle. 2004. Generation, Recognition, and Learning in Finite State Optimality Theory. Ph.D. the-sis, UCLA.
Jason Riggle. 2008. Counting rankings. Manuscript, University of Chicago. Draft available at
http://hum.uchicago.edu/˜jriggle/. Shaligram Shukla. 1981. Bhojpuri Grammar.
George-town University Press.