Identifying Novel Lignocellulosic
Processing Enzymes from Cellulomonas
fimi using Transcriptomic, Proteomic and
Evolution Adaptive Studies
Nurashikin Ihsan
Doctor of Philosophy
University of York
Biology
Abstract
The declining reserves of fossil fuel twined with an increasing concern about the environmental
consequences of burning these fuels and rising carbon dioxide levels, means that a more
sustainable replacement is required. Lignocellulosic biomass is an attractive candidate that has
been shown to be the best sustainable alternative source to produce bioethanol for liquid
transportation fuels. It has enormous availability, is renewable and cost-effective. As an
agricultural residue, it does not compete with food production. However, lignocellulosic
biomass of plant cell walls is composed mainly of cellulose, hemicellulose and lignin, which are
extremely resistant to digestion. Converting this biomass to useful products of fermentable
sugars for bioethanol production has met with little success as harsh pretreatment and costly
enzyme applications are required. An arsenal of enzymes and a synergistic mechanism are
required to deconstruct recalcitrant lignocellulosic biomass for an efficient production of
lignocellulosic bioethanol. To achieve this goal, this study used transcriptomic and proteomic
approaches with the objective of identifying new genes and enzymes involved in lignocellulose
degradation. This revealed that the only one AA10 of Cellulomonas fim i was among the highest
enzymes identified during the degradation of cellulose. Another other 20 hypothetical proteins
co-expressed with CAZymes have been identified including a potentially exclusively new C. fim i
P-glucosidase (PKDP1) that contains a PKD-domain and oxidoreductase predicted function of
PQQ-domain. A naturally mutagenized C. fim i population also was screened from an adaptive
evolution experiment involving exposure to a wheat straw environment. One of the strains in
the adaptive population (Strain-6) showed a higher association with wheat straw biomass, which
may be an indication of the strategy that being used by the adapted strain to tackle obstinate
substrates to sustain growth. These results show many new enzymes would be revealed from
the C. fim i repertoire in order to have a better enzymatic cocktails for lignocellulose breakdown.
For the future, this encourages a deeper understanding of lignocellulose deconstruction
List of Contents
Abstract...2
List of Contents...3
List of T a b le s... 10
Lisr of Figures... 11
List of Appendices...14
Dedication ... 15
Acknow ledgem ents... 16
Author's declaration... 18
1 Introduction... 19
1.1 World's trend on water-food-energy dem and... 19
1.1.1 Global resources insecurity and climate change ... 19
1.2 Bioethanol as a biofuel ... 22
1.2.1 First generation of biofuel...23
1.2.2 Second generation of biofuel... 23
1.3 Lignocellulosic biomass ... 24
1.3.1 Cellulose ... 25
1.3.2 Hemicellulose ... 26
1.3.3 Lignin ... 27
1.4 Lignocellulose digestion in nature... 28
1.4.1 Aerobic lignocellulolytic bacteria...29
1.4.2 Glyosyl Hydrolases (G H s)...29
1.4.3 Lytic polysaccharide Monooxygenase (LPM O )...30
1.4.4 Cellulomonas fim i ATCC® 4 8 4 ™ ...32
1.5 Aims of the project...36
2 General materials and methods... 37
2.1 Chemical reagents, substrates, and organism s... 37
2.1.2 Lignocellulose biomass ... 37
2.1.3 Organisms ... 38
2.2 Microbiology methods ... 38
2.2.1 Buffers ... 38
2.2.2 Media for bacterial grow th...38
2.2.3 Agar plate and slant preparation...38
2.3 Molecular biology techniques...39
2.3.1 Gram-positive bacterial DNA extraction...39
2.3.2 Fungal cells A. niger disruption for DNA extraction... 40
2.3.3 cDNA synthesis...40
2.3.4 Polymerase Chain Reaction (PCR)...40
2.3.5 Agarose gel electrophoresis...41
2.3.6 Plasmid extraction... 41
2.3.7 PCR clean-up ... 42
2.3.8 Nucleotide quantification... 42
2.3.9 Sanger DNA Sequencing... 42
2.3.10 In-Fusion™ cloning... 42
2.3.11 DNA restriction digests... 43
2.3.12 Transformation of competent c e lls... 43
2.4 Protein m ethods...43
2.4.1 Bradford assay for protein quantification... 43
2.4.2 Sodium dodecyl sulfate polyacrylamide gel electrophoresis (SDS-PAGE)... 43
2.4.3 Western blotting... 44
2.4.4 Protein concentration by centrifugation...45
3 Growth and transcriptomic studies of Cellulomonas fim i... 46
3.1 Introduction...46
3.2.3 Total RNA extraction...50
3.2.4 Enrichment of mRNA from total R N A ... 50
3.2.5 rRNA depletion using Ribo-Zero rRNA Removal Kit (Bacteria) and Ribo-Zero rRNA Removal Kit (Gram -positive)... 51
3.2.6 Selective cDNA synthesis for rRNA depletion using NuGEN-Ovation® Universal RNA-Seq System ... 51
3.2.7 Illumina Sequencing libraries ... 52
3.2.8 Mapping ... 52
3.2.9 Transcript abundance and bioinformatics analysis...53
3.2.10 Differential expression analysis... 53
3.3 Results ... 54
3.3.1 Growth study of C. fim i utilizing different substrates...55
3.3.2 Total RNA extraction from C. fim i...56
3.3.3 mRNA enrichment from total R N A ...58
3.3.3.1 mRNA enrichment by rRNA depletion...58
3.3.3.2 RNA-Seq work and analysis using NuGEN® Ovation Universal RNA-Seq Sytem.. 58
3.3.4 The transcriptome of C. fim i growing on five substrates... 60
3.3.4.1 Expression of CAZy genes in C. fim i grown on polysaccharides and comparison with C. fim i grown on glucose...60
3.3.4.2 Expression of Carbohydrate Active Enzyme (CAZy)-encoding genes...61
3.3.4.3 Co-expression of upregulated CAZy- and non-CAZy encoding genes using differential analysis...66
3.4 Discussion ... 72
4 Proteomic Analysis of the Secretome of Cellulomonas fim i... 76
4.1 Introduction... 76
4.2 Materials and methods ... 79
4.2.1 Sample preparation ... 79
4.2.2 Protein quantification ... 80
4.2.3 Enzyme activity assays ... 80
4.2.3.1 Qualitative plate activity assay ... 80
4.2.3.2 Reducing sugar assay in protein solution ... 80
4.2.4 Label-free semi-quantitative proteomic analysis using mass spectrometry ... 81
4.2.4.1 1D mini gel electrophoresis and tryptic digestion for GelC-MS of C. fim i proteomic samples from culture supernatants ... 81
4.2.5 Mass Spectrometry Analysis of C. fim i proteomic samples from culture supernatants...82
4.2.5.1 Spectra analysis...82
4.2.5.2 Notes on Molar Fraction percentage (MFP) values ... 84
4.3 Results ... 85
4.3.1 Protein quantification ... 85
4.3.1.1 Sodium Dodecyl-Sulphate Polyacrylamide Gel Electrophoresis (SDS-PAGE) ... 85
4.3.1.2 Bradford assay ... 87
4.3.2 Enzyme activity assay... 88
4.3.2.1 Enzyme activity agar plate assay ... 88
4.3.2.2 Reducing sugar assay of protein solution...91
4.3.3 Label-free semi-quantitative proteomic analysis ... 92
4.3.4 Sequence-based analysis of the secreted proteins... 93
4.3.4.1 Functional distribution and localization of identified proteins from C. fim i secretome... 93
4.3.4.2 Secretion pathways of extracellular C. fim i proteins...94
4.3.5 Principal Component Analysis (PCA)...95
4.3.6 Protein domain prediction... 98
4.3.7 CAZymes secreted by C. fim i...100
4.3.8 Cellulases...100
4.3.9 A LPMO, additional glucanases and potential xylanases... 101
5 Attempted Characterization of a Cellulomonas fimi PKD-Domain Containing Protein
(PKDP1)...112
5.1 Introduction ... 112
5.1.1 Multidomain structure prediction of the C. fim i PKD-domain-containing protein, Celf_2278... 112
5.1.2 Polycystic kidney disease I (PKD1) dom ain...114
5.1.3 Protective Antigen (PA) 14... 116
5.1.4 A multidomain of Glucose/Sorbone Dehydrogenese (GSDH) and Pyrroluquinone quinone (PQQ) dependent dom ain...117
5.1.5 Aims of this chapter... 119
5.2 Materials and methods ... 120
5.2.1 Isolation of native PKDP1 protein from supernatant and substrate-bound fractions induced with specific substrates in C. fim i culture...120
5.2.2 Weak anion exchange chromatography for native isolation of PKDP1... 121
5.2.3 Expression of C. fim i PKDP1 in prokaryotic expression systems...121
5.2.4 Gene amplification and cloning... 121
5.2.5 Expression of PKDP1 in E. coli strains...122
5.2.6 Larger scale expression culture of heterologous PKDP1 by E. coli ArcticExpress™ ...123
5.2.7 Purification of heterologously expressed PKDP1...123
5.2.8 Expression of C. fim i PKDP1 in an Aspergillus niger expression system ... 124
5.2.8.1 Cloning of a codon-optimized C. fim i PKDP1 gene into pIGF-pyrG expression system...124
5.2.9 Preparation of Hutner's trace elem ents... 125
5.2.10 Preparation of minimal m edia... 125
5.2.11 Preparation of protoplasts... 125
5.2.12 Fungal transform ation... 127
5.2.13 Direct Colony Polymerase Chain Reaction (DCPCR) using DNA template from A. niger hyphae... 128
5.3 Results 129
5.3.1 Attempted isolation of PKDP1 from C. fim i cultures... 129
5.3.1.1 Growth on different substrates... 129
5.3.1.2 Isolation trial of C. fim i PKDP1 using weak anion exchange chromatography . 130 5.3.2 Recombinant PKDP1 solubility study in E. coli BL21(DE3)...132
5.3.3 Expression trial of C. fim i PKDP1... 133
5.3.4 Larger Scale Expression and Purification of C. fim i PKDP1 using ArcticExpress™ cells ...139
5.3.4.1 Result of larger protein expression...139
5.3.4.2 Result of protein purification by affinity column chromatography...140
5.3.5 Expression of codon-optimized recombinant C. fim i PKDP1 in Aspergillus niger ...141
5.3.6 Solubility of PKDP1 protein... 144
5.4 Discussion ... 148
5.4.1 Attempted isolation of native PKDP1 from C. fim i culture...148
5.4.2 PKDP1 expression in Escherichia co li...149
5.4.3 PKDP1 expression in Aspergillus niger... 152
6 Adaptive Evolution of Cellulomonas fimi by Continuous Subculture on Wheat Straw . 154 6.1 Introduction... 154
6.2 Materials and methods ... 156
6.2.1 Bacterial strain, media, and cultivation ... 156
6.2.2 Strain construction ... 156
6.2.3 Analytical methods ... 158
6.2.3.1 Cell growth profiles and relative growth rate ... 158
6.2.3.2 Carbon dioxide evolution (CER) ... 158
6.2.3.3 Estimation of growth and bacterial residency by genomic DNA of C. fim i strains ...158
6.2.5 Enzyme activity assays in culture supernatant ... 161
6.2.6 Compositional analysis of oligosaccharide from wheat straw degradation... 162
6.2.7 Quantification of lignocellulose biomass residual after degradation... 162
6.2.8 Statistical analysis...162
6.3 Results ... 163
6.3.1 Growth rates on wheat straw of C. fim i strains... 163
6.3.2 Carbon Dioxide Evolution Rate (CER) of C. fim i... 165
6.3.3 Isolation of C. fim i Genomic DNA (gDNA) from supernatant and biomass fractions... 168
6.3.4 Total protein isolation from C. fim i culture supernatant and cell-bound to wheat stra w ... 170
6.3.5 Qualitative visualisation of C. fim i bound to wheat straw using Scanning Electron microscopy (SEM )...172
6.3.6 Enzyme activity assay using culture supernatants...180
6.3.7 Polysaccharide content and com position... 182
6.3.8 Quantification of residual wheat straw ... 184
6.4 Discussion ... 185
7 Final discussion...190
Appendices... 195
Abbreviations... 222
List of Tables
Table 1.1: Characterized C. fim i proteins involving in polysaccharide degradation as listed in the
UniProt KB database...33
Table 2.1: Polymerase chain reaction components... 40
Table 2.2: Polymerase chain reaction thermocycling conditions... 41
Table 3.1: Experimental design and number of reads generated by RNA sequencing of fifteen C. fim i RNA-seq samples with triplicates for each condition... 61
Table 3.2: Number of upregulated CAZy-encoding genes for each comparison condition... 62
Table 3.3: The CAZy-encoding genes upregulated on each carbohydrate substrate using Differential Gene Expression (DGE) analysis... 64
Table 3.4: Identification of co-expressed genes which upregulated with CAZy-encoding genes from differential analysis of RNA-seq data...67
Table 4.1: Known cellulase and xylanase families in Cellulomonas fim i... 76
Table 4.2: Importance of component variables from the C. fim i proteomic dataset analysed by Principal Component Analysis (PCA)...95
Table 4.3: Summary of predicted domains found in 1,4-P-xylanase (Prot3, Celf_0574)...99
Table 4.4: Summary of detected cellulases and xylanases in C. fim i secretome grown on four types of carbon sources compared to the CAZy database of C. fim i enzymes (2017)...102
Table 5.1: PKDPs of C. fim i detected in the proteomic analysis using nanoLC-MS/MS...113
Table 5.2: Primers used to amplify PKDP1 (Celf_2278) for cloning into pETFFP_3 vector with various solubility tags...122
Table 5.3: Primers used to amplify codon-optimized PKDP1 and add the tag sequence into (Celf_2278) for cloning into pIGF-pyrG A. niger vector... 124
Table 5.4: Forward primers used for DCPCR of C. fim i PKDP1 gene in pIGF-pyrG vector... 128
Table 5.5: Pre-computed score of C. fim i PKDP1 protein localization... 145
List of Figures
Figure 1.1: The world's trend demand and policy nexus... 19
Figure 1.2: Proportions of global greenhouse gas emissions by (A) economic sectors and (B) the projection of CO2 emission...20
Figure 1.3: Fires from open burning in India and Indonesia detected by NASA satellites...21
Figure 1.4: Illustration of a plant cell walls... 25
Figure 1.5: Overview of cellulose structure... 26
Figure 1.6: Structure of lignin...28
Figure 1.7: Schematics of microbial mechanisms of lignocellulose degradation...30
Figure 3.1: Workflow of transcriptome analysis of C. fim i transcriptome grown on four types of carbon source... 49
Figure 3.2: Growth profiles of C. fim i grown on different carbon sources initiated using differently aged inocula of seeding cells... 55
Figure 3.3: Electrophoretic analysis of RNA from C. fim i using TapeStation® with standard RNA ScreenTape®... 56
Figure 3.4: TapeStation® Electrophogram of total RNA harvested from five substrates of Day-3 C. fim i grown cultures...57
Figure 3.5: Histogram indicating quality of RNA-Seq result with percentage of the reads mapped to the genome including the rRNA genes, coding sequences genes and the unmapped reads...59
Figure 3.6: Differentially expressed transcripts between glucose and carbohydrate treatment after 3-days growth of C. fim i... 63
Figure 3.7: Venn diagram of the CAZy- and non-CAZy encoding genes that were significantly upregulated in each condition... 66
Figure 4.1: Workflow for secretome analysis of C. fim i grown on four types of carbon source...79
Figure 4.2: SDS-PAGE secretome profiles of C. fim i grown in 5 substrates with 3 biological replicates at 3 time points... 86
Figure 4.3: Protein concentration in the supernatant of day-3 C. fim i cultures grown on different substrates... 87
Figure 4.4: Detection of polysaccharide-degrading enzymes from supernatant of C. fim i culture in nutrient agar plates containing substrates stained with Congo Red... 89
Figure 4.5: Identification of polysaccharide-degrading activities in C. fim i culture by the activity plate assay...90
Figure 4.7: Distribution of extracellular proteins detected in day-3 C. fim i cultures... 92
Figure 4.8: Functional classification of proteins secreted by C. fim i grown on Avicel, xylan, wheat straw, and sugarcane bagasse... 93
Figure 4.9: Venn diagram showing the predicted distribution of four secretion pathways among the 71 identified extracellular proteins of C. fim i...94
Figure 4.10: Scree plot from Principal Component Analysis (PCA) of proteomics from day-3 C. fim i culture supernatants from growth in Avicel, beechwood xylan, wheat straw, and sugarcane bagasse... 96
Figure 4.11: Biplot graph from PCA analysis of C. fim i proteomic dataset using two principal components... 97
Figure 5.1: Predicted domain organization of PKD-domain-containing proteins of C. fim i... 113
Figure 5.2: Partial Sequence alignment of five PKDPs of C. fim i...115
Figure 5.3: Chemical structure of pyrroloquinoline quinone (PQQ)... 117
Figure 5.4: Proposed scheme of fungal synergies for oxidative degradation of cellulose... 119
Figure 5.5: Equipment setup for fungal protoplast collection... 126
Figure 5.6: SDS-PAGE analysis of protein extracted from supernatant and substrate-bound fractions induced by specific substrates in C. fim i culture... 129
Figure 5.7: Weak anion exchange separation of extracellular proteins of C. fim i grown in Avicel for 7 days... 131
Figure 5.8: Protein gel analysis of PKDP1 expression samples following dot blot screening of C. fim i candidate proteins...133
Figure 5.9: Protein gel analysis of expressed PKDP1 following induction in E. coli BL21 (DE3)... 135
Figure 5.10: Protein gel analysis of expressed PKDP1 following induction in E. coli ArcticExpress™...136
Figure 5.11: Protein gel analysis of expressed PKDP1 following induction in E. coli SHuffle®...137
Figure 5.12: Protein gel analysis of expressed PKDP1 following induction in SHuffle®T7...138
Figure 5.13: Protein gel analysis of expressed PKDP1 following induction in E. coli ArcticExpress™ from 500 mL culture... 139
Figure 5.14: Protein gels analysis of affinity chromatography purification fractions of expressed PKDP1 in E. coli ArcticExpress™... 140
Figure 5.15: Colonies of A. niger transformed with codon-optimized PKDP1 in pIGF-pyrG on AMMN agar plates after 4 days of incubation at 3 0 °C ...141
Figure 5.18: Transmembrane prediction of PKDP1 using membrane protein topology prediction based on Transmembrane hidden Markov model (TMHMM) prediction server... 145
Figure 5.19: The Kyte and Doolittle (278) hydrophobicity plot of PKDP1 from C. fim i... 147
Figure 6.1: Experimental design for adaptive evolution... 157
Figure 6.2: Comparison of growth profiles between C. fim i wild type and adapted strain-1 to strain-6 in 4-day time course...164
Figure 6.3: Carbon dioxide evolution rate (CER) for wild type and 6 adapted strains of C. fim i grown on wheat straw... 166
Figure 6.4: Carbon dioxide evolution comparison between C. fim i wild type and six
independent one year-adapted strains over a 4-day time course...167
Figure 6.5: Quantitative measurement and qualitative observation of gDNA isolated from Day-4 of the wild type and six population adapted strains of C. fim i from wheat straw culture....169
Figure 6.6: Quantification of total protein isolated from supernatant and biomass fraction of wild type, strain-3 and strain-6 of 1-year adapted strains... 171
Figure 6.7(A): Surface images obtained by SEM on wheat straw after 4 days of aerobic
degradation inoculated with the wild type of C. fim i in basal medium...173
Figure 6.7(B): Surface images obtained by SEM on wheat straw inoculated with strain-1 of C.
fim i after 4 days of aerobic degradation in basal medium...174
Figure 6.7(C): Surface images obtained by SEM on wheat straw inoculated with strain-2 of C.
fim i after 4 days of aerobic degradation in basal medium...175
Figure 6.7(D): Surface images obtained by SEM on wheat straw inoculated with strain-3 of C.
fim i after 4 days of aerobic degradation in basal medium...176
Figure 6.7(E): Surface images obtained by SEM on wheat straw inoculated with strain-4 of C.
fim i after 4 days of aerobic degradation in basal medium...177
Figure 6.7(F): Surface images obtained by SEM on wheat straw inoculated with strain-5 of C.
fim i after 4 days of aerobic degradation in basal medium...178
Figure 6.7(G): Surface images obtained by SEM on wheat straw inoculated with strain-6 of C.
fim i after 4 days of aerobic degradation in basal medium...179
Figure 6.8: Comparison of CMCase and xylanase activity in culture supernatant of wild type and adapted strain-1 to strain-6 of C. fim i... 181
Figure 6.9: Monosaccharide composition from the wheat straw degradation by wild type, strain-3 and strain-6 of C. fim i... 183
Appendix A: Predicted structural domains of proteins identified in C. fim i secretome...192
Appendix B: List of 71 proteins identified in C. fim i secretome grown in four types of
carbon sources... 200
Appendix C: Multiple sequences alignment of C. fim i PKD-domain containing proteins... 206
Appendix D: Sequence of condon-optimized C. fim i PKDP1 protein synthesized by
GeneArt®...210
Appendix E: pIGF-pyrG A. niger vector map...218
Dedication
This thesis is dedicated to my beloved children,
who being my buffering system, my backbone,
during the ups and downs and the bittersweets
of this PhD journey,
Acknowledgements
In the name of God, the Most Beneficent the Most Merciful
There are a number of people without whom this thesis might not have been written, and to whom I am greatly indebted.
To my mother and eldest sister, Mrs. Hafifah and Ms. Khairunisa, who continue to be patiently and steadfastly in facing great challenges in your life years ago, and who have been a source of encouragement and inspiration to me throughout my life, a very special thank you for sacrifice a lot of things, also helped to fund and support me and my family through the last several months of my final labworks and writing stage in the UK. And also including my other siblings, Nurfarahin, Amirul Hakim and Izleen Azyzee for the myriad of ways in which, throughout my life, you have actively supported me in my determination to find and realise my potential, and to make this contribution to our world.
To my dear husband, Hairuddin who remains willing to engage with the struggle, and ensuing discomfort, of having a partner who refuses to accept any failures and in most of the time was emotionally-driven to continue this PhD journey until the finishing line. A very special thank you for your practical and emotional support as I added the roles of wife and then mother, to the competing demands of work, study and personal development.
Much loving thanks to dear Harith and Sophea, for being so supportive and indeed my main support - even when being 'without mum' was not the best event in most of the time. This work is for, and because of you and all the generations to come. It is dedicated to all our journeys in learning to thrive.
It is also dedicated to Dr. Laziana - friend, 'sister', colleague, and researcher - who knowingly and unknowingly- led me to an understanding of some of the subtler challenges to our ability to thrive. If our attempts to claim our right to speak our truth, and to unravel and follow the threads through which our oppression is maintained, and are instrumental in helping one other "Super Woman" from 'going over the edge' - in which sight we continuously live our lives - perhaps, it might be seen that your invaluable contribution to the attainment of many of the insights gained was worth it.
Loving thanks to my friends, project partners, and colleagues; Dr. Susie Bird, Dr. Nicola Oates, and Dr. Anna Alessi, who played such important roles along the journey, also to lovely Lynda Sainty and Dr. Alexandra Lanott, as we mutually engaged in making sense of the various challenges we faced and in providing encouragement to each other at those times when it seemed impossible to continue.
I also greatly indebted special thanks to Dr Thorunn Helgason as one of the Training Advisory Panel (TAP) members, also to Professor Mike Brockhurst, for never under-estimate my potentials, and always help to boost my self-esteem to guide me in this research world mostly during our TAP meetings. To Dr Klaus Winzer from Nottingham University, for willingly accepted the appointment as an external examiner in the very last minute, but has commit amazingly to this thesis by offered many great comments and very critical reviews to make this thesis in a better presentation.
I offer special thanks to those who supported me in the mechanics of producing this thesis. Dr. Katrin BiePer and Dr. Clare Steele-King, for reading and rereading drafts; Luisa for giving hands and ideas as a sifoo of cloning work; Dr. Lesley Gilbert for kind motivation and help during preparation of RNA-Seq samples. To Laziana and Nahed for help with formatting and for helping me get 'unstuck' with this thesis on many occasions from the very first draft, to an extend helping me to print out the thesis for the viva.
To everyone in CNAP who have helped during my lab life. This has been an exceptionally enjoyable environment to learn and to work in, due to being filled with lovely people who take the time to support others around them. Leo Gomez, Joe, Rachael H., Rachael E., Emily, Dan, Dave, Louise, Maria M., Duong, Julia, Juliana, Daniel U., Giovanna, Fede and Aritha.
My appreciation also goes to Cikgu Salmah and Cikgu Saodah, who were among the first person who introduce me to science since in the primary school, Cikgu Nazli Abdullah, my biology teacher in the secondary science school who has inspired me to continue and strive in life- sciences stream. Also Prof Noor Aini, and Assoc. Prof Dr Madihah Salleh, who seen my compassion in biology, and my determination to thrive and go beyond the edge during my first degree.
Thank you to Ministry of Higher Education, Government of Malaysia; Universiti Teknologi Malaysia who provide the Academic Staff Bumiputra Training Scholarship (SLAB) through my 3.5 years of study. My special grateful appreciation to Radhika V Sreedhar Scholarship and Prof McQueen-Mason for the hardship funds in my last several months towards the completion of 4 years of my PhD journey. Personally, all the funds mean a lot to me and played as the main contributors of making this journey completed, successfully.
Most of all, I'm gratefully praise to the Greatest God, who make the impossible, possible.
Verily, with hardship, there is relief.
Author's declaration
I declare that the work presented in this thesis is my own original work of research and I am the sole author, except where due reference has been given to collaborators and co-workers.
This work has not previously been presented for an award at this, or any other, University.
1 Introduction
1.1 WORLD'S TREND ON WATER-FOOD-ENERGY DEMAND
Chapter 1: IntroductionThe demand for water, food, and energy are predicted to increase by 40, 35, and 50 percent,
respectively in the coming decades (1). This leads to the debate on 'resource scarcity' where
the scientific findings suggest that humanity has exceeded the planetary boundaries and is
threatening its own safety (2). Water, food and energy resources are tightly interconnected,
forming a policy nexus (3,4) that is being discussed all over the globe by policy makers and
scientists looking for solutions for sustainable development planning (Figure 1.1).
Figure 1.1: The world's trend demand and policy nexus.
It is predicted that by 2030 the world will need to produce around 50 per cent more food and
energy, together with 30 per cent more fresh water, whilst mitigating and adapting to climate
change. Illustration is reproduced from Beddington (5).
1.1.1 Global resources insecurity and climate change
Water is important for life and is a vital resource for the economy. It is also plays a fundamental
role in the climate regulation cycle. Therefore, the management and protection of water
resources is one of the keystones of environmental protection (4). Water insecurity caused by
unmonitored development and environmental stress such as climate change may have a
material impact on the economy. Climate change is the change in climate parameters such as
effect. It is significantly impacted by agriculture due to increasing water demand, limiting crop
productivity and reducing water availability in areas where irrigation is most needed (4). Several
other sectors can also cause climate change; e.g. from burning activities by the release of CO2
from fossil fuel combustion and an underestimated source of greenhouse gases (GHG) emissions
that is anticipates from tropical deforestation (6-8). The term Greenhouse gases refers to gases
that contribute to the effect by absorbing infrared radiation (heat). The greenhouse effect is the
process where the greenhouse gases (water vapors, CO2, methane, etc.) in the atmosphere
absorb and re-emit heat being radiated from the Earth, hence trapping warmth that causes
global warming (9). Global climate change is linked to the accumulation of greenhouse gases
which causes concerns regarding the use of fossil fuels as the major energy source. To mitigate
climate change while keeping energy supply sustainable, one proposal solution is to rely on the
ability of microorganisms to use renewable resources for biofuel synthesis. Figure 1.2(A) shows
the percentage of global greenhouse gas emissions from a study conducted by
Intergovernmental Panel on Climate Change (IPCC) from 2010 (10). Electricity, heat production
(25%) as well as agriculture, forestry and other land use (24%) contributed the most greenhouse
emissions followed by transportation sector (14%). The increment production of GHG and black
carbon emission are among the disadvantages of human activities that create a serious
environmental concern. A study showed that the emission of CO2 is projected to be increased
since 1750 towards 2050 (Figure 1.2(B)).
Chapter 1: Introduction
Figure 1.2: Proportions of global greenhouse gas emissions by economic sectors (A) and the
projection of CO2 emission (B).
A) Six major economic sectors that use energy and produce GHG based on a global emissions
study from 2010 reported in IPCC report, 2014 (10). B) Projection of global carbon dioxide
Chapter 1: Introduction
Large scale tropical deforestation caused by burning activities in countries such as Indonesia as
well as the burning of agricultural residues which occur particularly in developing countries e.g.
in India and Vietnam cause toxic and severe air pollution (8). The National Aeronautics and Space
Administration (NASA) revealed the severity of these activities from the satellite images taken
from space (Figure 1.3). The maps revealed that stubble-burning was not widespread in 2000.
However, the problem had grown alarmingly by 2002 and continues to be a major health hazard.
A)
B)
Figure 1.3: Fires from open burning in India and Indonesia detected by NASA satellites.
A) NASA satellite pictures reveal the evolution of paddy-stubble burning problem in Punjab,
India since 2000. Each orange dot represents 1 sqkm2 area where significant fires were
observed. Each map shows cumulative farm fires from Oct 1 to Nov 10, each year. Images are
reproduced from an article in 2015 by Amit Bhattacharya (12). B) Fires in Sumatra, Indonesia
detected by NASA's Moderate Resolution Imaging Spectroradiometer (MODIS) sensor in 2013.
Fires set for deforestation/land clearing in Indonesia triggered health warnings in Singapore and
most parts of Malaysia. Images courtesy of Google Earth and NASA, reproduced from an article
The NASA images are clear proof that widespread crop burning has become a major contribution
to air pollution and GHG emission specifically in Asian countries. These are among the examples
that emission of CO2 and GHG contribute to the net carbon change in the atmosphere which
trigger the climate instability and result in global warming (6). Black carbon emissions are a
potential danger to human health and may cause premature deaths (14). The real scenarios are
happening on the ground when the farmers burn fields to clear crop stubble left after harvest.
However, as many farmers cannot afford to spend extra money to use a tractor and plough
stubble into the earth to be decomposed, open-burning of the stubble became the fastest and
cheapest option. To decompose the stubble, the farmers have to further invest in watering
systems. As this process takes time, it is not favorably practiced. Furthermore, the quality of the
stubble after being harvested using a machine is not usable as fodder and could not be recycled
into cardboard (15).
The International Energy Agency (IEA) are targeting a 50% reduction of greenhouse gasses by
2050 (16). Several technologies for generating bioenergy to produce heat and power already
exist, ranging from conventional solid wood heating installations for buildings to biogas
digesters for power generation, to large-scale biomass gasifications, as well as the production
of biofuels especially for transportation sector (16). Renewable sources for the generation of
electricity and heat and can be produced from tidal and wind energies. However, these
resources cannot be utilized as fuels; particularly liquid fuel for transportation. Therefore, the
only way to produce sustainable renewable liquid fuels is through the use of renewable
biological products to create biofuels.
1.2 BIOETHANOL AS A BIOFUEL
Biofuels are produced by the conversion of biomass into liquids or gases, such as ethanol, lipids
as biofuel precursors, biogas, or hydrogen, via biological or thermal processes. Bioethanol
(CH3CH2OH) is a liquid biofuel which can be produced from several different feedstocks.
Bioethanol can be used as a chemical in industrial applications or as fuel for energy generation;
neat or blended with gasoline or diesel fuels. Biofuels can be broadly divided into first
generation and second generation. Briefly, first generation bioethanol is mainly produced from
edible crop feedstock by fermenting starch or sugars. The issue with first generation fuels is that
their use of food commodities adds stress to world food security in an unsustainable manner.
such as crop residues or dedicated biomass crops. This is achieved via several pretreatments
steps of the biomass, enzymatic hydrolysis and fermentation of the resulting sugars.
1.2.1 First generation of biofuel
Currently, first generation biofuels are sourced from crops such as starch, sugar, vegetable oil
as energy-containing molecules, or even animal fats processed by conventional methodologies.
First generation biofuels offer benefits for reducing CO2 emission and can aid to improve
domestic energy security. Biodiesel (bio-esters), bioethanol and biogas are the examples of the
first generation biofuels that have been categorized by its ability to be blended with petroleum-
based fuels and combusted in existing internal combustion engines (17,18). The production of
first generation biofuels is now commercially competitive with the largest ethanol producing
countries, United States of America (USA) and Brazil being responsible for the production of 54
x 106 and 21 x 106 m3 in 2011, respectively (19). However, the source of feedstock raised
concerns on the possible impact on biodiversity and land use; besides the competition with food
crops (17). The disadvantage with these first generation biofuels is that they compete for
resources with food commodities, adding to the stress on world food security brought about
the growing global human population. This apparent conflict greatly limits the amount and
sustainability of the biofuels that can be produced. One way in which the food security issue can
be avoided is by producing biofuels from the woody non-food parts of crops and other residues.
1.2.2 Second generation of biofuel
Second generation bioethanol can be produced by fermenting sugars from the lignocellulosic
biomass of dedicated bio-energy crops e.g. miscanthus, or those from co-products such as cereal
straw (20). Three major steps are involved in biomass-to-ethanol process; 1) biomass
pretreatment and fractionation, 2) enzymatic hydrolysis of cellulosic fraction, and 3)
fermentation of the derived sugars to ethanol. Many factors contribute to the overall costs of
producing biomass derived ethanol, however, the feedstock cost has been reported to be
among the highest (21). To reduce these costs, one of the possible ways forward is by making
use of underutilised biomass materials such as wheat straw from agricultural farms. In England,
there is a potential cereal straw supply of 5.27 million tons (Mt) from arable farm types; 3.82 Mt
are currently used and 1.45 Mt currently chopped and incorporated (22). Approximately 10 Mt
of cereals straw was generated from 3 million hectares of wheat, barley, and oats in 2015
(23,24). Of this, 75% of straw is used for animal bedding, 23% is chopped and recombined into
Chapter 1: Introduction
the soil, and 2% is used for the mushroom compost. Wheat straw is an example of lignocellulosic
biomass which comes from an agricultural by-product by harvesting the cereal grains. There
could be up to 1.4 million tons of wheat straw per annum available for the potential sectors such
as the biofuel industry in the UK alone (25). The variations in regional straw yields (t ha-1) have
a great effect on the England supply of straw and the potential amount of bioethanol that can
be produced. This shows that commercially competitive substrates are available. However,
biomass digestibility is still a major challenge. Thus, a few approaches still need to be improved;
1) to make biomass more digestible without compromising crops yield, and 2) to apply more
effective pretreatments and enzymes for bioethanol conversion (26).
1.3 LIGNOCELLULOSIC BIOMASS
Lignocellulosic biomass is an attractive resource for fuel and biochemical production due to its
abundance in nature. Waste biomass, the stalks of agriculture crops such as wheat and paddy,
corn stover and wood can serve as raw materials. One of the attractions of woody plant biomass,
or lignocellulose, is that it is rich in polysaccharides that can be converted into sugars for
fermentation. However, one of the reasons that lignocellulose is abundant is because it is hard
to break down into simple sugars due to its naturally durable structure. The plant cell wall is a
structure characterized by a network of polysaccharides, structural proteins, and phenolic
compounds. This network of polymers protects the plant against external stresses and provides
structural and mechanical support to plant tissues. It is biochemically resistant mainly due to
the presence of polyphenols called lignin that serve as protection and natural barrier of the
plant against hydrolytic enzymes produced by microorganism in nature (27). The chemical
composition and mechanical properties make plant cell walls a rich source of chemicals and
fermentable sugars for the production of biofuels as it is comprised of roughly 70%
polysaccharides that can potentially serve as a source of fermentable sugars (28). Plant cell walls
are classified as primary and secondary cell walls. Both are different in their physiological roles
as well as their chemical composition. Primary cell walls are located around dividing and
elongating cells which consists of a large proportion of polysaccharides (cellulose; 40-50%,
hemicelluloses; 20-40%, and pectin; 20-30%). Secondary cell walls are made up of cross-linked
hetero-matrix of cellulose, hemicelluloses, and lignin and are laid down on the interior of the
primary cell walls (Figure 1.4). The relative abundant of these three polymers varies depending
Chapter 1: Introduction
Plasma membrane Secondary cell wall Primary cell wall
Sym bols:
A
Lignin
___ i Pectin
^
Cellulose
/ X X * Hemicellulose
Figure 1.4: Illustration of a plant cell walls.
The features of the plant cell wall are shown. Relative thickness of the cell wall layers, relative
abundance and specific localization of the various cell wall components, such as pectin,
cellulose, hemicellulose, lignin and protein are illustrated. Image is reproduced from
Achuyathan et al., 2010 (30).
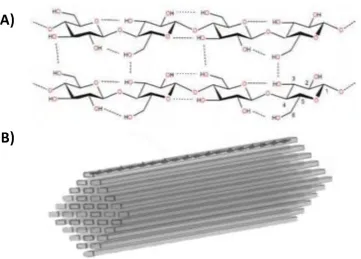
1.3.1 Cellulose
Cellulose is the main component of plant cell walls and the most abundant organic compound
in terrestrial ecosystems. A linear cellulose polysaccharide consists of hundreds to over ten
thousand P-1,4 linked glucose units (Figure 1.5A). The cellulose chains aggregate into
microfibrils via hydrogen bonding and van der Waals interactions shows in Figure 1.5B (31,32).
These microfibrils are crystalline, non-soluble, and challenging for enzymatic saccharification.
Consecutive sugars along chains in crystalline cellulose are rotated by 180 degrees, meaning
that the disaccharide (cellobiose) is the repeating unit. Cellulose tends to contain both well-
Chapter 1: Introduction
enzymatic degradation may contribute problems, one big advantage of cellulose is its
homogeneity. Complete depolymerization of cellulose yields just one product, glucose. Cellulose
deconstruction is critical to ecosystem functioning and the global carbon cycle. Only selected
lineages of fungi and bacteria have evolved the ability to efficiently degrade this highly
recalcitrant substrate (33).
A)
B)
Figure 1.5: Overview of cellulose structure.
A) Cellulose chain (partial structure) consists of glucose monomers depicting an internal network
of hydrogen bonds. The carbon numbering scheme is depicted on one glucosidic unit. Image is
reproduced from Hemsworth et al., 2013 (34). B) Simplistic sketch of a P-cellulose microfibril.
Parallel cellulose chains aggregate into crystalline structures called microfibrils. Illustration is
reproduced from Horn et al. (35).
1.3.2 Hem icellulose
Hemicelluloses are a large group of polysaccharides found in the primary and secondary cell
walls. Hemicelluloses are built up by pentoses (D-xylose, D-arabinose), hexoses (D-mannose, D-
glucose, D-galactose) and sugar acids (36). These are including P-glucan, xylan, xyloglucan,
arabinoxylan, mannan, galactomannan, arabinan and so on. The hemicelluloses found in cereal
Chapter 1: Introduction
glucomannans, while in hardwood xylans are most common. Hemicelluloses interconnect with
other cell wall components through covalent bonds and secondary forces (38). Both the
cellulose and hemicellulose can be broken down enzymatically into the component sugars which
may be then fermented to ethanol. Multiple classes of enzymes are required for effective
degradation of cellulose and hemicelluloses (39). The break down process involves enzymes like
glycoside hydrolases, carbohydrate esterases, polysaccharide lyases, endo- hemicellulases and
others, the concerted action of which hydrolyze glycosidic bonds, ester bonds and remove the
chain's substituents or side chains. These include endo-1,4-P-xylanase, P,-xylosidase, P-
mannanase, P-mannosidase, a-glucuronidase, a-L-arabinofuranosidase, acetylxylan esterase
and other enzymes (40).
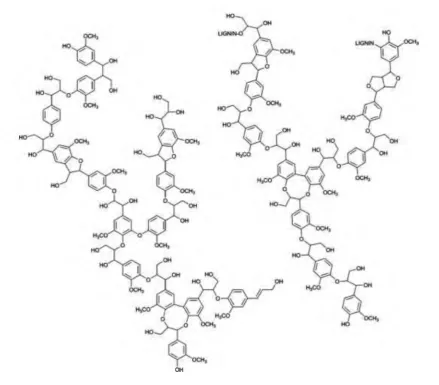
1.3.3 Lignin
While cellulose and hemicellulose are built from carbohydrates, the random structure in the
tridimensional network inside the cell which consists of lignin is built up by oxidative coupling of
three major C6-C3 (phenypropanoid) units, namely syringyl alcohol (S), guaiacyl alcohol (G), and
p-coumaryl alcohol (H) (41,42). Lignins are highly branched, substituted, mononuclear aromatic
polymers in the cell walls of certain biomass, especially woody species, and are often bound to
adjacent cellulose fibers to form a lignocellulosic complex (Figure 1.6). This complex and the
lignins alone are often quite resistant to conversion by microbial systems and many chemical
agents. The lignin-hemicellulose complex surrounds the cellulose with which it is bound through
extensive hydrogen bonding to form a supramolecular structure that protects the cellulose and
is the reason for biomass recalcitrance (30). Lignin is one of the most abundant natural polymers
expected to play an important role in the near future as a raw material for the production of
bio-products. Large amounts of lignin are produced each year by the pulp and paper industry as
by-products of delignification. The amount of lignin in plants vary widely, and is normally in the
range of 20-30% by weight (43). Lignin is an aromatic hetero-biopolymer role as the constituent
of an internal cell wall in all vascular plants including the herbaceous varieties. In the plant cell
wall, hemicelluloses serve as a connection between lignin and cellulose and gives the whole
cellulose-hemicelluloses-lignin network structure more rigidity besides 20 different types of
bonds present within the lignin itself (44). Owing to its cross linking, lignin in-situ is usually
Chapter 1: Introduction
04
Figure 1.6: Structure of lignin.
Unlike most natural polymers, such as cellulose and starch, which consist of a single monomer
and intermonomeric linkage, lignin is a network polymer made up by oxidative coupling of three
major C6-C3 (phenylpropanoid) units with many carbon-to-carbon and ether linkages, such as
P-0-4, 4-0-5, P-P, P-1, P-5, and 5-5' (45). It is covalently linked to polysaccharides, forming a
lignin-hemicellulose network made up of benzyl-ether, benzyl-ester, and phenyl-glycoside
bonds (44). Image is reproduced from Crestini et al., 2011 (46).
1.4 LIGNOCELLULOSE DIGESTION IN NATURE
Despite lignocellulose being a hard-to-digest structure, a range of animals and microbes can
digest lignocellulosic biomass in nature. Animals such as termites (47,48), beetles (49,50) and
marine wood borers (51,52) have evolved to live on a diet of lignocellulose. Microbes are the
main source of lignocellulose digestion in these animal systems and also serve to turn over
Chapter 1: Introduction
through the action of enzyme-mediated oxidative free radical attack of the lignin, exposing the
polysaccharides for hydrolytic enzyme attack. Many biomass-degrading organisms secrete
synergistic cocktails of individual enzymes with one or several catalytic domains per enzyme,
whereas a few bacteria synthesize large multi-enzyme complexes (cellulosomes) which contain
multiple catalytic units per complex (39,53). The cellulosomes present in obligate anaerobic
microbes contain many catalytic units per individual complex, linked to a single carbohydrate
binding module (CBM) bearing scaffoldin via cohesin-dockerin interactions (54,55). Although
lignocellulolytic fungi such as Aspergillus, Penicillium, Schizophyllum, Trichoderma,
Phanerochaete and Sclerotium species can secrete industrial quantities of extracellular
enzymes, bacterial enzyme production can be more cost-efficient (56).
1.4.1 Aerobic lignocellulolytic bacteria
The rapid growth and multi-enzyme complexes with increased functionality and specificity
ensure that the lignocellulolytic bacteria tolerate larger and more diverse environmental
stresses during lignocellulose decomposition and occupy wider niches than filamentous fungi
(57). A few bacterial species are currently known to degrade both cellulose and lignin. Among
them are member of the genera Pseudomonas (order Pseudomonadales), Streptomyces, as well
as Cellulomonas (order Actinomycetales) which are likely to employ extracellular laccases and
peroxidases to attack lignin (42,58,59). With respect to recent trends in lignocellulose
decomposition research, the broad studies conducted by scientists on laccases and peroxidases
have identified that aerobic lignocellulolytic microbes exhibit free and complex enzymes synergy
which require terminal or intermediate electron acceptors to support the decomposition under
limited carbon source conditions (60).
1.4.2 Glyosyl Hydrolases (GHs)
In Nature, the enzymatic deconstruction of cellulose and hemicellulose is achieved by the
orchestrated action of various carbohydrate-active enzymes (CAZymes), typically acting
together as a cocktail with synergistic activities and modes of action (61) (see Figure 1.7). GHs
are important enzymes that cleave glycosidic bonds that exist in cellulose and hemicellulose.
The capacity of GHs are aided by polysaccharide esterases that remove methyl, acetyl and
phenolic esters, permitting the GHs to break down hemicelluloses (62). Additionally,
Chapter 1: Introduction
More recently, the action of lytic polysaccharide monooxygenases (LPMOs) has been shown to
be critical for efficient cellulose hydrolysis by the oxidative cleavage of difficult to access glucans
on the surface of crystalline cellulose microfibrils (64,65). Across the Tree of Life, the GH cocktail
composition varies significantly in composition depending on the kingdom of the cellulolytic
organism, the evolutionary pressure, and the environmental niche of the cellulolytic habitats
(61). Lignocellulose-utilising creatures secrete some GHs, however most benefitted from a
mutualism relationship with their enzyme-secreting gut microflora, a particular example in
termites. However, in shipworms the system consists of GH-secreting and LPMO-secreting
bacteria that separate from the site of digestion, whereas, the isopod Limnoria solely relies on
endogenous enzymes (51,52).
Figure 1.7: Schematics of microbial mechanisms of lignocellulose degradation.
Aerobic cell-free cellulase system employed by most of bacteria and fungi. Cellulose is digested
via the synergistic interaction of individual GH and LPMO secreted enzymes. NR-, non-reducing
ends; -R, reducing ends. Image is reproduced from Cragg et al. (51).
1.4.3 Lytic polysaccharide M onooxygenase (LPMO)
Lytic polysaccharide monooxygenases (LPMOs) are a type of enzyme which requires a reducing
agent (either a small molecule reducing agent or cellobiose dehydrogenase), oxygen, and a
copper (Cu) ion bound in the active site for activity (57,66,67). The glycoside hydrolases, pectate
lyases, esterases and the new LPMOs are all often found as parts of multi-modular enzymes that
Chapter 1: Introduction
polymers (61,69). Since their discovery, LPMOs have become integral factors in the industrial
utilization of biomass, especially in the sustainable generation of cellulosic bioethanol (70).
LPMOs were originally designated as GH61 and CBM33, but now classified as Auxiliary Activity
(AA) 9, AA10 and AA11 in the CAZy database (69,71,72). The reclassification of GH61 to AA family
was based on the findings that although some GH61s appeared to have weak endoglucanase
activity, enzymes from this group could enhance enzymatic depolymerization of cellulose into
soluble sugars by GHs. The AA9 contains fungal enzymes and AA10 predominantly bacterial
enzymes (73). 3D structural analyses of lytic polysaccharide monooxygenases of both bacterial
AA10 (previously CBM33) and fungal AA9 (previously GH61) enzymes uncovered structures with
b-sandwich folds containing an active site with a metal coordinated by an N- terminal histidine
(68). LPMO are copper-containing enzymes (metalloenzymes) that depolymerize recalcitrant
polysaccharides by breaking down the glycosidic bonds and direct oxidative attack on the
carbohydrate polymer chains through a flat site with a centrally located copper atom (65).
LPMOs cleave the polysaccharide chain by utilising the oxidative capacity of molecular oxygen
to scission a glycosidic C-H bond. To break these bonds, LPMOs activate oxygen, in a reducing
agent dependent manner, at a copper-containing active site known as the histidine brace
(34,74,75). Working together with both canonical polysaccharide hydrolases and other electron
transfer compounds, these enzymes significantly boost the deconstruction of polysaccharides
into oligosaccharides. Consequently, they have real potential for improving the production of
Chapter 1: Introduction
1.4.4 Cellulom onas fim i ATCC® 484™
At a biochemical level, one of the best understood cellulose-degrading bacterial systems is
derived from Cellulomonas fimi. C. fim i is a Gram-positive coryneform bacterium, a group which
includes a range of cellulolytic facultative anaerobes. The C. fim i genome encodes an array of
glycosyl hydrolases (GHs) and Carbohydrate Active Enzymes (CAZymes) with similar numbers
(176 CAZymes) to those found in other cellulomonads (Cellulomonas Uda, Cellulomonas
flavigena and Cellulomonas sp. CS-1) but it has a slightly lower number of CAZymes compared
to other cellulase-secreting bacteria such as Fibrobacter succinogenes (190 CAZymes),
Streptomyces coelicolor (268 CAZymes), Streptomyces bigichenggensis (276 CAZymes), and
Streptomyces davawensis (337 CAZymes) (76). Despite the lesser number of CAZymes, previous
studies reported its proficiency and capability to utilize cellulose by expressing extracellular
cellulases which include exoglucanases (39,77-80), and endoglucanases (80,81) towards
digestion of diverse set of carbohydrates including crystalline cellulose, in vitro. From the
reported studies, 30 structures of proteins from C. fim i are available in the Protein Data Bank
(PDB) and 10 well-characterized enzymes have been fully reviewed in Universal Protein
Resource (UniProt KB) database (see Table 1.1) regarding to the mode of action of their catalytic
and carbohydrate-binding module of actions towards various of polysaccharides (82-85). C. fim i
is still of interest due to significant gaps in knowledge with regard to its ability to digest
recalcitrant lignocellulose. Interestingly, the C. fim i genome not reveal any homology to typical
cellulosome components such as scaffoldins, dockerins or cohesins which exists commonly in
facultative anaerobes enzymatic systems (86). This is in contrast with other reports where C.
fim i was reported to have a mutually exclusive approach by using both "secreted-enzyme" and
"surface-enzyme" strategies during cellulose digestion other than the reported carbohydrate-
binding proteins (87,88). This characteristic was only found in two cellulolytic facultative
Chapter 1: Introduction
Table 1.1: Characterized C. fim i proteins involving in polysaccharide degradation as listed in the UniProt KB database.
Reviewed C. fim i characterized proteins as curated in the UniProt KB database accessed in April, 2017.
UniProt ID
UniProt
Entry name Length Protein name
Gene
names Catalytic activity Protein family/CAZy References
P14090 GUNC_CELFA 1,101 Endoglucanase C cenC
Celf_1537
Endohydrolysis of (1->4)-P-D- glucosidic linkages in cellulose, lichenin and cereal P-D-glucans.
CBM4. Carbohydrate-
Binding Module Family 4.
GH9. Glycoside Hydrolase
Family 9.
(89-92)
P50899 GUXB_CELFA 1,090 Exoglucanase B cbhB cenE, Celf_3400
Hydrolysis of (1->4)-P-D-glucosidic linkages in cellulose and
cellotetraose, releasing cellobiose from the non-reducing ends of the chains.
CBM2. Carbohydrate-
Binding Module Family 2.
GH48. Glycoside Hydrolase
Family 48.
(77,93,94)
P50400 GUND_CELFI 747 Endoglucanase D cenD
Endohydrolysis of (1->4)-P-D- glucosidic linkages in cellulose, lichenin and cereal P-D-glucans.
CBM2. Carbohydrate-
Binding Module Family 2.
GH5. Glycoside Hydrolase
Family 5.
(93)
P07984 GUNA_CELFI 449 Endoglucanase A cenA
Endohydrolysis of (1->4)-P-D- glucosidic linkages in cellulose, lichenin and cereal P-D-glucans.
CBM2. Carbohydrate-
Binding Module Family 2.
GH6. Glycoside Hydrolase
Family 6.
Chapter 1: Introduction
...continued
UniProt ID
UniProt
Entry name Length Protein name
Gene
names C a t a ly t ic a c tiv ity Protein family/CAZy References
P26255 GUNB_CELFI 1,045 Endoglucanase B cenB
Endohydrolysis of (1->4)-P-D- glucosidic linkages in cellulose, lichenin and cereal P-D-glucans.
CBM2. Carbohydrate-
Binding Module Family 2.
CBM3. Carbohydrate-
Binding Module Family 3.
GH9. Glycoside Hydrolase
Family 9.
(81,97)
P50401 GUXA_CELFA 872 Exoglucanase A cbhA
Celf_1925
Hydrolysis of (1->4)-P-D-glucosidic linkages in cellulose and
cellotetraose, releasing cellobiose from the non-reducing ends of the chains.
CBM2. Carbohydrate-
Binding Module Family 2.
GH6. Glycoside Hydrolase
Family 6.
(93,98)
Q7WUL4 HEX20_CELFI 496
P-N- acetylhexosa-minidase
hex20
hex20A
Hydrolysis of terminal non reducing N-acetyl-D-hexosamine residues in N-acetyl-P-D-
hexosaminides.
GH20. Glycoside Hydrolase
Family 20. (99)
P54865 XYND_CELFI 644
Bifunctional xylanase/
deacetylase
xynD Endohydrolysis of (1->4)-P-D- xylosidic linkages in xylans.
CBM2. Carbohydrate-
Binding Module Family 2.
GH11. Glycoside Hydrolase
Chapter 1: Introduction
.continued
UniProt ID
UniProt
Entry name Length Protein name
Gene
names C a t a ly t ic a c tiv ity Protein family/CAZy References
P07986 GUX_CELFI 484 Exoglucanase/
xylanase cex xynB
Hydrolysis of (1->4)-p-D -
glucosidic linkages in cellulose
and cellotetraose, releasing
cellobiose from the non
reducing ends of the chains.
Endohydrolysis of (1->4)-p-D -
xylosidic linkages in xylans.
CBM2. Carbohydrate-
Binding Module Family 2.
GH10. Glycoside Hydrolase
Family 10.
(39,85,96,97,104 109)
Q7WUL3 NAG3_CELFI 564
P-N-acetylgluco- saminidase/b-glucosidase
nag3 nag3A
Hydrolysis of terminal non
reducing N-acetyl-D-
hexosamine residues in N-
acetyl-p-D-hexosaminides.
Hydrolysis of terminal, non
reducing p-D-glucosyl residues
with release of p-D-glucose.
GH3. Glycoside Hydrolase
References
References
1 Dudley B. British Petrol (BP) Energy Outlook 2017 Edition. 2017 [cited 29 April 2017]. Available from: http://www.bp.com/en/global/corporate/energy-economics/energy- outlook.html
2 Chung R. The Status of the Water-Food-Energy Nexus in Asia and the Pacific [Internet]. United Nations Economic and Social Commision for Asia and the Pacific. 2013 [cited 1 May 2017]. Available from: http://www.unescap.org/resources/status-water-food- energy-nexus-asia-and-pacific
3 Vogt KA., Patel-Weynand T., Shelton M., Vogt DJ., Gordon JC., Mukumoto CT. f, et al. Sustainability unpacked: Food, energy and water for resilient environments and societies. 1st ed. Sustainability Unpacked: Food, Energy and Water for Resilient Environments and Societies. Abigdon, Oxon: Earthscan; 2012. 1-306.
4 Waughray D. Water security: the water-food-energy-climate nexus: The World Economic Forum water initiative. Island Press; 2011. Pg 248.
5 Beddington J. Food, Energy, Water and The Climate: A Perfect Storm of Global Events? [Internet]. Government Office for Science. 2009 [cited 30 April 2017]. Available from: http://webarchive.nationalarchives.gov.uk/20121206120858/http://www.bis.gov.uk/a ssets/goscience/docs/p/perfect-storm-paper.pdf
6 Van Der Werf GR, Randerson JT, Giglio L, Collatz GJ, Mu M, Kasibhatla PS, et al. Global fire emissions and the contribution of deforestation, savanna, forest, agricultural, and peat fires (1997-2009). Atmos Chem Phys. 2010; 10(23): 11707-35.
7 Chen B, Bai Z, Cui X, Chen J, Andersson A, Gustafsson O. Light absorption enhancement of black carbon from urban haze in Northern China winter. Environ Pollut. 2017; 221: 418-26.
8 Pearson TRH, Brown S, Murray L, Sidman G. Greenhouse gas emissions from tropical forest degradation: an underestimated source. Carbon Balance Manag. 2017; 12(1): 3.
9 Chen X. The Greenhouse Metaphor and the Greenhouse Effect: A Case Study of a Flawed Analogous Model. 2012; Philos Cogn Sci. (2): 105-14.
10 Edenhofer, O., R. Pichs-Madruga, Y. Sokona, E. Farahani, S. Kadner K, Seyboth, A. Adler, I. Baum, S. Brunner, P. Eickemeier, B. Kriemann, J. Savolainen, S. Schlomer, C. von Stechow TZ and JC, (eds.) M, editors. IPCC, 2014: Climate Change 2014: Mitigation of Climate Change. Contribution of Working Group III to the Fifth Assessment Report of the Intergovernmental Panel on Climate Change. Cambridge, United Kingdom and New York, NY, USA.: Cambridge University Press, Cambridge, United Kingdom and New York, NY, USA.; 2014.
11 UEA. News Release: CO2 emissions set to reach new 40 billion tonne record high in 2014. Glob Carbon Proj. 2014; (0): 8-10.
References
13 South-East Asia's smog: Unspontaneous combustion [Internet], The Economists. 2013 [cited 30 April 2017]. Available from:
https://www.economist.com/news/asia/21580154-forest-fires-bring-record-levels-air-pollution-and-end-not-sight-unspontaneous
14 Perera FP. Multiple Threats to Child Health from Fossil Fuel Combustion: Impacts of Air Pollution and Climate Change. Environ Health Perspect. 2016; 125(April): 141-8.
15 Aradhna Wal. Toxic Air: Young Farmers Vs Old Guard on Crop Burning in Punjab, Haryana [Internet]. News18, India. 2016 [cited 20 Apr 2017]. Available from: http://www.news18.com/news/india/delhi-pollution-old-guard-in-punjab-haryana- fields-choking-efforts-to-clear-capital-air-1308314.html
16 Richard T. L. Challenges in Scaling Up Biofuels Infrastructure. Science. 2010; 329 (5993): 793-796.
17 Naik SN, Goud V V., Rout PK, Dalai AK. Production of first and second generation biofuels: A comprehensive review. Renew Sustain Energy Rev. 2010; 14(2): 578-97.
18 Aro EM. From first generation biofuels to advanced solar biofuels. Ambio. 2016; 45(1): 24-31.
19 Komendantova N. and Pachauri S. Renewables 2012 Global Status Report [Internet]. International Institute for Applied Systems Analysis. 2012 [cited 30 Apr 2017]. Available from: http://pure.iiasa.ac.at/10134/
20 Glithero NJ, Ramsden SJ, Wilson P. Barriers and incentives to the production of bioethanol from cereal straw: A farm business perspective. Energy Policy. 2013; 59(100): 161-71.
21 Burkhardt S, Kumar L, Chandra R, Saddler J. How effective are traditional methods of compositional analysis in providing an accurate material balance for a range of softwood derived residues? Biotechnol Biofuels. 2013; 6(90): 1-10.
22 Glithero NJ, Wilson P, Ramsden SJ. Straw use and availability for second generation biofuels in England. Biomass and Bioenergy. 2013; 55: 311-21.
23 Yuill A. Sustainable Straw Combustion of Straw for Combined Heat and Power [Internet]. 2016. Natural Power. Available from:
https://www.naturalpower.com/sustainable-straw/.
24 Wilson P, Glithero NJ, Ramsden SJ. Prospects for dedicated energy crop production and attitudes towards agricultural straw use: The case of livestock farmers. Energy Policy. 2014; 74: 101-10.
25 Roy J, Tucker GA, Sparkes DL. Wheat straw for biofuel production. [PhD project final report AHDB Cereals & Oilseed, RD-2007-3690] University of Nottingham; 2014.
26 Gomez LD, Steele-King CG, McQueen-Mason SJ. Sustainable liquid biofuels from biomass: the writings on the walls. New Phytol. 2008; 178(3): 473-85.