ABSTRACT
LESER, WILLIAM PAUL. Embedded Shape Memory Alloy Particles for the Self-Sensing of Fatigue Crack Growth in an Aluminum Alloy. (Under the direction of Fuh-Gwo Yuan.)
Future aerospace vehicles will be built using novel materials for mission conditions that are
difficult to replicate in a laboratory. Structural health monitoring and condition-based main-tenance will be critical to ensure the reliability of such vehicles. A multi-functional aluminum
alloy containing embedded shape memory alloy (SMA) particles to detect fatigue crack growth
is proposed. The regions of intensified strain near the tip of a growing fatigue crack cause the SMA particles to undergo a solid-to-solid phase transformation from austenite to martensite,
releasing a detectable and identifiable acoustic emission (AE) signal that can be used to locate
the crack in the affected component.
This study investigates the AE response of two SMA systems, Ni-Ti, and Co-Ni-Al. Tensile
(Ni-Ti) and compressive (Co-Ni-Al) tests were conducted to study the strain-induced
transfor-mation response in both of the alloy systems. It was found that the critical stress for trans-formation in both SMA systems was easily identified by a burst of AE activity during both
transformation and reverse transformation. AE signals from these experiments were collected
for use as training data for a Bayesian classifier to be used to identify transformation signals in a Al7050 matrix with embedded SMA particles.
The Al/SMA composite was made by vacuum hot pressing SMA powder between aluminum
plates. The effect of hot pressing temperature and subsequent heat treatments (solutionizing and peak aging) on the SMA particles was studied. It was found that, at the temperatures
re-quired, Co-Ni-Al developed a second phase that restricted the transformation from austenite to martensite, thus rendering it ineffective as a candidate for the embedded particles. Conversely,
Ni-Ti did survive the embedding process and it was found that the solutionizing heat treatment
applied after hot pressing was the main driver in determining the final transformation temper-atures for the Ni-Ti particles. The effect of hot pressing on the transformation tempertemper-atures
was negated upon solutionizing and peak aging occurred at a sufficiently low temperature to
as not affect the properties of the Ni-Ti.
Strain-induced transformation was confirmed in the Ni-Ti particles by digital image
corre-lation (DIC) using an environmental scanning electron microscope (ESEM). Specimens were
fatigue pre-cracked until a crack was produced and observed to be approaching a particle that could be monitored on the surface, at which point it was put into the ESEM for DIC under
tensile loading. Acoustic emission activity was observed during this experiment. In order to
pa-rameters calculated using the Hilbert-Huang transform (HHT). Using this classifier, AE signals
consistent with those arising from phase transformation in bulk Ni-Ti were identified during phase transformation in the particles as observed with DIC.
In addition to tensile crack growth in the ESEM, a fatigue crack was grown through a
specimen with particles interspersed along the specimen center line. Several low amplitude AE events were observed as the crack grew through the aluminum. As the fatigue crack passed
through the line of particles AE events increased dramatically in rate of occurance and
am-plitude. Amplitudes were 6-10 times higher as the crack passed near the particles. These AE events were also shown to be consistent with Ni-Ti phase transformation.
A successful proof-of-concept was demonstrated for an aluminum alloy with embedded
c
Copyright 2014 by William Paul Leser
Embedded Shape Memory Alloy Particles for the Self-Sensing of Fatigue Crack Growth in an Aluminum Alloy
by
William Paul Leser
A dissertation submitted to the Graduate Faculty of North Carolina State University
in partial fulfillment of the requirements for the Degree of
Doctor of Philosophy
Aerospace Engineering
Raleigh, North Carolina
2014
APPROVED BY:
Kara Peters Xiaoning Jiang
Maurice Balik John Newman
Fuh-Gwo Yuan
DEDICATION
In loving memory of Kathy Yaksich (“Nana”) for instilling in me a love of science and
BIOGRAPHY
William“Paul” Leser was born in Green Bay, WI and grew up in Germantown, MD and Raleigh,
NC. After a two year“tour” of various university departments, beginning in International Re-lations and continuing to Computer Science with a brief stop in the History department, Paul
finally settled into the Aerospace Engineering program at North Carolina State University,
graduating with a B.S. in 2008. He remained at NCSU to pursue a Ph.D. and accepted a graduate fellowship through NASA Langley Research Center resulting in a M.S. in Aerospace
Engineering in 2010. In 2012, Paul accepted a civil service position at NASA LaRC while he
ACKNOWLEDGEMENTS
I would like to thank my beautiful wife Rebecca for her unending love and support. I would
also like to thank my parents, Ed and Kate, for all of their love and sacrifices in raising my brother and I. I couldn’t have done it without you.
I am very grateful for this opportunity provided to me by my academic advisor, Dr.
Fuh-Gwo Yuan, and NASA mentor, Dr. John“Andy” Newman. I would also like to thank everyone in the Durability, Damage Tolerance, and Reliability Branch who has assisted me in this work
with direction, discussion, and/or general advice, including Jacob Hochhalter, Vipul Gupta,
Will Johnston, Terryl Wallace, Jonathan Ransom, Rick Ross, Ed Glaessgen, and Steve Smith. A huge thank you to the guys in the Light Alloy Lab for all the material processing assistance,
Harold“Clay” Claytor, Pete Messick, Joel Alexa, Jim Baughman and Stewart Walker.
Thank you to my brother Patrick and his wife-to-be Amanda and many thanks to all my extended family on both the Leser and Yaksich sides. I am lucky to have had all of you in my life.
I would also like to thank all of my friends for providing an outlet away from work, especially
my band mates Patrick and David. Playing music with you guys helped me to keep my sanity! Many thanks to Bruce, Stanton, Donald and Pedro for providing a much needed escape at
times. Hopefully we’ll all get together again soon! Thanks to Mac, Charlie, and Joseph, for
TABLE OF CONTENTS
LIST OF TABLES . . . .viii
LIST OF FIGURES . . . ix
Chapter 1 Introduction . . . 1
Chapter 2 Shape Memory Materials . . . 5
2.1 Introduction . . . 5
2.2 Shape Memory Alloys . . . 5
2.2.1 The Discovery of Shape Memory Alloys . . . 5
2.2.2 The Shape Memory Effect . . . 6
2.2.3 Pseudoelasticity . . . 8
2.2.4 Constitutive Models for Shape Memory Alloys . . . 11
2.2.5 Applications of Shape Memory Alloys . . . 16
2.2.6 Shape Memory Alloys used for Structural Health Monitoring and Damage Supression in Fiber-Reinforced Polymer-Matrix Composites . . . 21
2.3 Magnetic Shape Memory Alloys . . . 25
2.3.1 The Shape Memory Effect in Magnetic Shape Memory Alloys . . . 25
2.3.2 Constitutive Modeling of Magnetic Shape Memory Alloys . . . 27
2.3.3 Applications of Magnetic Shape Memory Alloys . . . 28
2.4 Shape Memory Polymers . . . 29
2.4.1 The Shape Memory Effect . . . 29
2.4.2 Applications of Shape Memory Polymers . . . 30
2.5 Shape Memory Alloys and Polymers - A Comparison . . . 30
Chapter 3 Acoustic Emission Background and Theory . . . 32
3.1 An Introduction to Acoustic Emission Monitoring . . . 32
3.2 Acoustic Emission Sensing Materials and Devices . . . 33
3.2.1 Piezoelectric Sensors . . . 33
3.2.2 Magnetostrictive Sensors . . . 34
3.2.3 Fiber Optic Sensors . . . 35
3.2.4 Laser Vibrometer . . . 36
3.3 Applications of Acoustic Emission Monitoring . . . 37
3.4 Theoretical Representation of an Acoustic Emission Source . . . 38
3.5 Finite Element Modeling of Acoustic Emission Sources . . . 40
3.6 Source Location . . . 41
3.7 Summary . . . 41
Chapter 4 An Acoustic Emission Study of the Strain-Induced Phase Trans-formation in Shape Memory Alloys . . . 43
4.1 Introduction . . . 43
4.2.1 Specimen Preperation . . . 44
4.2.2 Acoustic Emission Testing . . . 44
4.2.3 Mechanical Testing . . . 44
4.3 Results and Discussion . . . 48
4.4 Summary and Conclusions . . . 51
Chapter 5 Strain-Induced Transformation in an Aluminum 7050 and Ni-Ti Composite Material . . . 54
5.1 Introduction . . . 54
5.2 Experimental Procedure . . . 56
5.2.1 Specimen Preparation . . . 56
5.2.2 Fatigue Testing . . . 56
5.2.3 Digital Image Correlation and Acoustic Emission in an Environmental Scanning Electron Microscope . . . 58
5.3 Results and Discussion . . . 60
5.3.1 Material Processing . . . 60
5.3.2 Fatigue Crack Growth . . . 65
5.3.3 DIC . . . 67
5.4 Summary and Conclusions . . . 70
Chapter 6 Bayesian Pattern Classification of Acoustic Emission Arising From Strain-Induced Transformation in an Aluminum 7050 and Ni-Ti Composite Material Using the Hilbert-Huang Transform . . . 73
6.1 Introduction . . . 73
6.2 Theory . . . 75
6.2.1 The Hilbert-Huang Transform . . . 75
6.2.2 Bayesian Decision Theory . . . 79
6.3 Results and Discussion . . . 81
6.3.1 HHT Analysis . . . 81
6.3.2 Classification Results . . . 86
6.4 Summary and Conclusions . . . 88
Chapter 7 Summary and Conclusions . . . 90
7.1 Summary . . . 90
7.2 Conclusions . . . 92
7.3 Future Work . . . 93
References. . . 95
Appendices . . . .104
Appendix A Calculation of the Gibbs Free Energy . . . 105
Appendix B Band-limited Green’s Functions for Quantitative Evaluation of Acoustic Emission using the Finite Element Method . . . 108
B.1 Introduction . . . 108
B.2 Theory . . . 109
B.2.2 Finite Element Representation of an Acoustic Emission Source . . . 111
B.2.3 Calculation of the Dynamic Green’s Function . . . 113
B.2.4 Calculation of the Moment Tensor and Source-Time Dependence . . 116
B.3 Numerical Examples . . . 117
B.3.1 Estimation of the Dynamic Green’s Function . . . 117
B.3.2 Source Characterization . . . 117
LIST OF TABLES
Table 2.1 Material parameters for numerical examples . . . 17
Table 2.2 Shape memory materials* . . . 31
Table 5.1 Vickers hardness (HV) for Al7050 matrix . . . 64
Table B.1 Model parameters for FEM analysis. . . 112
Table B.2 Calculated dipole strengths . . . 121
Table B.3 Source and sensor locations for DEN model . . . 123
LIST OF FIGURES
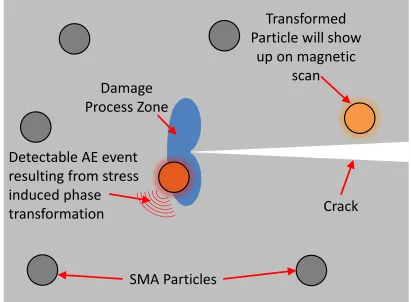
Figure 1.1 Schematic of the sensory alloy concept. Embedded SMA particles undergo a phase transformation in the presence of high strains near a fatigue crack. This phase transformation emits energy that can be detected in the form of
acoustic emission. . . 2
Figure 2.1 Schematic of martensitic and reverse transformations . . . 7
Figure 2.2 The shape memory effect: stress-strain-temperature behavior . . . 8
Figure 2.3 Schematic of the phase transformations underlying the shape memory effect 9 Figure 2.4 Schematic of the effect of stress on the martensitic and reverse transformations 9 Figure 2.5 Typical stress-strain curves for quasiplastic behavior, pseudoelastic behav-ior, and plastic deformation . . . 10
Figure 2.6 Comparison of Boyd-Lagoudas, Brinson, and MAS models. Quasi-plastic behavior at T = 20◦C . . . 16
Figure 2.7 Comparison of Boyd-Lagoudas, Brinson, and MAS models. Pseudoelastic behavior at T = 60◦C . . . 18
Figure 2.8 Comparison of stress-strain curves for pseudoelastic Nitinol, bone, tendon tissue and stainless steel . . . 19
Figure 2.9 A Nitinol stent [courtesy of Merit Medical Systems, Inc.] . . . 20
Figure 2.10 Eye glasses with a flexible Nitinol frame . . . 20
Figure 2.11 Lattice structure of MSMA austenite and martensite phases . . . 26
Figure 2.12 Schematic of the magnetic shape memory effect . . . 27
Figure 2.13 Schematic of a MSMA bone plate . . . 29
Figure 2.14 Schematic of a MSMA spinal traction device . . . 30
Figure 3.1 Schematic of wide-band PZT acoustic emission sensor . . . 34
Figure 3.2 Schematic of magnetostrictive acoustic emission sensor . . . 35
Figure 3.3 Schematic of fiber optic acoustic emission sensor . . . 36
Figure 3.4 Schematic of beam path for laser Doppler vibrometer . . . 37
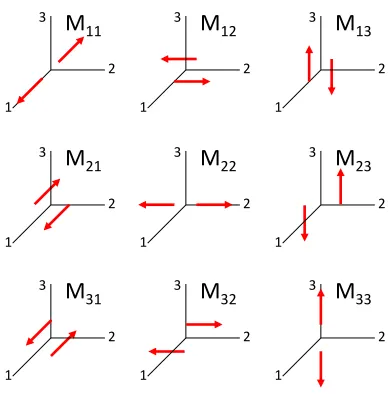
Figure 3.5 Force dipoles and couples corresponding to the moment tensor . . . 39
Figure 4.1 (a) Vacuum hot press used to consolidate Ni-Ti powder in panels for tensile testing. (b) Induction furnace used to make Co-Ni-Al. Individual elements are melted in the crucible, heated by the induction coils and then poured into the graphite mold. . . 45
Figure 4.2 Schematic of rapid quench furnace developed for annealing of Co-Ni-Al . . . 45
Figure 4.3 Schematic of the data acquisition system used to capture and record AE events . . . 46
Figure 4.4 Test configuration for the tensile testing of Ni-Ti specimens . . . 47
Figure 4.5 Dimensions of bulk Ni-Ti tensile specimens . . . 47
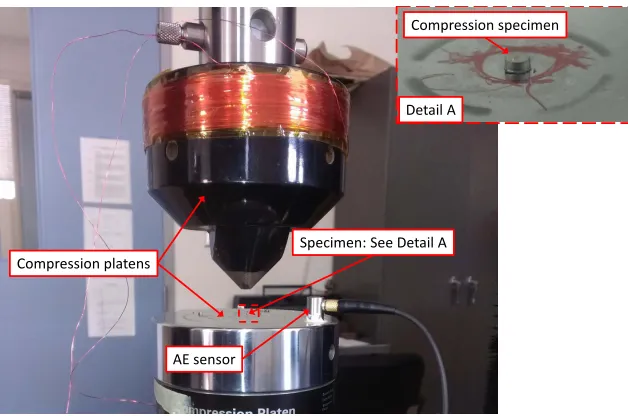
Figure 4.6 Test configuration for the compression testing of Co-Ni-Al specimens . . . . 48
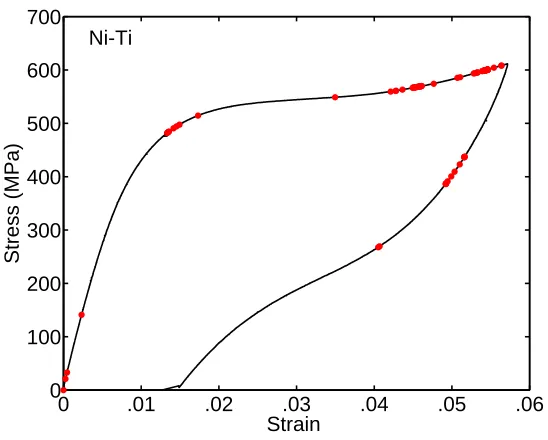
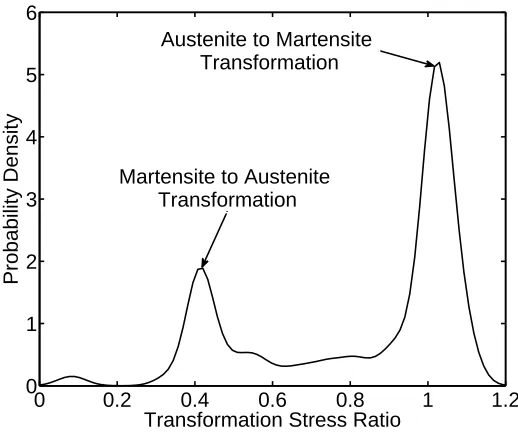
Figure 4.8 Typical stress versus strain curve for Co-Ni-Al in compression. Red dots signify captured AE events. . . 49 Figure 4.9 Kernel-smoothed density plot for the transformation stress ratio of captured
AE events during tensile tests on Ni-Ti specimens . . . 50 Figure 4.10 Kernel-smoothed density plot for the transformation stress ratio of captured
AE events during compression tests on Co-Ni-Al specimens . . . 51 Figure 4.11 DIC principal strain results for a typical Ni-Ti test. Load increases from (a)
to (d). The white bars represent the 1-D approximate location of recorded AE events. (c) contains markers for four separate AE hits that occurred in rapid succession at a rate faster than the DIC photograph frequency. . . 52 Figure 4.12 Global stress versus strain curve and associated DIC image locations for the
Ni-Ti specimen shown in Figure 4.11 . . . 53 Figure 4.13 (a) Molecular dynamics model of a Ni-Al SMA containing 384,000 atoms. (b)
Results of simulation of the compressive strain-induced phase transformation in Ni-Al. . . 53
Figure 5.1 SMA/aluminum composite panels are created by hot pressing SMA powder between two Al7050 panels. Specimens are then cut from the thickness of the panel, leaving a line of SMA particles down the centerline of the specimen. 57 Figure 5.2 Schematic of an aluminum SEN specimen with Ni-Ti particles on the centerline 57 Figure 5.3 Configuration of single edge notch specimen cut from thickness of sensory
alloy panel. A line of SMA particles can be seen on the surface running perpendicular to the direction of crack growth. . . 58 Figure 5.4 ESEM image of e-beam lithography DIC pattern on an embedded Ni-Ti
particle . . . 59 Figure 5.5 Microstructure of Co-Ni-Al sample (a) annealed at 1250◦C and (b) fully
solutionized at 1350◦C. β is the parent austenite phase. . . 60 Figure 5.6 Formation of the γ-phase in Co-Ni-Al confirmed by XRD . . . 61 Figure 5.7 Change in the transformation temperatures for Ni-Ti subjected to different
annealing temperatures. The dashed lines represent the transition tempera-tures of the as-pressed material. Points are taken at the peaks of the DSC curve between the respective martensite and austenite transformation tem-peratures. . . 62 Figure 5.8 (a) EBSD map of an embedded Ni-Ti particle in an aluminum alloy 7050
matrix. (b) ESEM image of an embedded Ni-Ti particle. . . 62 Figure 5.9 Fracture surfaces of the sensory alloy hot-pressed at 600◦C (a) before and
(b) after solutionizing at 490◦C. Ductility was greatly improved by solution-izing as can been seen between the brittle fracture surface in (a) and ductile fracture surface in (b). . . 63 Figure 5.10 Debonding around two particles occurs in a sensory alloy specimen hot
pressed at 490◦C. Failure then proceeded along aluminum-aluminum interface. 64 Figure 5.11 Diffusion zone formed around Ni-Ti particle during embedding process . . . 64 Figure 5.12 Failure of a sensory alloy specimen VHP at 525◦C, solutionized and peak
Figure 5.13 DSC curves showing the martensite transformation behavior for all stages of processing. Solutionizing alters the transformation temperatures while peak aging has no effect. . . 66 Figure 5.14 DSC curves showing the martensite transformation temperatures for
ma-terial hot-pressed at 490◦C and 600◦C and solutionized/peak aged. Both samples end up with nearly identical transformation behavior as a result of the solutionizing process. . . 66 Figure 5.15 Left axis: Fatigue crack length versus cycle count. The location of the Ni-Ti
particles is indicated by the red dotted line. Right axis: AE amplitude versus cycle count. . . 67 Figure 5.16 (a) A typical signal generated during fatigue crack growth in Al7050. (b) A
typical signal generated during fatigue crack growth near Ni-Ti particles. . . 68 Figure 5.17 X-ray micro-CT image of a fatigue crack growing through a region of Ni-Ti
particles. The Al7050 matrix has been removed from the image. . . 68 Figure 5.18 Globally applied load versus average principal strain in a Ni-Ti particle
embedded in an Al7050 matrix. (a) - (f) represent the loads at which specific DIC results are shown in Figure 5.19. . . 69 Figure 5.19 DIC results showing the evolution of the full-field strain as strain-induced
transformation begins in the Ni-Ti particle. A strain of 0.5% represents the critical strain for transformation in the Ni-Ti. Regions that have reached or exceeded the critical strain for transformation are shown in red. . . 70 Figure 5.20 Image captured during testing of sensory alloy specimen. The Ni-Ti can be
seen debonding from the Al matrix at an applied load of 165 MPa. . . 71
Figure 6.1 An example of the EMD method. (a) shows the first step of the sifting process for the first IMF. The mean of the envelope of signal S0 is found
(m1, shown in green) and (b) subtracted from S0 resulting in h1. (c) the
sifting process is repeated untilhn satisfies the conditions of an IMF. (d) the
first IMF,c1, of signal S0. . . 76
Figure 6.2 A comparison between the calculated frequency centroid for a buried dipole at various depths in an aluminum disk. The value calculated using the Fast Fourier Transform (FFT) varies widely based on source depth, while the val-ues calculated from the first IMF found via the HHT remain nearly constant despite source depth. . . 79 Figure 6.3 A schematic of a Bayesian classifier. Training data is used to determine
rele-vant parameters and train the classifier by calculating discriminant functions which are then used to classify experimental data. . . 81 Figure 6.4 Typical signal and decomposed intrinsic mode functions for AE events
gen-erated during the strain-induced phase transformation in Ni-Ti . . . 82 Figure 6.5 Plot of the mean energy versus mean period for each IMF as compared to
the 95% confidence bounds for white noise. IMFs that fall outside of the confidence bounds are statistically significant. . . 83 Figure 6.6 Instantaneous frequency and corresponding frequency amplitude for a
Figure 6.7 (a) a detailed example of an IMF, (b) its associated instantaneous frequency and (c) frequency amplitude . . . 85 Figure 6.8 Comparison of distributions of frequency centroid and peak frequency for
IMFs from AE signals generated during strain-induced phase transformation in Ni-Ti (red) and tensile cracking in a Al7050 specimen (blue) . . . 87 Figure 6.9 AE events arising from strain-induced transformation in Ni-Ti during ESEM
testing are shown corresponding to the globally-applied load at which they were captured with respect to the observed principal strain in the Ni-Ti particle. Events do not necessarily arise from the observed particle, but they do occur at loads at which multiple particles should have been beginning to transform based on the critical strain for transformation in the Ni-Ti. . . 88 Figure 6.10 AE events arising from strain-induced transformation in Ni-Ti during fatigue
crack growth testing are shown corresponding to the fatigue crack length at which they were captured with respect to the number of cycles. . . 89
Figure B.1 Point source and sensor locations in a general elastic body . . . 110 Figure B.2 Force dipoles and double couples corresponding to the moment tensor . . . . 111 Figure B.3 Comparison between a finite element generated AE signal and an
analyti-cally derived signal in a 25 mm thick steel disk from Hamstad (1999) . . . 113 Figure B.4 Schematic of geometry and boundary conditions for axi-symmetric finite
element model used for comparison with analytical solution . . . 114 Figure B.5 Schematic of geometry and boundary conditions for axi-symmetric finite
element model used for numerical estimation of the Green’s function for a buried dipole source . . . 118 Figure B.6 Three source-time functions used to simulate buried dipoles in an aluminum
plate . . . 119 Figure B.7 Case 1: Comparison between a finite element generated AE signal and the
same signal calculated using the band-limited Green’s function . . . 119 Figure B.8 Case 2: Comparison between a finite element generated AE signal and the
same signal calculated using the band-limited Green’s function . . . 120 Figure B.9 Case 3: Comparison between a finite element generated AE signal and the
same signal calculated using the band-limited Green’s function . . . 120 Figure B.10 Comparison between prescribed and recovered source-time functions for three
dipole sources . . . 121 Figure B.11 Comparison between prescribed and recovered source-time functions for three
dipole sources after normalization of the recovered functions . . . 122 Figure B.12 Schematic of geometry and boundary conditions for finite element model of
DEN specimen used for tensile crack sources . . . 123 Figure B.13 Comparison between a reference and recovered source-time function from a
three dimensional tensile crack source. The impact of an improved initial guess on the accuracy of the solution is demonstrated by the difference be-tween the initial calculation shown in blue and the refined calculation shown in red. . . 124 Figure B.14 Reference and recovered source-time functions for an out-of-plane tensile
Chapter 1
Introduction
Aerospace vehicles are susceptible to structural damage due to wear and fatigue from the service conditions encountered during operation. The safety of these vehicles depends on the ability
of inspection methods to reliably detect structural damage before reaching a critical state.
The ability of current nondestructive evaluation (NDE) methods to detect the early stages of fatigue damage is limited by the physics of the material and limited access to some areas of the
airframe. Current structural health management practices rely on a damage tolerance approach
using laboratory data and estimates of worst-case conditions to predict remaining useful life and set inspection schedules. Uncertainty in material properties, in-service loading conditions,
and damage progression model parameters leads to over-design of aerospace structures,
overly-conservative inspection regimes, and unnecessary part replacement [1, 2]. The current structural health management approach also hinders the implementation of novel material systems. Any
novel material requires an extensive (and often expensive) test regime for certification, thus
delaying their implementation. This problem is further compounded by the fact that the environments these materials are designed for are often not easily reproducible in the laboratory.
A possible solution is to perform on-line structural health monitoring. Such a system would
allow for in-situ inspection of critical components, allowing for full inspection intervals to be defined based on service conditions of individual vehicles rather than relying on worst-case
estimates. The objective of this study is to develop an on-line health monitoring system using
sensors that are integral to the structure being monitored. The proposed system consists of an aluminum alloy modified with embedded sensory particles, referred to herein as a sensory alloy.
The sensory particles are interrogated with passive acoustic emission (AE) sensors.
A shape memory alloy (SMA) has been selected to act as the sensory particles in the sensory alloy. The shape memory effect is the product of a phase transformation between a low
material properties of SMAs and the current state of the art in the structural applications
of this material class is presented in Chapter 2. A schematic of the sensory alloy concept is shown in Figure 1.1. Small particles of SMA ranging from 100-150 µm are embedded in an aluminum matrix. As a fatigue crack advances through the matrix, the region of high strain
near the crack-tip forces a phase transformation in the SMA. The energy released during this phase transformation can then be detected on the surface of the component using traditional
passive AE sensors. An introduction to the field of AE is given in Chapter 3, including an
overview of sensors, applications, theory and modeling. In addition to AE, if the particles are from a subclass of SMAs known as magnetic shape memory alloys (MSMAs) (see Chapter 2),
then the phase transformation will also produce a change in magnetic properties that can be
detected by further inspection using traditional NDE techniques such as eddy current methods. A discussion of the magnetic response of the particles is outside the scope of the present study.
SMA Particles
Crack
Damage
Process Zone
Transformed
Particle will show
up on magnetic
scan
Detectable AE event
resulting from stress
induced phase
transformation
There are three overarching technical challenges to be addressed in the development of the
proposed sensory alloy:
1. Material Processing
2. Identifying the SMA phase transformation via AE
3. Inducing phase transformation in the SMA with a fatigue crack growing in the matrix
The correlation between phase transformation and AE activity is investigated in Chapter 4.
The strain-induced phase transformation was monitored for both candidate SMAs. In order to isolate the AE emanating from phase transformation, tests were conducted on bulk specimens
without the presence of a crack. This eliminated the possibility for obtaining AE events from
cracking in the matrix. The AE response of the aluminum matrix was investigated separately as to obtain an AE profile for events that could be expected to emanate from the matrix.
The material properties governing the shape memory effect in SMAs are sensitive to
com-positional changes and are heavily influenced by heat treatment. Therefore every step of the embedding process has the potential to shift these properties in a potentially undesirable
man-ner. Two candidate SMA systems are investigated in Chapter 5 along with their response to
heat treatment and a possible embedding process for laboratory specimens. Specimens were prepared with a vacuum hot press (VHP) at various temperatures ranging from 475◦Cto 600◦C. Subsequent heat treatments followed by water quenches were conducted after hot pressing to
optimize the properties of the SMA/aluminum composite. Changes in the SMA properties were tracked with differential scanning calorimetry (DSC). This was followed by the testing
of embedded SMA particles in an aluminum matrix. The specimens were designed such that
some particles are visible on the surface on the centerline of the specimen (perpendicular to the direction of crack growth). Single edge notch (SEN) specimens were pre-cracked such that a
fatigue crack can be seen approaching the line of SMA particles on the surface. The pre-cracked
specimen is then loaded in tension using a small screw-driven load frame in an environmental scanning electron microscope (ESEM). The strain in the particle is measured using digital
im-age correlation (DIC) and an AE sensor is attached to the specimen to capture any AE activity.
Constant ∆K fatigue crack growth tests were also conducted to observe differences in crack growth behavior and AE activity for a fatigue crack growing in a region with embedded SMA
particles as opposed to growing through commercial aluminum.
In Chapter 6, a statistical pattern classification scheme was derived based on Bayesian
decision theory to isolate AE events during laboratory testing of the composite material. AE
signals from the bulk SMA and aluminum were used as training data sets to calculate the decision bounds using parameters derived from the instantaneous frequency of captured events
distinguish transformation AE events from extraneous events in the matrix during the testing
described in Chapter 5.
The final chapter summarizes the work that has been done and conclusions that have been
made. AE activity has been linked to strain-induced phase transformations in SMAs which
are triggered by high strains near a fatigue crack-tip. Using frequency parameters from the captured signals, AE originating from SMA phase transformation can be distinguished from
those originating in the matrix. A discussion of the next steps in the development of sensory
Chapter 2
Shape Memory Materials
2.1
Introduction
Shape memory alloys (SMAs) and polymers (SMPs), are a class of materials that exhibit a shape memory effect (SME) - the ability to recover a pre-deformed shape after a large
defor-mation. SMAs and SMPs respond to various stimuli, depending on the material, such as light,
heat, water, electricity, and certain chemicals, which cause them to revert to their original shape [3]. SMAs also contain a sub-class known as magnetic shape memory alloys (MSMAs).
Shape memory alloys and polymers both exhibit the shape memory effect, but the underlying
mechanism of each is vastly different and each one comes with advantages and disadvantages for a given application. SMPs have a lower density than SMAs making them much lighter.
SMPs are also cheaper and easier to manufacture and process. SMAs, however, have a recovery
force that is typically an order of magnitude or more greater than that of SMPs, making SMAs much more effective as actuators [3]. This chapter will examine each class of SMAs and SMPs
including the history, the underlying mechanism for the SME, and the current applications for each.
2.2
Shape Memory Alloys
2.2.1 The Discovery of Shape Memory Alloys
The shape memory effect was first observed in 1932. While working on completing the phase diagram for gold-cadmium, Arne ¨Olander came across a composition that “was so elastic that
it almost reminded of rubber [4, 5].” Later, in 1938, Greninger and Mooradian noted the
appearance and disappearance of a martensite phase in a copper-zinc compound that occurred due to changing temperatures [5]. The term “shape recovery” was coined by Chang and Read
Nitinol (short for Nickel-titanium Naval Ordnance Laboratory), perhaps the most common
shape memory alloy, was discovered in 1959 by William J. Buehler at the Naval Ordnance Laboratory [6, 7]. Buehler was working on finding a suitable alloy of nickel-titanium for use in
the nose cone of a Navy missile. After making several bars of Ni-Ti in an arc-melting furnace,
Buehler purposely dropped a bar that was near room temperature onto the floor as quick way to test the damping capacity of the metal. Hoping to hear a clear ringing sound, he became
concerned when he was greeted with a dull thud instead. Thinking that perhaps the arc-melting
process had somehow changed the properties of the alloy, Buehler took one of the bars that was still hot and dropped it on the floor. This time the impact produced a clear ringing response.
He quickly took the bar and ran to a water fountain to cool it to room temperature and then
dropped it again. This time the impact was accompanied by the same dull thud as before. This change in acoustic properties with temperature was the first indication that a major structural
change was taking place in the alloy in a small temperature window [6, 8].
It was not until two years later that the shape memory effect of Nitinol was discovered. Buehler’s metallurgical assistant, Raymond C. Wiley, took a thin strip of Nitinol to a meeting
with management to use as a prop. During the meeting, the strip of Nitinol was passed around
the room and bent repeatedly to demonstrate the alloy’s flexibility and fatigue resistance. One of the attendees, Dr. David S. Muzzey, decided to see what effect temperature had on the
Nitinol. He heated it with his pipe and the folded Nitinol strip unfolded itself back into its original shape [8]. The potential of a metal alloy that could recover its original shape after
being deformed was immediately recognized and Dr. Frederick E. Wang, an expert in crystal
physics, joined Buehler in 1962 to determine how the shape memory effect in Nitinol worked. From the work of Buehler, Wiley, and Wang, an understanding of the shape memory properties
of Nitinol was developed that paved the way for the many commercial applications of the alloy
today [8].
2.2.2 The Shape Memory Effect
Shape memory alloys (SMAs) are a class of alloys that display several unique properties,
in-cluding the shape memory effect and pseudoelasticity. The underlying mechanism of the shape
memory effect in SMAs is a material phase change from martensite to austenite and is shown schematically in Figure 2.1. The high temperature austenite phase (shown in red) has a
highly-symmetric structure, usually cubic. The martensitic phase transformation involves a
diffu-sionless shift of atoms from the cubic austenite phase into a low-symmetry, low temperature martensite (shown in blue) phase. The martensite phase is made up of several self
austenite are governed by four transition temperatures, the martensite start temperature,Ms,
the martensite finish temperatureMf, and the austenite start and finish temperatures,As and
Af. When temperature, T < Mf, the alloy will be fully martensitic. During heating, when
T > As, the phase change from martensite to austenite will begin and when T > Af, the
material will be fully austenitic. Upon cooling, the alloy will begin the phase transition back to martensite as the temperature falls belowMs.
Temperature
Mf Ms As Af
Fr
ac
tio
n o
f M
art
en
sit
e
(
ξ
)
1
0
Martensite
Austenite
Figure 2.1: Schematic of martensitic and reverse transformations
The shape memory effect is caused by the relationship between the transition temperatures and stress and strain. At a temperature, T, such that T < Mf, the SMA is in the martensite
phase and can be easily deformed to several percent strain. Unloading results in a residual
strain as shown in Figure 2.2. This is called quasiplastic stress-strain behavior. Heating the alloy to T > Af induces the phase change from martensite to austenite. During this phase
change the alloy will recover the residual strain (any plastic slip of the martensite phase cannot
be recovered) and return to its pre-deformed shape. Upon cooling it will undergo another phase change back to martensite [9, 5, 10]. The underlying change in the lattice structure of the SMA
is shown in Figure 2.3.
One-way vs. Two-way Shape Memory
as the one-way shape memory effect. An SMA can also be trained to exhibit a two-way shape
memory effect by constraining the material in the desired shape while thermally cycling it. This constrained thermal cycling introduces dislocations that persist in both phases, allowing the
SMA to remember a low temperature shape as well as the high temperature shape. At this
point, when the SMA is heated, it will recover its high temperature shape. As it cools, the dislocations disrupt the martensite formation, forcing a return to the low temperature shape
[10].
Mf Ms
As Af
St
re
ss
Strain Martensite
(twinned)
Martensite (deformed)
Austenite
Figure 2.2: The shape memory effect: stress-strain-temperature behavior
2.2.3 Pseudoelasticity
Increasing stress on the SMA is analogous to increasing its transformation temperatures as
shown in Figure 2.4. Thus, it is possible for the martensite transformation to be strain-induced
at temperatures aboveMs. Known as the pseudoelastic effect, an SMA atT > Af has a critical
stress level, beyond which martensite will begin to form resulting in a plateau in the
stress-strain behavior as shown in Figure 2.5. Because the martensite phase is unstable atT > As, the
SMA will transform back to austenite as it is unloaded, recovering its original shape. There is a temperature at which the critical stress will exceed yield stress and the pseudoelastic response
Martensite (twinned)
Austenite Martensite (deformed)
Heat ε
Figure 2.3: Schematic of the phase transformations underlying the shape memory effect
Temperature
Fr
ac
tio
n o
f M
art
en
sit
e
(
ξ
)
1
0
Martensite
Austenite increasing
stress
T0 σ = 0
σ > 0
As
Af
Str
ess (
MP
a)
Strain (%)
Ms
Mf
200 400 600 800 1000 1200
2 4 6
2.2.4 Constitutive Models for Shape Memory Alloys The Brinson Model
Brinson [11] proposed a constitutive model for the shape memory effect based on previous work by Tanaka [12] and Liang and Rogers [13]. Tanaka derived a constitutive equation relating
stress to the Helmholtz free energy, ψ, as
σ = ρδψ(, ξ, T)
δ (2.1)
where σ is stress, is strain, ρ is the material density, ξ is the fraction of the material that is in the martensite phase, and T is the temperature. The Brinson model combines Tanaka’s constitutive equation with Liang and Rogers’ constitutive equation
dσ = δσ δd+
δσ δξdξ+
δσ
δTdT (2.2)
leading to a general form
dσ = E(, ξ, T)d+ Ω (, ξ, T)dξ+ Θ (, ξ, T)dT (2.3)
where
E(, ξ, T) = ρδ
2ψ
δ2 (2.4)
Ω (, ξ, T) = ρδ
2ψ
δδξ (2.5)
Θ (, ξ, T) = ρ δ
2ψ
δδT (2.6)
E is the elastic modulus of the material, Ω is the transformation parameter, and Θ is the coefficient of thermal expansion. Brinson’s constitutive relation can then be written as
σ−σ0 = E(ξ) (−0) + Ω (ξ) (ξ−ξ0) + Θ (T−T0) (2.7)
where the 0 subscript signifies initial states and the coefficient of thermal expansion, Θ is assumed to be constant. The transformation parameter, Ω is given by
Ω (ξ) = −LE(ξ) (2.8)
where L is the maximum recoverable strain, also known as the transformation strain. The
using a simple rule of mixtures
E(ξ) = EA+ξ(EM −EA) (2.9)
whereEA and EM are the elastic moduli of the austenite and martensite phases respectively.
A cosine transformation function developed by Liang and Rogers [13] is used to calculate
the martensite phase fraction, ξ, for the austenite to martensite phase transformation as
ξ = 1−ξ0 2 cos
π
T −M
f −CσM
Ms−Mf
+1 +ξ0
2 (2.10)
and the reverse transformation back to austenite as
ξ = ξ0 2
cos
π
T−A
s−Cσ A
Af−As
+ 1
(2.11)
whereMs, Mf, As,andAf are the martensite and austenite start and finish transition
temper-atures, and CM and CA are the relationships between the temperature and the critical stress
at which a stress-induced transformation will occur. It is generally assumed that CM and CA
remain constant over all temperature ranges.
Brinson then makes a distinction between two variants of martensite, one temperature induced, and the other stress induced. The martensite fraction, ξ, is then made up of two subcomponents, ξs and ξt for stress induced martensite and temperature induced martensite
respectively, such that ξ = ξS +ξT. The cosine law developed by Liang and Rogers is then
modified to account for the two variants of martensite as follows. For the transformation from
austenite to martensite: for T > Ms, and σcrs +CM(T−Ms)< σ < σfcr+CM(T −Mf)
ξS =
1−ξS0
2 cos
"
π σcr
s −σcrf
σ−σcrf −CM(T−Ms)
#
+1 +ξS0
2 (2.12)
ξT = ξT0−
ξT0
1−ξS0
(ξS−ξS0) (2.13)
forT < Ms, and σscr < σ < σfcr
ξS =
1−ξS0
2 cos
"
π σcr
s −σfcr
σ−σcrf
#
+1 +ξS0
2 (2.14)
ξT = ξT0−
ξT0
1−ξS0
where, if Mf < T < Ms, and T < T0
∆T ξ =
1−ξT0
2
cos
π(T−Mf)
Ms−Mf
+ 1
(2.16)
else
∆T ξ = 0 (2.17)
For the transformation from martensite back to austenite: forT > As, andCA(T −Af)< σ <
CA(T −As)
ξ = ξ0 2
cos
π
T−A
s− CσA
Af −As
+ 1
(2.18)
ξS = ξS0−
ξS0
ξ0
(ξ0−ξ) (2.19)
ξT = ξT0−
ξT0
ξ0
(ξ0−ξ) (2.20)
Finally, Eq. 2.7 was re-derived by Brinson as
σ−σ0 = E(ξ)−E(ξ0)0+ Ω (ξ)ξS−Ω (ξ0)ξS0+ Θ (T−T0) (2.21)
The Boyd-Lagoudas Model
Boyd and Lagoudas [14] developed a general 3-D model for the the shape memory effect. The
stress-strain relationship is given as
σij = Cijkl
kl−trkl−Θ (T−T0)
(2.22)
whereC is the elastic stiffness tensor of the material, Θ is the coefficient of thermal expansion of the SMA, andtrkl is the transformation strain calculated as
trkl = 3 2Lσ¯
−1σ0
ij (2.23)
where ¯σ is the effective stress, ¯σ=
q
3 2σ
0
ijσ0ij, and σ 0
ij is the deviatoric stress.
Brinson and Huang [15] have shown that when given initial conditions of 0 = σ0 = 0
that Eq. 2.22 reduces to Eq. 2.7, meaning that the Brinson model is a special case of the
Boyd-Lagoudas model in 1-D. The only difference between the two models, in this case, is the
Boyd-Lagoudas model originally used an exponential transformation function,
ξ = 1−exp
"
ln(0.01) Ms−T−
¯
σ CM
Ms−Mf !#
(2.24)
ξ = exp
"
ln(0.01) As−T−
¯
σ CA
As−Af !#
(2.25)
for the austenite-to-martensite transformation and the reverse transformation respectively. CM
and CA are the relationships between temperature and critical stress as used in the Brinson
Model above.
The M¨uller-Achenbach-Seelecke (MAS) Model
M¨uller, Achenbach and Seelecke [16] proposed a thermomechanical model for the behavior of SMAs based on statistical thermodynamics. The micro-structure is modeled as a small layer
(volume on the order of 1x10⁻²³m3) of the twinned martensite lattice structure. Macroscopic strains are calculated as an average of the strains of a volume composed of many of these lattice layers similar to what is depicted in Figure 2.3. Similar to the Brinson and Boyd-Lagoudas
models, the M¨uller-Achenbach-Seelecke (MAS) model depends on the fraction of the material
that is martensitic. However, the MAS model specifically distinguishes between two variants of martensite. Each lattice layer can exist in some combination of martensite, either M+ (the preferred martensite variant under tension) or M− (the preferred variant under compression), and austenite. The amount of each phase present in a lattice layer is represented by the phase fractionsξ+,ξ−, andξA forM+,M−, and austenite respectively, such thatξ++ξ−+ξA= 1. Therefore, the strain can be broken down as the sum of the strains for each phase present as
= ξAA+ξ+++ξ−− (2.26)
= ξA
σ EA +ξ+ L+ σ EM +ξ−
−L+ σ EM
(2.27)
whereLis the transformation strain and EAand EM are the Young’s moduli of the austenite
and martensite phases respectively.
The transformation law used in the MAS model is a statistical thermodynamics approach
based on the Gibb’s free energy. The phase fractions in Eq. 2.27 can be calculated from the set of ordinary differential equations in time [17]
˙
ξ+ = −ξ+p+A+ξApA+ (2.28)
˙
In Eq. 2.28 and Eq. 2.29, pαβ represents the probability of the material transitioning from the α phase to the β phase. These probabilities are calculated from the Gibbs free energy barriers that separate the phases. The Gibbs free energy, g =ψ−σ, is calculated from the Helmholtz free energy density, ψ, which can in turn be calculated from two experimentally obtained stress-strain curves at different temperatures (See Appendix A.1). From the Gibbs free energy, the transition probabilities can be computed as
pαβ = 1 τx
exp[−λ(∆Gαβ)] (2.30)
where λ= VD kBT and
1
τx is the relaxation time of the material, VD is the volume of the lattice
layer,T is the temperature,kBis Boltzmann’s constant and ∆Gαβ is the difference between the
Gibbs free energy minimum state of phase α and the energy barrier preventing the layer from transitioning to the β phase. A third differential equation is used to update the temperature, T, based on the balance of internal energy [16]
ρcVT˙ =−hAs(T −T0) +j(t)−ξ˙+H+(σ)V −ξ˙−H−(σ)V (2.31)
where ρ is the density, c is the specific heat, V is the macroscopic volume, h is the coefficient of surface heat transfer to the environment, T0 is the environmental temperature, As is the
macroscopic surface area,j(t) is the Joule heating over time in the case of an SMA actuated by electrical current, andH± are the latent heats of the phase transformations. The stress-strain behavior of an SMA can then be modeled by integrating Eq. 2.28, Eq. 2.29 and Eq. 2.31 and
combining with Eq. 2.27.
Model Comparisons
Two numerical examples, one quasi-plastic (Figure 2.6) and one pseudoelastic (Figure 2.7), using all three of the models described above are shown. The material parameters used for
the calculations are shown in Table 2.1. It can be seen that all three models are in fairly
good agreement with each other. It should be noted that the exponential transformation law calculates the critical stresses differently, therefore, in order to get the correct hysteresis behavior
with the Boyd-Lagoudas model, the parametersCM and CA are modified [15]. WhileCM and
CAare different from each other in the Brinson model (and not used in the MAS model), they
are set equal to each other for the Boyd-Lagoudas model such that
CMBL=CABL= C
Brinson
A +CMBrinson
2 (2.32)
temper-atures be known as well as the relationship between the critical stresses and the temperature.
The Brinson model also requires the critical stresses at the martensite start temperature, Ms.
This requires two experimental results at different temperatures (assuming one of the
tempera-tures isMs), as well as a DSC (Differential Scanning Calorimeter) or similar test to determine
transformation temperatures. The MAS model also requires experimental results at two differ-ent temperatures, but does not explicitly require knowledge of the transformation temperatures.
The MAS model also requires a number of other parameters including specific heat, heat
trans-fer coefficient, density, and relaxation time. Approximate values for these parameters can be found in the literature and adjusted to match experiment [16]. The Brinson and Boyd-Lagoudas
models are simpler to implement, but the MAS model, due to the Gibb’s free energy
formula-tion, can account for effects such as a polycrystalline structure and strain rate effects that the other models do not capture.
Figure 2.6: Comparison of Boyd-Lagoudas, Brinson, and MAS models. Quasi-plastic behavior atT = 20◦C
2.2.5 Applications of Shape Memory Alloys
Although the shape memory effect was recognized in the early 1960’s, SMAs did not see
widespread commercial use until the 1980’s. Since then, SMAs, especially Nitinol, have gained use in a wide variety of commercial applications including medical applications, actuators,
Table 2.1: Material parameters for numerical examples
Parameter Brinson Boyd-Lagoudas MAS Units
EA 67x103 67x103 67x103 MPa
EM 26.3x10³ 26.3x10³ 26.3x10³ MPa
L 0.067 0.067 0.067 –
CA 13.8 10.9 – MPa/◦C
CM 8.0 10.9 – MPa/◦C
Ms 18.4 18.4 – ◦C
Mf 9.0 9.0 – ◦C
As 35.4 35.4 – ◦C
Af 49.0 49.0 – ◦C
Θ 0.55 0.55 – MPa/◦C
σscr 100 – – MPa
σfcr 170 – – MPa
σAL – – 274 MPa
σAU – – 434 MPa
TL – – 40 ◦C
TU – – 60 ◦C
∆σ – – 150 MPa
τx – – 1x10⁻² s−1
c – – 0.45x10³ J/(kg◦K)
h – – 2300 J/(sm2◦K)
ρ – – 6400 kg/m3
Figure 2.7: Comparison of Boyd-Lagoudas, Brinson, and MAS models. Pseudoelastic behavior atT = 60◦C
Medical Applications
Nitinol is a biocompatible alloy. It is non-toxic, has a cytotoxicity (the damage the material
can cause to surrounding cells) similar to other implantable materials, and has stress/strain behavior that is similar to biological materials such as bone and tendon as shown in Figure 2.8.
This biocompatibility has led to the use of Nitinol in a number of medical applications. Nitnol’s
unique super-elastic properties result in high recoverable strains and a resistance to kinking, which makes it an excellent material for use in medical instruments such as hinge-less graspers
and forceps, laparoscopy retrieval baskets, and guide wires. Guide wires are used to deploy
catheters inside blood vessels. The guide wire must navigate a complicated route from the insertion point (most commonly located in the neck, above the elbow, or in the groin) to the
area of interest in the patient [18].
Nitinol stents are also commonly used to repair blocked or collapsed blood vessels. A Nitinol stent, shown in Figure 2.9, can be crushed down to a small diameter and delivered to the affected
area via a catheter. Once in place the stent is pushed out of the catheter and as the Nitinol
recovers its original shape, it widens the blood vessel and holds it open. The same concept is also used to create filters to prevent pulmonary embolisms. A pulmonary embolism is caused
when a blood clot in a vein is dislodged and carried to the lungs which can cause heart failure.
A Nitinol filter has been designed that can be folded down to fit in a catheter. Once deployed, the heat from the body causes the filter to return to its original shape. It latches onto the walls
they can reach the lungs [18, 19].
Strain
St
re
ss
Bone
NiTi
Tendon
Stainless Steel
Figure 2.8: Comparison of stress-strain curves for pseudoelastic Nitinol, bone, tendon tissue and stainless steel
Super-elastic Nitinol is also used as orthodontic archwire. The Nitinol wire can be set to the desired shape of the patients teeth and then deformed to fit over the actual configuration
of the teeth. Then, due to the temperature inside the mouth, the wire will attempt to return
to its original shape (the desired position of the teeth). Due to the fact that Nitinol wires have a constant recovery stress over a large range of strains, the wire will keep a constant force on
the teeth as they are adjusted, meaning that the wire does not need to be tightened manually
by the orthodontist [19].
Non-Medical Applications
Shape memory alloys have also found commercial use outside of the medical industry. Frames
for eye glasses (Figure 2.10) and shoe inserts have been made out of Nitinol that can recover large deformations by heating with a hair dryer. Nitinol has also been used in mobile phone
antennas and in the headband of headphones, allowing them to be folded up for transport.
Shape memory alloys have also found commercial use as fasteners/couplers and actuators [20]. The Grumman F-14 used an SMA (originally Ni-Ti-Fe) heat-to-shrink coupling to connect
hydraulic lines. The coupling was expanded in liquid nitrogen and fit over the hydraulic lines.
Figure 2.9: A Nitinol stent [courtesy of Merit Medical Systems, Inc.]
weight and ease of installation (especially in areas of limited access). Some disadvantages of
SMA fasteners and couplings are a higher cost relative to traditional fasteners and a limited operating temperature range (dependent on the material composition and processing) [20].
SMAs have material properties that also make them attractive as actuators. SMAs have a
high power to weight ratio which makes them candidates to replace servo motors for actuation. An SMA wire actuator is much more compact and can result in significant weight and space
savings over traditional servo motors. These actuators have been attracting a lot of attention
in the area of micro-actuation. The actuation force of SMAs is accomplished with very small accelerations making them attractive for space applications where low accelerations are
impor-tant. Shape memory actuators have also been used in space for release applications, such as
the deployment of solar panels [20].
Another advantage of these actuators is that they can act as a sensor/actuator combination.
Due to the temperature sensitivity of the shape memory effect, SMA actuators have been used
as high temperature cut-offs in water heaters, coffee makers, tea kettles, and faucets. When the temperature gets too high the SMA contracts and shuts off the flow, simultaneously acting
as a temperature sensor and shut-off valve. SMAs also experience a change in resistance with
a change in length, so the resistance of an SMA actuator can be measured for displacement feedback for robotic applications. One major drawback of these actuators is that the frequency
of actuation is limited due to the cooling time required by the SMA [20].
SMAs also have excellent damping properties. This has led to research into using SMA
dampers to protect structures during earthquakes. The hysteresis in the stress/strain
relation-ship of SMAs makes them excellent candidates for frequency-independent dampers. Shaker table experiments with scaled down structures incorporating such dampers have given
promis-ing results for their abilities to withstand violent earthquakes [20]. Shape memory alloys have
also been used in fiber-reinforced polymer-matrix composites to enhance material properties and provide structural health monitoring capabilities as described in the following section.
2.2.6 Shape Memory Alloys used for Structural Health Monitoring and Damage Supression in Fiber-Reinforced Polymer-Matrix Composites Composite materials are generally very strong in the direction of their reinforcement fibers,
but relatively weak in the transverse directions [21]. This makes impact damage a serious
concern for composite materials and there has been a concentrated effort to increase the impact damage resistance of these materials. SMAs have been used in hybrid composites to address the
problem of impact damage. The high damping capacity of the pseudoelastic effect makes SMAs
to fatigue cracking. They have been used as both passive (damping) and active (shape memory
effect recovery forces) damage suppression mechanisms, as well as embedded strain sensors for structural health monitoring [21].
Structural Health Monitoring
Shape memory alloys have been studied for use as possible sensors for damage detection. Nagai
and Oishi [22] studied the relationship between strain and electrical resistance in a Ni-Ti wire. They found that when the SMA wire is in the martensite phase, there is a linear relationship
between the change in resistance and the strain in the wire. The relationship is non-linear if
the wire is in the austenite phase and a stress induced transformation occurs. The Ni-Ti wire was embedded into a glass fiber reinforced plastic (GFRP) plate. The change in resistance of
the embedded SMA wire showed a good correlation to the strain in the GFRP plate.
Oishi and Nagai [23] also studied the use of SMAs as strain sensors by capturing the acoustic emission (AE) signals that occur during strain-induced phase transformation. A Ni-Ti wire
that was originally in the austenite phase at room temperature was strained. As the sample
underwent strain-induced transformation to martensite, the AE signals were measured. The authors concluded that there is a linear relationship between the strain in the wire and the
cumulative number of AE events. The authors were also able to determine the location of the
AE events using standard AE source location techniques. This type of sensor would allow for strain estimation and damage location estimation in a shape memory alloy hybrid composites
(SMAHC).
Lee [24] used acoustic emission analysis to monitor a Ni-Ti/Al6061 metal-matrix composite (MMC). SMA wires were used for both passive damage suppression and detection. Ni-Ti
wires in the martensite phase were embedded into the Al6061 matrix via hot press. Then the
MMC was heat treated causing the wires to transform to austenite and contract. Because the aluminum matrix does not contract, a residual compressive force is introduced. This served
to increase the tensile strength of the composite. Tests were conducted to obtain AE signal
characteristics for different phases of damage, including wire pullout, matrix debonding, and cracking of the Ni-Ti. This information was then used to interpret damage as it occurred to
the MMC. Two dimensional source location techniques based on the difference in arrival times of the AE event at different sensors were also used to determine the location of the damage in
the composite.
Passive Damage Suppression utilizing Pseudoelasticity
Passive damage suppression relies on the pseudoelastic effect to absorb energy. SMAHC have
on SMAHC for impact damage suppression was carried out by Paine and Rogers [25, 26].
They conducted low velocity impact tests on graphite/bismaleimide and glass/epoxy laminates hybridized with 10-25% volume fractions of unidirectional 0.3 mm diameter SMA wires. The
SMAHC showed a 35% increase in the perforation energy when compared to laminates without
SMA wires due to the energy dissipation effects of the super-elastic effect. The impact energy was spread out over a larger area when compared to the composites without SMAs due to the
fact that the SMA wires remained intact throughout the impact event. It was also found that
the hybrid composites had a smaller visible delamination area than the laminates without SMA reinforcement.
Tsoi et al. [27] found that SMA wire location within the composite is vital to the SMAHC performance. It was found for the best integration, that the SMA wires should be embedded between 0◦ plies. When the wires were embedded between 45◦ plies, a brittle area was formed
because the SMA wires and reinforcing fibers moved in different directions when strained.
The authors also concluded that embedding the SMA wires on the bottom half of the plate (preferably in the bottom layer) significantly increased the amount of energy absorbed (by
as much as 25%). Plates with SMA wires embedded in the center showed significantly more
damage than plates with wires in the lower half.
Xu et al. [28] fabricated an SMAHC that takes advantage of the recovery stress of the reverse martensitic transformation to introduce an internal compressive stress in the composite plate for damage suppression. SMA wires with a large temperature hysteresis were used such
that the martensite start temperature,Ms, was well below room temperature and the austenite
start temperature, As, was above the curing temperature of the composite. This allowed the
wires to be prestrained and then embedded in the carbon fiber composite plate. After curing,
the specimen was heated to a temperature above As. This triggered the reverse martensitic
transformation, causing the wires to contract, introducing a compressive force in the carbon fiber plate. The recovery stress in the wires was a permanent effect after the plate returned
to room temperature as long as the plate was not subjected to temperatures lower than Ms
(about -40◦C).
Ellis et al. [29] tested a graphite/epoxy/SMA composite under ballistic impact conditions using a 9mm Beretta handgun. As with the low velocity impact results, it was found, as
expected, that embedding the wires toward the bottom of the plate had the greatest effect, although in all cases the SMA wires were pulled through the composite plate without being
fully strained. Increasing the volume fraction of SMA wires had no appreciable affect on energy
absorption. This is due to the high strain rates of a ballistic impact and the strain rate effects of SMAs.
carbon fiber woven fabrics alone. Experimental results showed that the impact energy absorbed
increased linearly with increasing volume fraction of SMA wires. The SMAHCs showed an energy absorption of more than double that of the baseline composite. It was concluded that
the energy absorption was not dependent on the location of the SMA wires through the thickness
as has been reported in other works as described previously.
Lauet al. [31] stitched a 10 layer glass fiber woven fabric/epoxy composite plate with fully austenitic Ni-Ti wires. The SMA stitched composite plates were then subjected to impact
tests and compared with unstitched plates. The SMA stitched plates resulted in decreased delamination energy and increased stiffness with a lowering in the natural frequency of the
plate. As with other forms of embedded SMA wires, the energy absorption by the the SMA
increased with increasing volume fraction.
Yamada et al. [32] modeled a metal-matrix composite (MMC) comprised of Ni-Ti particles in an aluminum matrix. They found that mechanical properties such as yield strength and
fracture toughness of the aluminum were improved by the addition of the Ni-Ti particles due to the shape memory effect of Ni-Ti. The shape memory effect generated residual compressive
stresses when the MMC was prestrained to deform the martensitic Ni-Ti particles and then
heated to induce the shape recovery forces in the particles. Results were calculated as a function of Ni-Ti volume fraction and amount of prestrain applied to the MMC.
Active Damage Suppression Utilizing the Shape Memory Effect
Much like passive damage suppression in SMAHCs as described above, SMAHCs with active damage suppression also make use of the energy absorption properties of the shape memory
effect, but the martensitic transition is activated by an external source. Rogerset al. [21] used electrically activated SMA wires to reduce the average tensile stress values ahead of a fatigue crack. The recovery force of the activated wires assisted in crack closure and reduced the crack
growth rate.
Kuang et al. [33] adhesively bonded an SMA wire to a carbon-fiber/epoxy beam. They showed that when subjected to an impact, the vibrations in the beam were significantly reduced,
and were damped out faster when the wire was activated. When activated via joule heating
the wire transforms to the austenite phase. As the beam and the SMA wire are strained by the impact, strain induced martensite (SIM) is formed. They concluded that the internal friction
between the SIM and the parent austenite phase was responsible for the energy dissipation.
Also, as the level of vibration increased, the amount of SIM increased, leading to larger internal frictions, meaning that the SMA wire had a higher damping capacity during higher levels of
vibration.
martensite phase and with the SMA wires electrically activated such that they were transformed
into the austenite phase. The results were compared to composite beams without SMA wires. It was found that the beams with SMA wires in the martensite phase had a small increase in
stiffness and failure stress due to the stiffness of the embedded SMA wires and about a 50%
increase in strain energy absorbed before failure. When the wires were heated, the authors reported a decrease in stiffness and failure stress. This was attributed to softening of the
polymer matrix caused by the electrical flash heating of the SMA wires. Despite the decrease
in modulus and failure load, the beams showed a six-fold increase in strain energy absorbed before failure.
Shimamoto et al. [35], Kimura et al. [36] and Jang et al. [37] tested the effect of pre-strained actuated SMA wires in SMAHCs. Both Shimamoto et al. and Jang et al. showed that the recovery force within the composites increased with increasing prestrain. Shimamoto
et al. tested the effect of the SMA recovery force on fatigue cracks in SMA wire reinforced epoxy composite plates. Fatigue crack growth was arrested or slowed significantly when the SMA wires were activated, depending on the amount of pre-strain. Kimura et al. showed a similar effect with SMA wires embedded in carbon fiber reinforced plastic (CFRP) plates.
They reported an increase in fracture toughness and stiffness and a decrease in fatigue crack propagation rates when the SMA wires were heated. Jang et al. embedded SMA wires in a CFRP plate and demonstrated that transverse cracks in a 90◦ ply were suppressed by recovery forces from the activated SMA wires.
In addition to wires, shape memory alloys have been used in the form of foils and ribbons
as well. Amano et al. [38] used prestrained Ni-Ti foils embedded between 90◦ plies in a CFRP plate. When heated, the compressive stress generated by the recovery force of the SMA
foil suppressed the initiation and growth of transverse cracks. Turner [10] used SMA ribbons
embedded in glass/epoxy beams. He showed that the activated SMA ribbons increased damping in the structure while lowering its natural frequency.
2.3
Magnetic Shape Memory Alloys
2.3.1 The Shape Memory Effect in Magnetic Shape Memory Alloys
Magnetic shape memory alloys (MSMAs) are another class of SMAs. MSMAs share all the
shape memory and pseudoelastic characteristics of SMAs with the additional ability to have
their shape memory effect controlled by magnetic fields. Martensite transformations in the presence of a magnetic field were first reported in 1985 by Kakeshitaet al. [39]. In search of an actuator with the frequency range of a piezoelectric ceramic but the stroke of an SMA, Ullakko
The magnetic shape memory effect operates in MSMAs with a different mechanism than the
shape memory effect in regular SMAs. Rather than a phase transformation between deformed martensite and austenite due to a temperature change, the magnetic shape memory effect is
caused by the reorientation of martensite variants due to a magnetic field change. The austenite
phase has a cubic crystallographic structure and the martensite phase has a tetragonal structure that can be oriented in 3 variants as shown in Figure 2.11. Under the application of a magnetic
field, the martensite variants will align along their preferred axis, inducing a macroscopic strain
in the material.
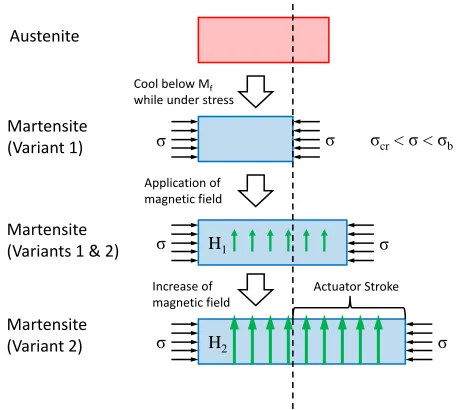
Figure 2.12 shows a representation of an idealized MSMA actuator. The actuator is heated
such that it is in the undeformed austenite phase. Then the actuator is loaded with a biasing
stress, σ, such that σcr < σ < σb, where σcr is the critical stress required to cause the
stress-induced martensite transformation, and σb is the blocking stress, the stress level that will
supress the realignment of martensite variants under the influence of a magnetic field. Once
the actuator has been loaded, it is cooled back to room temperature (T < Mf) such that the
martensite is of a single variant. Then with the introduction of a magnetic field, some of the
martensite will begin to realign, causing an increase in length of the actuator. As the magnitude
of the magnetic field is increased, more and more of the martensite variants will realign until saturation is reached. When the magnetic field is removed, the martensite will return to the
original stress-induced variant. Thus the actuator can be controlled by turning the magnetic field on and off. This type of actuation can occur with a much greater frequency (See Table
Table 2.2) than that of a thermally activated SMA [41].
a
a a
b
b c c
b
b
c b
b Cubic Austenite
Tetragonal Martensite Variants
Austenite
Martensite (Variant 1)
Martensite (Variants 1 & 2)
Martensite (Variant 2) σ σ σ σ σ σ H1 H2 Actuator Stroke Cool below Mf
while under stress
Application of magnetic field
Increase of magnetic field
σcr < σ < σb
Figure 2.12: Schematic of the magnetic shape memory effect
2.3.2 Constitutive Modeling of Magnetic Shape Memory Alloys
Kiefer and Lagoudas have proposed a constitutive model to capture the behavior of the the magnetic field-induced straining of MSMAs [41]. The total strain in the MSMA is given by the
sum of the elastic strain, the magnetically-induced strain and the transformation strain due to the traditional shape memory effect
= σ E +
r,max(σ)ξ+tr (2.33)
where tr is the transformation strain due to the SME, r,max is the maximum magnetically-induced reorientation strain andξ is the fraction of reoriented martensite.
r,max(σ) is determined experimentally. A trigonometric reorientation function has been proposed as
ξ= 1 2cos
−1 A
−σr,max−1 2
σ2
∆E −µ0M
satH+B
1+B2+Y
+π
+1
2 (2.34)
and for the reverse orientation process
ξ= 1 2cos
−1 C
−σr,max−1 2
σ2
∆E −µ0M
satH+B
1−B2−Y
+π
+1
2 (2.35)
![Figure 2.9: A Nitinol stent [courtesy of Merit Medical Systems, Inc.]](https://thumb-us.123doks.com/thumbv2/123dok_us/1403059.1172953/35.612.178.450.411.621/figure-nitinol-stent-courtesy-merit-medical-systems.webp)