Article
Solar PV Cost Reduction Potential in Japan
Robert Höller 1,*, Daniel Gudopp 1,2 and Tobias Leschinsky 2
1 University of Applied Sciences Upper Austria, School of Engineering, Stelzhamerstrasse 23, 4600 Wels, Austria; [email protected]
2 deea solutions GmbH, Kennedyallee 93, 60596 Frankfurt am Main, Germany; [email protected] * Correspondence: [email protected]; Tel.: +43-50804-44250
Abstract: One of the key areas of the International Renewable Energy Agency’s (IRENA)
programme of work is the analysis of renewable technology costs and performance and the dissemination of these results to as wide an audience as possible. In addition to analysis, IRENA seeks to engage a broad range of stakeholders in the context of this work through the Renewable Costing Alliance. The Costing Alliance brings together companies, industry association, governments and researchers to share, confidentially, data for real-world renewable energy project
cost and performance, helping to build further on IRENA’s costing work to date. In this context the authors analyse the current cost differentials and cost reduction potentials for solar PV in Japan compared to best practice levels and identify the reasons for higher costs in Japan and how to reduce them. This study analyses the current installed cost differentials for utility-scale, commercial and residential rooftop solar PV systems. In addition to identifying the reasons for the cost differentials, potential policy recommendations to reduce the cost differential are identified.
Keywords: Solar PV; cost reduction; balance of system; Japan
1. Introduction
Following the Fukushima Daiichi Nuclear Power Plant accident in March 2011, the Japanese feed-in-tariff for PV was launched soon afterwards in the year 2012. The originally very generous feed-in-tariff (FIT) of 42 ¥/kWh (0.35 $US/kWh) was revised downwards several times since then and in FY 2018 stands at 18 ¥/kWh for PV systems larger than 10 kW and 28 ¥/kWh for PV systems below
10 kW, which is still attractive given Japan’s good solar irradiation. Due to this generous incentive
the PV market experienced a high growth, and Japan was the third largest solar PV market in 2017 after China and the USA, followed by the Germany with respect to cumulative installations. Japan’s
cumulative installed capacity stands at 49.3 GW by the end of 2017 [1]. In particular, the year 2014 achieved a record breaking growth of close to 30% and 9.4 GW of PV installations. With regards to annual installations, Japan was third ranked in 2016 behind China and the USA. The annual installed PV capacity by the end of 2016 was 7.89 GW, down by 27% compared 2015 [2,3]. Accordingly, Japan has the second highest solar PV capacity per capita after Germany [4].
It is a well-known fact that the installation costs as well as the electricity generation cost of solar PV in Japan are high compared to other countries [5]. This study provides an update of the global solar PV markets in terms of installed capacities based on 2017 figures and shades a light on latest marked developments and elaborates country specific Solar PV system costs with a comparison between Japan and Germany in terms of market size. It also provides a PV system cost breakdown on sub-category level for the German and the Japanese market and identifies differentiators and cost drivers. Particular emphasis is placed on identifying the reasons for the cost differentials for each cost component, with an eye to identifying what policy measures could reduce these differentials. Moreover, it elaborates the potential to reduce the specific system from the Japanese cost level to German values and quantifies the cost reduction potential, if possible. Moreover it elaborates measures and technological developments that may further reduce the values until 2025 with particular focus on Japan.
Cost of solar photovoltaic (PV) installations can roughly be divided into three components: PV modules, inverters, and balance of system (BoS) items. Even though there are innovations and technology improvements, modules and inverters have become fairly standardized products. BoS costs are more complex and specific to a location or country. This is reasoned by different conditions in terms of climate, geographical location, access to and pricing of commodities, availability and structure if industrial clusters especially in in the semiconductor industry, financing conditions, public safety and the energy market itself or secondary legislation that for instance requires local content. Next to hardware costs, labor and permitting costs can also lead to widely different total cost, even if the purely cost of the components is relatively similar.
PV modules and inverters are the two major components of a PV system. In this study, PV module costs and inverter costs are determined bottom up and not, as done in many PV cost analyses, calculated as a fraction of the total investment cost. PV module costs are in general not very much depending on the location, as a world market price for PV modules exists. Nevertheless, certain effects such as import taxes can have a local impact. Moreover, depending on the country the type of used PV modules (module technology, manufacturer, and quality) can widely vary and can therefore have a significant influence on the average price. In 2017, PV Modules sold on the Japanese market are by about 46% produced by Japanese manufacturers [3]. Since these modules are mostly of high quality it raises the overall cost. The same holds for PV inverters, which are mostly of Japanese origin for the domestic market.
Most of the studies dealing with BoS costs start from the turnkey costs of an installation and subtract the well-known module and inverter cost. In this study a bottom-up approach was applied. It starts at the other end and analyses actual costs of BoS components in three major cost categories.
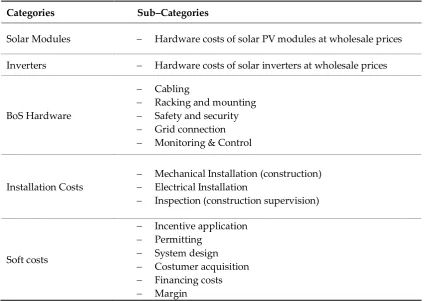
In different contexts and studies the term “BoS costs” may include or exclude certain components. In this study the cost components of the three major cost categories are considered as shown in Table 1.
Table 1. Major cost categories
Categories Sub–Categories
Solar Modules − Hardware costs of solar PV modules at wholesale prices
Inverters − Hardware costs of solar inverters at wholesale prices
BoS Hardware
− Cabling
− Racking and mounting
− Safety and security − Grid connection − Monitoring & Control
Installation Costs
− Mechanical Installation (construction) − Electrical Installation
− Inspection (construction supervision)
Soft costs
− Incentive application − Permitting
− System design
− Costumer acquisition − Financing costs
2. Materials and Methods
2.1. Market Segments
In this research, the following market segments are analysed: small-scale residential rooftop system with an indicative system size of 3 – 20 kWp, commercial rooftop systems with an indicative system size of 20 – 1,000 kWp, and utility-scale ground-mount systems with a system size of more than 1 MW. Small-scale rooftop systems are installed on family houses and compounds in residential areas. The energy is either fed into the grid or compensated by feed-in tariffs or serves the own consumption. Small-scale rooftop systems are installed on family houses and compounds in residential areas. The energy is either fed into the grid or compensated by feed-in tariffs or serves the own consumption
2.1.1. Residential Rooftop Systems
Small-scale rooftop systems are installed on family houses and compounds in residential areas. The energy either fed into the grid and compensated by feed-in tariffs or serves the own consumption. Small-scale rooftop systems are installed on family houses and compounds in residential areas. The energy is either fed into the grid or compensated by feed-in tariffs or serves the own consumption.
2.1.2. Commercial-Scale Rooftop Systems
Commercial-scale rooftop systems are usually installed on commercially used buildings such as manufacturing halls or supermarkets. The power is either fed into the grid or used to cover the electricity demand of the production processes or at least part of it. The self-consumption approach becomes increasingly important in emerging markets without proper feed-in regulations and high electricity tariffs.
2.1.3. Utility-Scale Systems
Utility-scale fixed systems in this context are grid connected power plants that are either
operated by a utility itself or by independent power producers (IPP’s). The electricity generated is
sold under a feed-in tariff scheme or bilaterally negotiated power purchase agreements (PPA). Off-takers are mostly utilities or large industrial players.
In the residential and commercial segment, accurate project sized in terms of installed capacities are stated. For utility projects, due to confidentiality obligations, the installed capacity is rounded up according to the following rules:
• Projects with an installed capacity of less than 50 MWp are rounded half to the next multiple of 10 MWp (e.g. 15 MWp becomes 20 MWp);
• Projects with an installed capacity of more than 50 MWp are rounded half to the next multiple of 50 MWp (e.g. 75 MWp becomes 100 MWp).
2.2. Technology Scope
For the assessment of the current status and development of the solar PV system costs, the following technologies have been taken into account in order to ensure a detailed decomposition of costs and cost drivers: module technologies, inverter concepts, tracking systems, and floating PV.
2.2.1. Module Technologies
Not only tracking solutions have and significant on BoS costs and cost structures. Especially the choice of module technology has an important impact. It is mostly related to the historically lower efficiency of most thin film technologies that in turn require a larger area in order to generate the same amount of electricity. Larger areas come most of the time with higher costs due to the larger land, mounting structure, cabling, and installation time.
managed to catch up in terms of efficiency with regular crystalline PV cells within the last few years, the marked dominance of crystalline PV is expected to continue throughout the next years.
Out of the about 80 GWp production capacity in 2016, over 75 GWp are crystalline Silicon based technologies. Therefore, the study at hand has a clear focus on costs of silicon technology based PV power plants. In California there is a significant share of thin film installations, sometimes even combined with tracking systems (e.g. Mount Signal power station in the US).
2.2.2. Inverter Concepts
Most commercial PV plants around the world are built on the basis of one of the following inverter concepts:
• Central inverters
• Decentral (or string) inverters
• Micro inverters / module inverters
For small-scale systems, i.e. residential and smaller commercial systems, central inverters are not an applicable solution, since the system size obviously limits the capacity of the inverter. For all larger systems, both central and decentral inverters are basically available and can be considered as
“competing” options, each having its pros and cons. The composition of hardware costs is different
for string and central systems. Related BoS costs may thus differ at for a specific project, e.g. some road works may be required for the heavy weighted central inverters and serviceability is not guaranteed at every site. However, the choice of the inverter concept does not have a significant impact on solar PV system costs.
Micro inverters are currently still representing minor market shares: While in the US residential market it has gained some importance, in other countries it is only used on a marginal level. Since in terms of costs it is in the range of string inverters and in the target country Japan it is of minor importance, it will not considered as a separate technology in this report.
2.2.3. Tracking Systems
Utility-scale installations are subdivided into fixed installations and tracking solutions. Tracking solutions are orienting a solar panel towards the sun and follow the way of the sun over the day. The additional tracking equipment causes higher specific investment costs ($/kWp) than fixed systems.
There is no other single cost component that can increase a PV system’s performance like a tracker,
increasing yields of up to 20% for 1-axis trackers and up to 35% for 2-axis trackers.
Tracking solutions did not play a crucial role in the overall deployment throughout the last decade. As described in the deea report on BoS cost reduction potential [5], this could be explained by the following reasons:
1) Higher system costs, which have to be overcompensated with an accordingly higher yield in order to make the tracking solution financially viable. Since the yield benefit of tracking systems depends on the level of direct irradiation and the pioneering PV markets were mostly in the northern part of the globe with relatively higher shares of diffuse and lower shares of direct irradiation, trackers were economically less attractive.
2) High area consumption and restrictions in performance of the first generation of 2-axis tracking systems, both in terms of yield and uptime, which were the preferred solution tracking solution for pioneering markets with higher irradiation levels about a decade ago (mainly Spain). 3) In China and India, seasonally adjustable trackers used to be the preferred version due to low
labour costs and low-cost local products.
According to the prognosis in the deea report on BoS cost reduction potential [5], 1-axis trackers have been gaining importance in the last 2-3 years: Approx. 10 GW of tracker systems was shipped in 2016 [6]. Based on a total figure of 71.216 GWp of PV installations in 2016 [7], and the assumption that utility-scale systems represented about 50% of the total installations, roughly one quarter of new-built utility plants employ tracking technology. The main reasons for this development are:
• Shift towards the more stable and reliable, less space consuming, 1-axis technology for utility plants.
Sources like GTM research expect a further growth of the tracker market, expecting a market share of over one third of new-built utility plants and an annual market volume of over 35 GW. Tracking systems have a very low market penetration in Japan as of now. This is mainly due to the fact that tracking systems only have a good performance compared to fixed systems at high irradiation locations. Japan has annual average DNI values up to about 1400 kWh/m², which is not sufficient. Therefore, these systems will not be taken into account in this report. For other high DNI regions, it is recommended to keep an eye on this technology.
2.2.4. Floating PV Systems
Floating PV started with first small installations in Asian countries around 2010. Since then, several hundreds of MW have been installed, with a clear upward trend. The main driver is the unavailability of land area for PV. Other advantages are: lower evaporation of the water body covered with PV, reduced algae growth in the water body, and reduced impact of earthquakes. Also, floating PV plants are expected to have a higher performance compared to land-based systems, mostly due to the cooler operating temperature of the solar modules. However, at current status, hardly any systematic performance analyses on floating PV plants have been published.
Regionally, the market is dominated by Japan, China, and other Asian countries, as well as the US and UK. The main reason for Japan’s market domination is the scarcity of land and to save cost of land lease or acquisition. China has strong incentives to use the country’s vast open-air water reservoirs in former coal mines, including a 1 GW program started in 2016 by the National Energy Administration (NEA). In Japan, floating PV technology was developed to an industrial level by the French company Ciel et Terre.
A study conducted by the Korea Water Resources Corporation showed that floating PV systems can outperform standard, land installed PV systems by 11% [8]. During this comparison analysis, the performance of 3 installations, sized 2.4 kW, 100 kW and 500 kW, was measured. Each system had the equivalent power installed on land as well as on the water.
Regarding the water bodies on which floating PV plants are usually built, the following criteria apply:
• Fresh water bodies should be preferred over saline water bodies to reduce corrosion risk
• The water body must be suitable for the floating platform
• The water level should be quite stable
• Requirements for boats to move needs to be checked locally
Often multiple plastic floats are combined, forming a giant pontoon. The floats are typically made of HDPE (high density poly-ethylene), known for its tensile strength, UV and corrosion resistance. However, also structures other than floating HDPE elements have been used. For greater protection against moisture ingress and high anti-performance induced degradation (PID) performance, as well as resistance against corrosion double glass modules are recommended for floating PV projects.
PV has also been built offshore in Japan and other countries. For example, in 2013 Kyocera built a 70 MW PV power plant in the Kagoshima bay on Kyushu Island in the south of Japan. However, this is not an actual floating PV system, but is built on an artificial island formed by land reclamation.
2. Data Sources
The data basis for this research consists of data from various planed and/or realized projects, interviews, and surveys. Primary and secondary research from various public sources was used in the same order and magnitude. The period observed in this study is 2015 – 2016 [9,10,11].
2.1. Primary Research
Table 2. Data source categories
Data Source Categories Sub–Categories
EPC
Installers Engineering Offices
EPC companies
OWN
Project Host Project Owner House Owner
CON
3rd party Experts
Consultants NGO
DEV
Developer Land Owner Local Authorities
Research interviews were conducted to get an opinion on the specific market conditions, actual trends, the competitive landscape and future outlook.
2.2. Secondary Research
Moreover, we conducted comprehensive secondary research to source qualitative and quantitative information relating to the markets segments in Germany and Japan market and to validate the findings of primary research. The secondary research sources that are typically referred to include, but are not limited to:
• Company websites: whitepapers, press releases, news and annual reports
• Industry trade journals, magazines and other literature: news articles and research studies • Industry associations, energy agencies and other government bodies
2.3. Data Processing
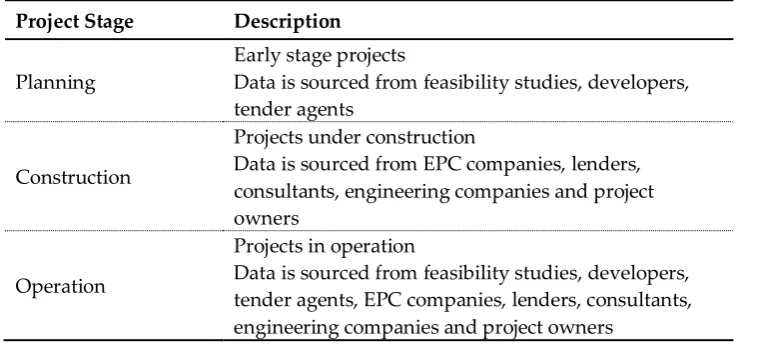
The core of this analysis is a set of cost data that was collected and verified. For each market segment, data sets were collected, analyzed and verified. According to the development status of the relevant project at data recording the following categories are applied.
Table 3. Project status
Project Stage Description
Planning
Early stage projects
Data is sourced from feasibility studies, developers, tender agents
Construction
Projects under construction
Data is sourced from EPC companies, lenders, consultants, engineering companies and project owners
Operation
Projects in operation
Data is sourced from feasibility studies, developers, tender agents, EPC companies, lenders, consultants, engineering companies and project owners
The research process started with a review of in-house data of deea solutions. In a second step, data was structured according to the applied cost categories. After validation of the developed data sets primary research activities were launched.
Cost figures presented in the work are based on turkey installation costs and include financing costs. All figures are presented in US dollars. Constant exchange rates are applied as listed in Table 4. Capital costs are not adjusted for inflation. However, especially the soft cost categories are highly project specific and sometimes fraught with certain blurs. For instance, financing costs in the utility segment are depending on the country rating, project business model, related financing structures, project construction schedules. The following exchange rates, based on the annual average interbank rate, are applied.
Table 4. Applied exchange rates
Country Currency 2015 2016 2017
German
y Euro EUR 0.902 0.904 0.874
China Chinese Yuan Renminbi CNY 6.227 6,644 6.749
Italy Euro EUR 0.902 0,904 0.874
Japan Japanese Yen JPY 121.044 108,793 111.110
USA US Dollars USD 1.000 1,000 1.000
Spain Euro EUR 0.902 0,904 0.874
France Euro EUR 0.902 0,904 0.874
Australia Australian Dollars AUD 1.331 1,345 1.296
UK British Pound GBP 0.655 0,741 0.770
India Indian Rupee INR 64.152 67,195 64.34
3. Global Market Overview
3.1. Overall Market
Looking from at the market development since end 2014, being the reference of Power to Change Report, the global PV market has seen further growth and also several new developments.
At the end of 2017 global PV installations reached 408 GW and the newly installed capacity of PV power increased by 32% to almost 100 GW in 2017 [1]. The market growth went hand in hand with a further global reduction of PV system costs. The main driver for the cost reduction was a further decrease of module prices, showing a sharp decline between 2011 and 2015 (-64%) on average. The module price reduction has been based on (i) technological developments to a certain extent, however to the larger extent on (ii) several new module producers entered the market and increased the price competition and on (iii) decreased demand due to policy changes in main markets, e.g. expiration of FIT schemes.
Figure 1. Evolution of solar PV module costs; Source: [12]
Figure 2. Inverter Price development in the US; Source: [13]
As a result, cost of PV-generated energy on utility-scale is already lower than those of nuclear and fossil energy in many parts of the world. PPA prices for large-scale solar installations with over 100 MWp of installed capacities have reached a level of 20-30 $/MWh in the high irradiation regions of the world, while in Germany auction prices have reached a level of 70 $/MWh for smaller utility installations in low to mid-irradiation conditions.
Furthermore, as a global market trend, especially for the utility segment an increasing number of auction and tendering schemes is in place, replacing the classic FIT schemes. This includes the US, China, India, Australia, LATAM countries such as Chile, European countries such as Germany, UK, France, as well as the Gulf region.
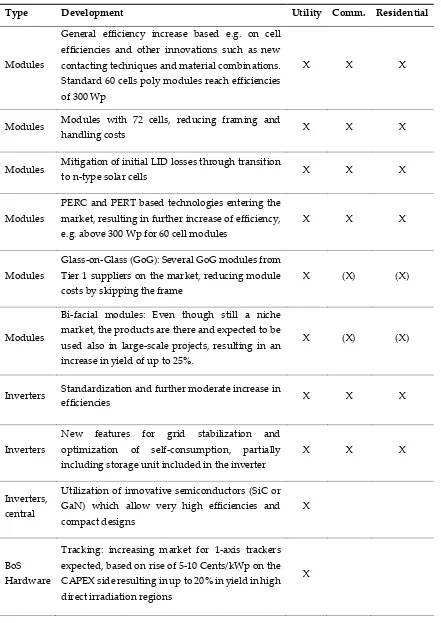
3.2. Technical Trends
Table 5. Recent major trends in global solar PV markets
Type Development Utility Comm. Residential
Modules
General efficiency increase based e.g. on cell efficiencies and other innovations such as new contacting techniques and material combinations. Standard 60 cells poly modules reach efficiencies of 300 Wp
X X X
Modules Modules with 72 cells, reducing framing and
handling costs X X X
Modules Mitigation of initial LID losses through transition
to n-type solar cells X X X
Modules
PERC and PERT based technologies entering the market, resulting in further increase of efficiency, e.g. above 300 Wp for 60 cell modules
X X X
Modules
Glass-on-Glass (GoG): Several GoG modules from Tier 1 suppliers on the market, reducing module costs by skipping the frame
X (X) (X)
Modules
Bi-facial modules: Even though still a niche market, the products are there and expected to be used also in large-scale projects, resulting in an increase in yield of up to 25%.
X (X) (X)
Inverters Standardization and further moderate increase in
efficiencies X X X
Inverters
New features for grid stabilization and optimization of self-consumption, partially including storage unit included in the inverter
X X X
Inverters, central
Utilization of innovative semiconductors (SiC or GaN) which allow very high efficiencies and compact designs
X
BoS Hardware
Tracking: increasing market for 1-axis trackers expected, based on rise of 5-10 Cents/kWp on the CAPEX side resulting in up to 20% in yield in high direct irradiation regions
BoS Hardware
East-West systems: Alternative concept to tracking systems, resulting in a considerable decrease in space requirement, being a low-cost approach for the mounting system, cabling etc. At the same time total yield is decreased, however the daily power curve is more even throughout the day losing its noon peak
X X
BoS Hardware
1500 V: Increase of DC system voltage, resulting in lower cabling losses and lower costs for cabling and other equipment
X (X) (X)
BoS Hardware
Mounting Systems: Minimization and
standardization of roof-top mounting continue further cutting costs in this segment
X X
BoS Hardware
Floating PV Development mainly in Asia in regions with space limitations, using available (mainly) sweet water bodies to float mounting systems. Price range compared standard ground mounted installations is similar to up to 20% higher
X
3.3. Setting the Benchmark Now and in 2025
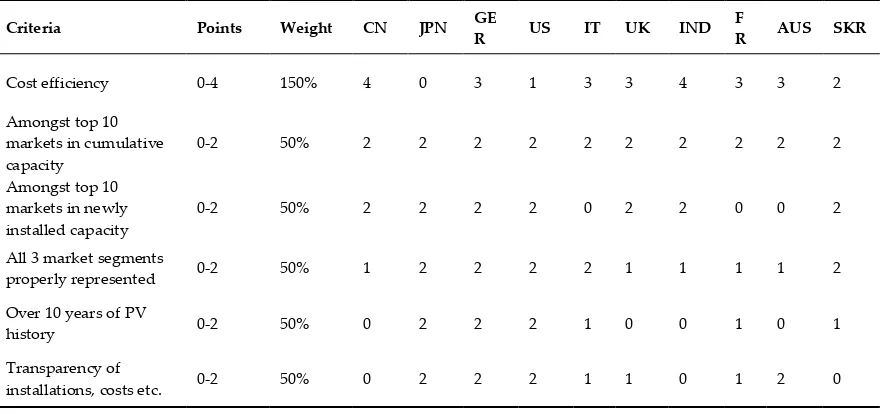
Looking at 2016 PV system prices, China and India will be the likely candidates to show the overall lowest system cost. However, looking at the history of the global PV market, we believe that cost leadership shall be defined as long-term, stable, transparent and established cost-efficiency, representing proven quality and market experience at the same time. Table 6 gives an overview of the status regarding the selected criteria for the top ten markets in terms of installed capacity. Notably, there is no fully objective way of ranking the status of each country and parameter, however the matrix is suitable objectivize the overall ranking to a certain extent and make it traceable.
Table 6. Setting the Benchmark
Criteria Points Weight CN JPN GE
R US IT UK IND
F
R AUS SKR
Cost efficiency 0-4 150% 4 0 3 1 3 3 4 3 3 2
Amongst top 10 markets in cumulative capacity
0-2 50% 2 2 2 2 2 2 2 2 2 2
Amongst top 10 markets in newly installed capacity
0-2 50% 2 2 2 2 0 2 2 0 0 2
All 3 market segments
properly represented 0-2 50% 1 2 2 2 2 1 1 1 1 2
Over 10 years of PV
history 0-2 50% 0 2 2 2 1 0 0 1 0 1
Transparency of
Internationally recognized standards for quality and grid feed-in fully established
0-2 50% 1 2 2 2 2 2 0 2 2 1
Rating 9 6 11 7.5 8.
5 8.5 8.5 8 8 7
Based on the above selection, Germany will be used as benchmark for the cost leadership case.
Despite not having the world’s lowest system costs, the country has managed to continuously decrease BoS and overall system costs, has an established industry which has shown resilience after initial consolidation, and still serves as showcase for successful solar PV market introduction, penetration and consolidation of a new technology. Furthermore, the country shows a strong political will to continue the implementation of renewable energies and a stable political and regulatory environment. Germany has good chances to keep the leading position throughout 2025 if not political changes will further cut down the incentives, assuming further expected price reductions, continued high quality of installations and high market transparency. Other potential candidates are China and India; however quality and transparency need to be increased, and long term market stability need to be proven. Other high-ranking countries such as Italy and UK are expected to further loose significance due to limited new installations.
4. Current Cost Breakdown in Germany and Japan
This chapter evaluates current solar PV system costs in the markets segments under review in Germany and Japan. Data sets in the range from Q1-Q3 2017 have been investigated for this research.
4.1. Germany
4.1.1. The German PV market
With regards to irradiation conditions, Germany only shows an average suitability for PV installations. However, Germany is one of the pioneers of PV, being one of the first countries to implement a strong and stable incentive program for PV, making Germany the market leader in terms of cumulative PV capacity until 2014, when China took over
After annual installed capacities of over 7 GWp in the years 2010-12 there has only been limited growth in the range of 1 to 2 GWp due to severe cut of the FIT system in 2013 and legal insufficiencies in the private and commercial grid parity segment. In 2017, Germany accounted for about 11% (43 GWp) of the cumulative PV capacity installed worldwide (408 GWp), still ranking 4th in total cumulative capacity.
While the German FIT system has received a lot of criticism, the German society and government both wish to continue the incentives for renewable energies. Germany has an ambitious goal of
meeting 80% of the country’s electricity demand with renewable solutions in 2050 and remains the showcase for an effective introduction of renewable energies into the power mix driven by a less attractive but still substantial incentive scheme covering all three market segments.
Germany is also the market with the longest track record in terms of years and has already materialized the learning effects from more than two decades. Furthermore, Germany still has the highest PV capacity per capita installed. PV covered about 7% of Germany’s electricity demand in
2016.
paying makes self-consumption very attractive. Around 50% of all residential solar installations in 2016/2017 were equipped with battery storage.
Due to the relatively high electricity tariffs (even without RE incentive scheme), solar has become a competitive source of electricity. In the private and commercial sector there a several plants installed on the basis of grid parity scenarios, especially if there is relevant in-house electricity consumption with a suitable load cycle.
Figure 3. Historical development of installations [MWdc] per market segment (Source: deea solutions $based on GTM data)
One important market factor is the module import restrictions for PV modules from China, stipulating cost levels far above the actual market prices. Suppliers have set-up, as a measure of circumvention, facilities for final module assembly on non-Chinese territory. However, depending on the demand for these modules, there can still be a negative effect on module prices. Regarding the market segments, there is relevance of all three segments, however clear trend towards utility systems at current status. Figure 5 shows the historical development of installations in the three market segments.
Figure 4. Breakdown of system costs for the three market segments, Germany
systems, 1.06 $US/Wp for commercial systems and 0.93 $US/Wp fixed-tilt utility-scale systems (Figure 4 and Table 7). Design and layout of these systems are standardized to a large degree in all three market segments.
Table 7. Breakdown of system costs for the three market segments in Germany
Segment Unit PV
Modules Inverter
BoS
Hardware Installation Soft Cost TOTAL
Residential [$/W] 0.62 0.22 0.32 0.37 0.17 1.70
Commercial [$/W] 0.52 0.16 0.20 0.13 0.09 1.10
Utility [$/W] 0.42 0.07 0.20 0.09 0.15 0.93
4.1.2. Germany - Residential Roof-top Systems
In the residential roof-top segment, the German average price is 1.695 $US/kWp. Module costs are the dominating position and show higher costs than in the other market segments, potentially containing some additional margin for the installers. As a general principle, EPCs (especially for
small projects) tend to “hide” their margin in the module costs. This is not only a German phenomenon. Regarding the actual module costs, German customers are ready to pay a slight mark-up for German modules, especially in the residential and small commercial segment. Inverters also have higher specific costs since the average unit size is small. According to the collected cost data, the BoS hardware costs are relatively high, which can be explained with high grid connection costs due to the small system size and certain utility requirements (metering standards, grid safety), and
with the relatively high position “safety & security”, both in comparison to the other segments and
to other countries (need for scaffold during construction, stringent requirements for fire protection, firefighters DC disconnect, etc.). The installation generally is a big cost block in this segment in all countries, however relatively standardized and competitive in Germany. Soft costs are relatively low due to negligible financing and permitting costs.
Figure 5. Residential systems cost breakdown [USD/kWp]
4.1.3 . Germany - Commercial Roof-top Systems
with minimal material consumption. Soft costs are relatively low since financing costs and permitting
costs (“PII”) are relatively low. Generally speaking, with respect to other markets, the cost positions in this segment are quite optimized, partially driven by grid-parity installations for peak-shaving purposes which in most cases belong to this market segment. Installations where the levelized cost of electricity (LCOE) of the PV plant are below the electricity cost of the consumer allow at least a peak shaving operation of the PV plant. This is an economic case for many industrial electricity consumers with regular daytime consumption.
Figure 6. Commercial rooftop cost breakdown [$/kWp]
4.1.4. Germany - Utility-Scale Systems
Germany’s utility segment has seen considerable consolidation due to the expiration of the former FIT and the newly introduced auction system has created further cost reductions during the last two years. Average system costs are at 929 $/kWp.
The average module price is slightly higher than in other regions of the world such as China and India, partially influenced by the EU import tax (even though bypassed in most cases). The inverter costs show a fully optimized price due to large unit sizes and high competition of several central inverter suppliers. The soft costs are slightly higher than for the commercial segment, mainly driven by higher development, permitting costs, etc., while installation costs are very low due to standardized procedures and optimized systems such as plug and play systems that do not need special skills or tools.
It is important to mention that in this segment central inverters with 1 MW capacity are nowadays regarded as a standard solution.
4.2. Japan
4.2.1. The Japanese PV Market
A considerable issue for the Japanese solar market and how much PV can be installed is clearly government policy. This is due to the fact that a revision of the current solar policy is possible and to be expected, given the ricing electricity prices, the high cost of the current renewable energy program,
and the country’s fragile economy. Nevertheless, the Japanese FIT program continues to support a
high growth for the time being, with a good balance between large-scale, commercial, and residential PV systems. For example, in the 2nd quarter of FY2016, from the 1663 MW of domestic projects, 950 MW (57%) were utility-scale, 404 MW (24%) were commercial, and 309 MW (18%) were residential projects. Currently, the Japanese solar market is in a state of transition from a FIT scheme to auctions and self-consumption [14,15,16].
According to the Japan Photovoltaic Energy Association’s (JPEA) statistics, demand decline has
reduced domestic module shipments for seven consecutive quarters, but demand for large-scale utility projects has significantly increased in the last years [3]. Nevertheless, due to the falling FIT some renewable developers and investors in Japan move to wind and biomass projects.
With regards to PV module manufacturers, e.g. in 2016 about 34% of modules were delivered by Japanese companies and the rest were from international companies [3], i.e. about 1/3 of the modules from Japanese companies were produced in Japan and the rest was produced oversees. Major Japanese PV-cell suppliers include Sharp, Kyocera, Toshiba, Panasonic, Solar Frontier, a subsidiary of Showa Shell Sekiyu K.K., and Mitsubishi Electric. As shown in Figure 10, the market share of Japanese PV module manufacturers dropped from 84% in 2010 to 34% in 2016.
Figure 8. Domestic shipments of PV modules in the last 7 years (production for domestic market and import), and market share of Japanese manufacturers (data source: [3])
easy to change the type of PV module for a project that has been accredited by METI, which makes it difficult for project developers and EPC companies to negotiate lower prices.
Major Japanese solar inverters companies are TMEIC, Omron, Panasonic, Tabuchi Electric, Hitachi, Mitsubishi Electric, Fuji Electric and Nissin Electric. The market shares of all inverter companies that are active on the Japanese market in the year 2016 (latest available data) are shown in Figure 11 below. Here, 73% of the market share is taken by Japanese manufacturers, 27% by foreign companies.
Figure 9. Market Shares of PV inverters by manufacturer in 2016 (data source: [2])
In total, 21 manufacturers have acquired certificates from the Japan Electrical Safety & Environment Technology Laboratories (JET) for their products, including few foreign companies such as SMA Solar Technology of Germany, Delta Electronics of Taiwan, and Huawey of China. It has to be noted that the JET certification for solar inverters is comparatively complex and can only be done in Japan. This in combination with the necessity to have documentation and software in the Japanese language is a high hurdle and one of the reasons that the Japanese inverter market is dominated by domestic manufacturers. This lack of international competition has an influence on inverter cost in the Japanese market.
Mounting structure manufacturers face the challenge in Japan that the technical requirements and standards are comparatively complicated due to differences in the natural environmental, such as typhoons and earthquakes. METI recently defined a new wind load standard, and not many oversee manufacturers have adapted to the new rules.
A special aspect of Japan’s solar market is that often far more projects are approved than being
built [15]. As of the end of August 2016, a total of 80.3 GW (including cancelled and revoked projects) of PV systems have been approved, of which 30.2 GW started operation (RTS, 2017). Reasons for this are that it is difficult to find enough qualified engineers and construction workers for large-scale PV projects. Currently, the demand for construction workers is very high in Japan due to the rebuilding
activities following the 2011 Tōhoku earthquake and tsunami, as well as the construction works for
the Tokyo Olympics 2020. Moreover, it is difficult to obtain working visa for foreign construction workers in Japan. Also, installation times are on average longer in Japan compared to e.g. Germany due to the limited availability of skilled construction workers, more complex terrain and often more expensive foundation types (concrete, earth screws). Despite these facts, oversees PV developers and EPC companies have been expanding more and more into the Japanese market.
priority access, and does not have obligations for grid expansions. In 2016 METI revised the Renewable Energy Act, which came into effect in April 2017. A major point was a drastic change in the project approval scheme to sort out a large number of approved projects that have not started operation for a long time. Subsequently, METI cancelled about 50% of approved projects, which opened up the situation for grid connection, in particular in regions such as Kyushu and Hokkaido. Until recently, many approved projects that have never been implemented blocked applications of new projects.
Because of the Japanese topography, as the country is very mountainous and flat areas are mostly densely populated, there is a shortage of suitable land for PV power plants. Mountainous or hilly areas drive up the site preparation costs and thereby the overall PV system cost. In case former rice fields are used the soil needs to be improved to increase the pulling strength for pile driven foundations. This also drives up the construction cost for ground-mounted PV systems.
At present about 30% of agricultural land in Japan is abandoned. A possible solution to use this land is dual-use it both for PV and agricultural crop production, known as “Solar Sharing” in Japan.
In 2013, the Ministry of Agriculture, Forestry and Fisheries (MAFF) approved the installation of PV systems on existing crop-producing farmland. Agro-PV systems are a quite new development. Prototypes usually have higher cost than commercial systems, and are therefore not representative. Previously solar generation on farmland, productive or idle, was prohibited under the Agricultural Land Act.
Due to these facts, developers currently prefer projects of smaller size (up to 2-3 MW) for which it is easier to obtain suitable land and also grid connection. For such smaller projects grid connection can be on a lower voltage level, which is much cheaper than for large projects.
With regards to the above described floating PV systems, discussions with developers and EPCs in Japan showed that they are possible but quite complex, in particular if they are situated on retention basins, which can be widely found in Japan. Such retention basins are usually located in remote areas with no nearby grid connection possibility. All the above mentioned facts result in higher construction cost in Japan, despite the above mentioned improvements in the last 3 years.
The commercial rooftop segment still has, as mentioned above, a comparatively small share in the Japanese PV market. As the current FIT is still attractive there is no incentive to install self-consumption PV systems in Japan. Also, the current legal structure makes it difficult to invest in a PV system on a commercial roof by a 3rd party. In addition, static regulations in Japan often require
reinforcement of roofs to be able to install PV systems. These facts together lead to a comparatively low number of installed commercial rooftop systems to date. A breakdown of PV system cost per category is shown in Table 8 below. According to the data sample collected for this study solar PV system costs in Japan are much higher compared to a market like Germany. This implies that there is significant price reduction potential, despite the above mentioned structural factors.
Table 8. Breakdown of system costs for the three market segments in Japan
Segment Unit PV
Modules Inverter
BoS
Hardware Installation Soft
Costs TOTAL*
Residential [$/W] 1.51 0.33 0.24 0.54 0.26 2.62
Commercial [$/W] 0.86 0.33 0.24 0.60 0.20 2.03
Utility [$/W] 0.70 0.29 0.21 0.52 0.17 1.89
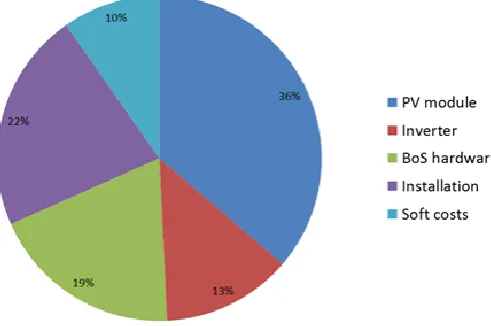
Figure 12. Breakdown of solar PV system costs by sector in Japan
The protected nature of the residential market and the preference of Japanese customers for local products allows for premium prices on Japanese components and banished cheaper international installers. Recently this seems to have changed, and Japanese consumers also accept cheaper oversee products, in particular Chinese or south-east Asian PV modules. Amongst the soft costs labor costs, general buying power of the Japanese customers as well as the willingness to pay a premium price for Japanese products are cost driving factors. If protective rules (such as the complex JET certification mentioned above) will be removed a significant drop in PV system costs can be expected even if best practice levels are unlikely to be achieved.
4.2.2. Japan - Residential Roof-top Systems
Figure 11. Residential roof-top systems cost breakdown [$/kWp]
4.2.3. Japan - Commercial Roof-top Systems
PV system costs in the commercial rooftop segment in Japan are – besides modules - dominated by installation costs (Figure 12). Due to high labor costs all cost components requiring domestic work force are above international average. Costs of racking and mounting are increased due to special structural requirements in Japan (same as for residential roof-top systems). Cost for incentive application and financing are above average targets for cost reduction. Higher competition in the EPC business can possibly bring such costs down. One could also argue that incentive application costs are lower for commercial systems than for residential systems on a per-watt basis because similar fixed costs are spread over larger system sizes. But obviously success rates are much lower because there are much fewer commercial projects than residential projects and on average it is easier to obtain a permit for a residential application than for a commercial because of less grid impact.
Figure 12. Commercial roof-top systems cost breakdown [$/kWp]
4.2.4. Japan – Utility-Scale Systems
Figure 13. Utility-scale systems cost breakdown [$/kWp]
4.3. Comparison of the German and Japanese Market
This chapter briefly summarizes the solar PV system cost differences in Germany and Japan and provides the basis for further analysis provided in Section 5.
4.3.1 . Residential Roof-top Systems
Compared to the benchmark Germany, in the residential segment the overall system costs are 70% higher in Japan. Main driver are the module costs showing nearly triple the German average cost, while the other positions exceed the respective benchmark by 44-59%. The only exception is the BoS hardware costs, being relatively high in Germany mainly due to strict and comprehensive regulations.
Figure 14. Comparison of the cost [$/kW] of residential rooftop systems of Germany and Japan
4.3.2 . Commercial Roof-top Systems
Compared to the benchmark Germany, in Japan’s commercial segment the overall system costs
are approx. double. Module costs are 64% higher, while the inverter costs are twice the German
average figure. Regarding the BoS costs, the position “Installation” is sticking out with almost 4 times
Figure 15. Comparison of the cost [$/kW] of commercial rooftop systems of Germany and Japan
4.3.3. Utility-Scale Systems
Similar to the commercial segment, the Japanese utility segment shows approximately twice the systems costs compared to the benchmark Germany. While the difference in module costs is lower than in the other two segments, the inverter costs show a very high cost difference. As in the commercial segment, the position “Installation” is sticking out with over 4 times the cost compared
to Germany. For further details please refer to Section 5.
Figure 16. Comparison of the cost [$/kW] of utility-scale systems of Germany and Japan
5. Potential to Reduce Solar PV System Costs in Japan
In this Section, measures to arrive at the German benchmark values in Japan are discussed, obstacles and insurmountable resistances are identified. General cost reduction potentials beyond todays best practice is discussed in line with Section 4.
from the differences between Japan and German costs in each cost category, assuming Germany as the role model that might be achieved by Japan in the coming years.
Table 9. Summary of system cost reduction potential [$/kW] by sector in Japan
JAPAN [$/kW] PV module costs Inverter costs BoS hardware costs Installation
costs Soft costs TOTAL*
Residential
rooftop systems 88.89 11.04 -7.89 16.57 9.16 91.61
Commercial
rooftop systems 33.71 17.04 4.11 46.82 1.27 92.68
Utility-scale
fixed tilt systems 27.64 21.57 1.43 42.79 2.14 78.43
*w/o soft cost
Table 10. Summary of system cost reduction potential [%] by sector in Japan
JAPAN [%] PV module
costs Inverter costs BoS hardware costs Installatio n costs Soft costs TOTA L Residential
rooftop systems 58.91 33.41 -32.74 30.93 35.02 35.02
Commercial
rooftop systems 39.33 51.57 17.04 78.27 55.59 45.73
Utility scale fixed
tilt systems 39.69 75.50 6.67 82.62 12.50 45.75
*w/o soft cost
5.1. Cost drivers and Market Barriers in Japan
5.1.1. International Competition in the Residential Sector
The Japanese market is characterized by high installation costs and dominated by module cost. Currently, high margins are earned in this market, but also expensive high quality modules are often used, which is a special characteristic of the Japanese market. Margins are high due to the protected nature as the residential segment is reserved for local installers. Due to high labor costs all cost components requiring domestic work force are above international average. A general laborer costs in Japan 37 $/h while in Germany 33 $/h, and an electrician costs in Japan 62 $/h while in Germany 52 $/h (all-inclusive average cost) [17].
Costs of racking and mounting are increased due to special structural requirements since Japan is a seismic active region and can also be hit by typhoons. Grid connection costs are the lowest in this segment, while cost for incentive application and customer acquisitions and financing may offer significant reduction potential.
Removal of market protection in the residential segment offers a clear potential for PV system cost reduction, especially for hardware and installation costs. Hidden margins on local products will also decrease if Japanese customers prefer not only domestic products. Installation times and wages spend for installers may decrease. The corresponding cost reduction potential is estimated at 20% when compared to Germany.
5.1.2. Advice on Policy Measures and Streamlining of Application Procedures
issue by EPC companies and was also described by Hahn [15]. Both METI and utilities need to provide more transparent guidelines and information for developers. There is still a significant gap
between approved projects and those already under construction despite METI’s revision of the
Renewable Energy Act in 2017, which sort out about 50% of approved projects that have not started operation for a long time.
The related delay increases transaction costs sometimes requires renewal of permits, and blocks new projects to obtain a grid connection permit. Moreover, the regulations on land use are in-transparent and cause long lasting application procedures that raise permission costs. Access to land is mentioned as a market barrier by international developers. Here, local governments need to improve the information on land-use and ease the application procedure to spur PV development. Finally, the application rush for FIT during the last three months of each consecutive fiscal year creates inefficiencies in the permitting process.
Another issue for improvement in Japan is the availability of abandoned agricultural land for the use of PV power plants. As described above, the dual-use of such fallow land both for PV and agricultural crop production is a good way to both lower PV system cost and also to open up the tight situation with regards to available areas for ground-mounted PV systems. Although the Ministry of Agriculture, Forestry and Fisheries (MAFF) approved the installation of PV systems on existing crop-producing farmland in 2013, this could be further promoted.
Also the already mention floating PV systems, e.g. on retention basins, might be further promoted in Japan. As there are numerous retention basins in the country, this is another option to both bring down PV system cost as well as open up new areas for PV power plants.
Most importantly, the change to a market-driven system and to self-consumption PV systems will strongly lower PV system cost, as experienced by Germany recently. Japan can take advantage of this experience. This will particularly increase the number of commercial rooftop systems e.g. on factories and supermarkets. A market-driven system will most likely significantly reduce margins and lower PV module price and inverter prices.
6. Conclusions
In this Section the analysis of opportunities to reduce the solar PV system costs until 2025 in Japan are summarized.
6.1. Solar Modules
Solar PV modules account for about 50% of the total PV system cost in the residential segment. The cost reduction potential in this category is quite significant and amounts to about 70%. This is due to the fact that for residential projects mainly domestic PV modules are used, which have mostly a high quality and higher price. According to interviews with installers in Japan, residential customers are increasingly using also oversees modules, if the price is lower and thereby increased their profitability of the PV system. We found that module costs have come down recently in Japan, but are on average still higher compared to Germany. According to PV developers and EPC companies, overseas manufacturers often have different price ranges depending on the region of sale. For projects, which still receive a higher FIT, the module price will be adjusted accordingly.
Nevertheless, according to the Renewable Energy Institute (Tokyo) the module cost disparity was reduced in the last 2-3 years. EPC companies in Japan report that module prices of about 42 ¥/W can be obtained in Japan in 2017, which is similar to prices in Europe.
As mentioned in Section 6.2 it is not easy to change the type of PV module for a project that has been accredited by METI, which makes it difficult for project developers and EPC companies to negotiate lower prices with manufacturers. A significant cost reduction potential is therefore to change the regulation with regards to METI specification of the module type. Moreover, lowering the cost of Japanese PV module manufacturers will be significant not only on the Japanese PV market
but also to hold one’s ground and expand in overseas markets such as in the MENA region, USA,
6.2. Inverters
In Section 4.2 we described that the Japanese inverter market is strongly dominated by domestic manufacturers (73% market share in 2016). This is due to the fact that Japan has a large number of strong and reputed inverter manufacturers such as TMEIC, Omron, Tabuchi, Panasonic, Hitachi and others. The Japan Electrical Safety & Environment Technology Laboratories (JET) certification is a requirement for solar inverters in Japan. It is a complex procedure that and can be only undertaken in Japan. Feedback from European inverter manufacturers showed that the JET certification is a high hurdle and one of the reasons that the Japanese inverter market is strongly dominated by domestic manufacturers. Simplifying of the JET certification and thereby lowering market barriers offers a clear potential for PV system cost reduction.
We estimate the inverter cost reduction potential at 40 and 80% for the residential and utility sectors, respectively. As with PV module costs, a further FIT reduction will result in lower inverter prices in Japan due to lower margins in inverters, pressure to innovate, and further market consolidation.
6.3. BoS Hardware
The achievement of best practice BoS cost requires at least Streamlined logistics and a local supply chain
Volume in order to realize economies of scale
Integrated installation concepts for efficient use of labor and short construction periods
The above listed items are mainly within the responsibility of the EPC companies. Technical requirements and standards for mounting structure manufacturers in Japan are stringent due to differences in the natural environmental, such as typhoons and earthquakes, as compared to many European countries. It was already mentioned that the METI recently defined a new wind load standard, and not many oversee manufacturers have adapted to the new rules. Clearly, this is a barrier for further cost reduction, as the environmental conditions in Japan force such stringent standards.
Despite this fact, there is potential to improve PV system designs to further reduce BoS hardware cost and learn from the German experience during the last 10 years. In particular in the commercial rooftop segment the cost reduction potential is estimated at around 20% when compared to Germany.
6.4. Installation
Japan shows significantly higher installation cost compared to Germany in all three analyzed sectors. The difference is about 30% for the residential sector and about 80% for the commercial and utility sectors. In Section 4.2 the main reasons for higher installation costs are analyzed and described. The higher labor costs in Japan are difficult to change and are not a PV-specific issue. However, the mentioned tight situation on the construction workers labor market in Japan due to the Tohoku earthquake reconstruction and the upcoming Tokyo Olympics is a temporary issue and might ease afterwards. As mentioned in Section 4.2 the construction times are significantly higher in Japan than other countries and Germany in particular. Reasons for longer construction times are e.g. earth screws while Germany mainly uses ramming pile foundations and more difficult site preparation due to complex sites. The significantly longer construction times that are reported by EPC companies could be reduced by various measures. For the all sector, a better standardization of installation processes and training of installation personnel can significantly reduce installation time and cost. Advanced mounting system design and use of different foundations in caser of ground-mounted systems, if possible, might reduce cost.
6.5. Soft Costs
The cost reduction potential in this cost category amounts from about 15% for utility-scale systems to nearly 60% in the commercial sector, while the residential rooftop systems have a cost reduction potential of nearly 40%. In particular margins have a large impact on overall PV system cost. Margins on PV modules are high in Japan and can be attributed to soft cost. Responsibility here lies mainly with the EPC and installers. Therefore, this offers a large cost reduction potential. Secondly, depending on the project type and the size of the project, cost for project development and permitting, customer acquisition etc. can comparatively be large in Japan and also offer significant potential for cost reduction. Here, the responsibility mainly lies with the project developers and EPC. In this case, Japanese developers and EPCs can learn from and utilize the long-term experience of Germany in the PV business to lower and lower the overall PV system cost. This is already taking place through joint ventures between Japanese companies and German solar EPC companies and will surely have an impact on the PV business in Japan.
6.6. Reduction of FIT
Continuous FIT tariff reductions will increase the pressure on margins especially in the utility-scale segment. Developers usually calculate backwards, based in the offered FIT - much can the margin be increased to still offer reasonable returns. The cost reduction potential on the soft cost is estimated at up to 40% in the residential segment, up to 60% in the commercial and up to 15% in the utility segment. A further reduction of the FIT incentive scheme will also result in a further market consolidation in Japan.
Author Contributions: Conceptualization, D.G.; methodology, D.G.; formal analysis, D.G., R.H. and T.L.; investigation, D.G., R.H. and T.L.; writing—original draft preparation, R.H. D.G. and T.L.; writing—review and editing, D.G., R.H. and T.L.; project administration, D.G.; funding acquisition, D.G.
Funding: This research was funded by the International Renewable Energy Agency (IRENA).
Acknowledgments: We thank Michael Taylor of IRENA for discussions and for reviewing the paper. We also acknowledge Jonas Wuth for preparing the figures. This paper was written during a Japan Society for the Promotion of Science (JSPS) fellowship stay of R.H. at Kyoto University, Japan. We gratefully acknowledge the support from the JSPS and Prof. Susumu Tohno for his hospitality and support.
Conflicts of Interest: The authors declare to have no conflict of interest. The funders played a role in the design of the study and in the decision to publish the results. The funders played no role in the collection, analyses, or interpretation of data, and in the writing of the manuscript.
References
1. Jäger-Waldau, A., PV Status Report 2018, EUR 29463 EN, Publications Office of the European Union, Luxembourg, 2018, ISBN 978-92-79-97465-6, doi:10.2760/826496, JRC113626.
2. RTS Corporation, PV Market in Japan 2017 – Current Status & Future Prospect, 2017.
3. Japan Photovoltaic Energy Association, PV Shipment Statistics in Japan: Fiscal 2017, 1st Quarter”, 2017, Available online: http://www.jpea.gr.jp/en/statistic (accessed on 23 March 2019)
4. REN21, Renewables 2018 Global Status Report, 2018, ISBN 978-3-9818911-3-3. Available online:
http://www.ren21.net/status-of-renewables/global-status-report (accessed: on 23 March 2019) 5. deea solutions GmbH, Solar PV Balance of System Cost Reduction Potential to 2025, 2016. 6. Bebon, J., The Top 10 Tracker Suppliers in 2016, 2017; Available online:
https://gamechangesolar.com/downloads/The%20Top%2010%20PV%20Tracker%20Suppliers%20Of%202
016%20-%20Solar%20Industry.pdf (accessed on 23 March 2019)
7. International Renewable Energy Association, Renewable Capacity Statistics 2017, 2017, Abu Dhabi. Available online: https://www.irena.org/publications/2017/Mar/Renewable-Capacity-Statistics-2017
(accessed on 23 March 2019)
8. Choi, Y.-K., Lee, N.-H. and Kim, K.-J., Empirical Research on the efficiency of Floating PV systems compared with Overland PV Systems, Proceedings of the 3rd International Conference on Circuits, Control, Communication, Electricity, Electronics, Energy, System, Signal and Simulation, 2013, Available online:
9. Renewable Energy Institute, Comparing Prices and Cost of Solar PV in Japan and Germany – The Reasons Why Solar PV is more expensive in Japan, 2016. Available online:
https://www.renewable-ei.org/en/images/pdf/20160331/JREF_Japan_Germany_solarpower_costcomparison_en.pdf (accessed on
23 March 2019)
10. Yamada, H. and Ikki, O., National Survey Report of PV Power Applications in Japan, IEA-PVPS, 2016. Available online: http://www.iea-pvps.org/index.php?id=93&eID=dam_frontend_push&docID=4050
(accessed on 23 March 2019)
11. Yamaya, H., Ohigashi, T., Matsukawa, H., Kaizuka, I. and Osamu, I., PV Cost Analysis in the Japanese PV Market, IEEE, 2016.
12. PV Exchange; Available online: https://www.pvxchange.com (accessed on 23 March 2019)
13. Perea, A. et al., Solar Market Insight Report 2016 Year In Review, GTM Research, 2017, Available online:
https://www.seia.org/research-resources/solar-market-insight-report-2016-year-review (accessed on 23 March 2019)
14. Bermudez, V., Japan, the new “El Dorado” of Solar PV?, Journal of Renewable and Sustainable Energy,2018, 10, 020401-1-020401-6.
15. Hahn, E., The Japanese Solar PV Market and Industry, EU-Japan Centre for Industrial Cooperation, 2014, Available online: https://www.eu-japan.eu/sites/default/files/publications/docs/pvinjapan.pdf (accessed on 23 March 2019)
16. Ogimoto, K., Kaizuka, I., Ueda, Y., and Oozeki, T., A Good Fit: Japan's Solar Power Program and Prospects for the New Power System. IEEE Power and Energy Magazine, 2013, 11, 65-74. 17. Turner and Townsend, International construction market survey 2017, 2017, Available online:

![Figure 1. Evolution of solar PV module costs; Source: [12]](https://thumb-us.123doks.com/thumbv2/123dok_us/7961664.1320715/8.595.104.431.357.506/figure-evolution-solar-pv-module-costs-source.webp)
![Figure 3. Historical development of installations [MWdc] per market segment (Source: deea solutions $based on GTM data)](https://thumb-us.123doks.com/thumbv2/123dok_us/7961664.1320715/12.595.163.437.489.693/figure-historical-development-installations-market-segment-source-solutions.webp)
![Figure 7. Utility-scale systems cost breakdown [$/kWp]](https://thumb-us.123doks.com/thumbv2/123dok_us/7961664.1320715/14.595.191.422.184.348/figure-utility-scale-systems-cost-breakdown-kwp.webp)
![Figure 8. Domestic shipments of PV modules in the last 7 years (production for domestic market and import), and market share of Japanese manufacturers (data source: [3])](https://thumb-us.123doks.com/thumbv2/123dok_us/7961664.1320715/15.595.160.446.427.644/figure-domestic-shipments-modules-production-domestic-japanese-manufacturers.webp)
