ISSN 2348 – 7968
Iteration Reduction K Means Clustering Algorithm
Kedar Sawant1 and Snehal Bhogan2 1
Department of Computer Engineering, Agnel Institute of Technology and Design, Assagao, Goa 403507, India
2
Department of Computer Engineering, Agnel Institute of Technology and Design, Assagao, Goa 403507, India
Abstract
Data mining is a process of extracting hidden predictive information from enormous databases. It involves analysis of data from different perspectives and summarizes it into valuable information. One of the key techniques in data mining is Clustering. In cluster analysis, a set of objects are grouped based on the similarity to each other, called a cluster than to those in other groups. A clustering problem can be solved by one of the simplest unsupervised learning algorithm called K Means. K Means partitions N observations into K clusters such that each observation belongs to the cluster with the nearest mean. As the initial cluster centroids are selected randomly, the number of iterations increases, as size of dataset increases. In this paper, a method has been proposed to overcome the above mentioned drawback which is based on sorting and dividing.
Keywords: Data Mining, Clustering, Euclidian Distance Measure, K Means.
1. Introduction
The amount of data preserved in an electronic format is dramatically increasing in recent times. Most organizations have accumulated a great deal of data, but what they really want is information. Data mining[1] is a process of extracting hidden predictive information from enormous databases. The main objective of data mining is to analysis of data from different perspectives and summarizes it into valuable information. It uses sophisticated statistical analysis and modeling techniques to uncover patterns and relationships hidden in large databases.
Various algorithms and techniques[4][1] like Classification, Clustering, Regression, Neural Networks, Association Rules, Decision Trees, etc., are used for discovering knowledge from databases.
Some of the common and useful data mining techniques are:
Classification is a supervised learning technique. It maps the data into predefined groups.
Decision Tree is a flow chart like tree structure, where each node denotes test on an attribute value, each branch represents the result of the test, and tree leaves represent classes.
Association rule mining is the discovery of association relationships or correlation among a set of items.
Neural networks are used to identifying patterns or trends in data and well suited for prediction or forecasting needs.
Prediction is a data mining technique that is used to identify the relationship between independent variables and relationship between dependent and independent variable.
Cluster analysis[2] is a technique in data mining. Clustering involves the process of grouping the objects which are having similar features and each of this group is referred to as a cluster. The clustering process can be carried out by one of the simplest unsupervised learning algorithm called K Means.
In K Means clustering algorithm, the initial cluster centroids are selected randomly, and then the algorithm builds and refines the specified number of clusters. As the dataset size increases, the number of iterations in the loop increases. Due to which the standard K-means is computationally more time consuming.
ISSN 2348 – 7968
2. Literature Survey
In [3], an enhanced K Means algorithm have been introduced to improve the time complexity using uniform data. The clusters are made in two phases. In the first phase, using the similarity, initial clusters are formed and then in the second phase the final clusters are formed.
In [5] , the K Means clustering algorithm is used in various applications due to its simplicity and implementation. The accuracy of K means algorithm reduces, as a result of randomly selecting the initial k centers. Therefore, in this paper, different approaches for initial centers selection for K Means algorithm are surveyed. Also, gives the comparative analysis of original K Means and improved K Means Algorithm.
In [6] the researchers have studied the different approaches to K Means clustering, and the analysis of different datasets using Original K Means and other modified algorithms.
In Enhancing K-means Clustering Algorithm with Improved Initial Center [7], main aim is to reduce the initial centroid for K Mean algorithm. It uses all the clustering algorithm results of K Means and reaches its local optimal. This algorithm is used for the complex clustering cases with large numbers of data set and many dimensional attributes because Hierarchical algorithm in order to determine the initial centroids for K Means.
In [8] the K Means clustering algorithm is introduced. The method for the making K Means clustering algorithm more efficient and effective is proposed in this paper. In this paper, using the unique data set the time complexity improved.
In K Means algorithm based on the initial mean of the cluster[9], the whole data space is divided into segments (k*k) and then the frequency of data points in each segment is calculated The segment with the highest frequency will have maximum probability of having the centroid. If more than one consecutive segments have the same frequency then those segments are merged. Later, the distances of data points and centroids are calculated and the process continues in the same manner
3. Cluster Analysis
Cluster analysis [1] is an analysis technique where in the objects with similar characteristics are determined and classified or grouped accordingly. Clustering uses the concepts of similarities and differences. Different types of measures are used in determining similarities and differences. In this paper, Euclidian distance measure is used.
2.1
Euclidian Distance Measure
The Euclidian distance measure is frequently used as a distance measure in two dimensional planes. Euclidean distance between two points in a space of r dimensions is
given as where xij, xjk are the
projections of points i and j on dimension k; (k = 1,2,…,r).
2.2 K Means Algorithm
The K Means algorithm in cluster analysis uses partitioning method. Consider a set of m data points in real d-dimensional space, D and an integer k, the problem is to determine a set of k points in real dimensions, called centers, to minimize the mean squared distance from each data point to its nearest center.
ISSN 2348 – 7968
The K Means algorithm based on the initial parameters defines the random cluster centroids. According to the proximity between the mean value of the case and the cluster centroids, each successive case is added to the cluster. The clusters are then re-analyzed to determine the new centroids point. This procedure is repeated for each
data object
.
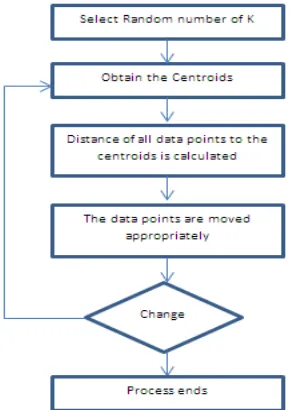
Figure 1 shows how to process of the standard K Means clustering algorithm [2] in steps.
1) Place K points into the space represented by the objects that are being clustered. It represents initial group centroids.
2) Assign each object to the group that has the closest centroids.
3) When all objects have been assigned, recalculate the positions of the K centroids.
4) Repeat Steps 2 and 3 until the centroids no longer move. This produces a splitting of the objects into groups from which the metric to be minimized can be calculated.
4. Proposed Work
4.1 Proposed Method
The standard K Means method comprises of randomly selecting k initial centroids, then calculate the distance between each data value and each cluster center and assign it to the nearby cluster, update the averages of all clusters, repeat this process until the criterion is not match. With this method, there is an increase the number of iterations in getting the final clusters.
To improvise on this, the proposed method works in two phases: In the first phase, the entire data set is sorted with respect to the first data point and then divides the sorted data set into k subsets. For each subset the center data point is found and this data point is designated as the initial centroid for that subset.
In the second phase, repeat the basic K Means algorithm process on the data set after selection of k initial centroids until the no more movement of data points take place between the clusters.
4.2
Proposed algorithm
In the proposed clustering method discussed in this paper, for the original k-means algorithm is modified to reduce the number of iterations in getting the final clusters.
Algorithm 1
Input: D is the set of all the data points k is number of clusters
Output: A set of k clusters.
Steps:
1. For computing initial centroids follow Algorithm 2 2. Compute the distance of each data point, pi (1<=i<=n)
to all the centroids cj (1<=j<=k) as d(pi, cj);
3. For each data point pi, find the closest centroid cj and assign di to cluster j.
4. Set Cluster[i]=j; // j:Closet cluster. 5. Set AdjacentDist[i]= d(pi, cj);
6. For each cluster j (1<=j<=k), recalculate the centroids; 7. Repeat
8. For each data-point pi,
8.1 Compute its distance from the centroid of the present nearest cluster;
8.2 If this distance is less than or equal to the present nearest distance, the data-point stays in the cluster;
Else
8.2.1
For every centroid cj (1<=j<=k).Compute the distance d(pi, cj);
Endfor;
8.2.2 Assign the data-point di to the cluster with the nearest centroid cj. 8.2.3 Set Cluster[i]=j;
8.2.4 Set AdjacentDist [i]= d(pi, cj); Endfor;
ISSN 2348 – 7968
Algorithm 2: For initial centroids
Input: D is the set of all the data points k is number of subsets
Output: A set of k initial centroid. Steps:
1. Sorted the entire data set with respect to the first data point.
2. Divide the sorted data set into k subsets
3. For each subset find the center data point and consider this data point as the initial centroid for that subset.
5. RESULT AND DISCUSSION
For our experiments, we have chosen one dimensional dataset consisting of 100 data points. The data points values range between 100 to 500 as given below:
449,198,187,367,452,486,277,254,157,118,404,246,474,4 72,215,361,374,333,383,315,226,354,411,333,453,340,11 4,251,393,415,107,400,137,115,286,233,215,377,101,295, 214,305,325,464,403,212,294,377,168,234,380,192,492,1 13,382,277,397,384,205,402,198,293,425,178,348,332,19 8,412,315,146,286,140,374,363,350,488,291,308,261,384, 253,487,405,388,157,475,342,228,432,335,399,477,192,1 83,136,374,225,107,483,493
The standard K Means algorithm was executed on the above data set and the number of iterations required to obtain the final two clusters is shown below:
Iteration Number:1
Cluster 1:198 187 157 118 215 226 114 107 137 115 215 101 214 212 168 192 113 205 198 178 198 146 140 157 192 183 136 225 107
m1=167
Cluster 2:449 367 452 486 277 254 404 246 474 472 361 374 333 383 315 354 411 333 453 340 251 393 415 400 286 233 377 295 305 325 464 403 294 377 234 380 492 382 277 397 384 402 293 425 348 332 412 315 286 374 363 350 488 291 308 261 384 253 487 405 388 475 342 228 432 335 399 477 374 483 493
m2=367
--- Iteration Number:2
Cluster 1:198 187 254 157 118 246 215 226 114 251 107 137 115 233 215 101 214 21
2 168 234 192 113 205 198 178 198 146 140 261 253 157 228 192 183 136 225 107
m1=184
Cluster 2:449 367 452 486 277 404 474 472 361 374 333 383 315 354 411 333 453 34
0 393 415 400 286 377 295 305 325 464 403 294 377 380 492 382 277 397 384 402 29
3 425 348 332 412 315 286 374 363 350 488 291 308 384 487 405 388 475 342 432 33
5 399 477 374 483 493 m2=383
Iteration Number:3
Cluster 1:198 187 277 254 157 118 246 215 226 114 251 107 137 115 233 215 101 214 212 168 234 192 113 277 205 198 178 198 146 140 261 253 157 228 192 183 136 225 107
m1=188
Cluster 2:449 367 452 486 404 474 472 361 374 333 383 315 354 411 333 453 340 393 415 400 286 377 295 305 325 464 403 294 377 380 492 382 397 384 402 293 425 348 332 412 315 286 374 363 350 488 291 308 384 487 405 388 475 342 432 335 399 477 374 483 493
m2=386
--- Iteration Number:4
Cluster 1:198 187 277 254 157 118 246 215 226 114 251 107 137 115 286 233 215 101 214 212 168 234 192 113 277 205 198 178 198 146 286 140 261 253 157 228 192 183 136 225 107
m1=193
Cluster 2:449 367 452 486 404 474 472 361 374 333 383 315 354 411 333 453 340 393 415 400 377 295 305 325 464 403 294 377 380 492 382 397 384 402 293 425 348 332 412 315 374 363 350 488 291 308 384 487 405 388 475 342 432 335 399 477 374 483 493
m2=390
--- Iteration Number:5
Cluster 1:198 187 277 254 157 118 246 215 226 114 251 107 137 115 286 233 215 101 214 212 168 234 192 113 277 205 198 178 198 146 286 140 291 261 253 157 228 192 183 136 225 107
m1=195
Cluster 2:449 367 452 486 404 474 472 361 374 333 383 315 354 411 333 453 340 393 415 400 377 295 305 325 464 403 294 377 380 492 382 397 384 402 293 425 348 332 412 315 374 363 350 488 308 384 487 405 388 475 342 432 335 399 477 374 483 493
ISSN 2348 – 7968
--- Iteration Number:6
Cluster 1:198 187 277 254 157 118 246 215 226 114 251 107 137 115 286 233 215 101 214 212 168 234 192 113 277 205 198 178 198 146 286 140 291 261 253 157 228 192 183 136 225 107
m1=195
Cluster 2:449 367 452 486 404 474 472 361 374 333 383 315 354 411 333 453 340 393 415 400 377 295 305 325 464 403 294 377 380 492 382 397 384 402 293 425 348 332 412 315 374 363 350 488 308 384 487 405 388 475 342 432 335 399 477 374 483 493
m2=391
---
We implemented the proposed algorithm on k- means which included sorting of the data set and then dividing it into subsets, obtaining the center data point of each subset as the initial centroid and then carrying out the standard K Means algorithm. The number of iterations required to obtain the final two clusters are shown below:
Iteration Number:1
Cluster 1:101 107 107 113 114 115 118 136 137 140 146 157 157 168 178 183 187 192 192 198 198 198 205 212 214 215 215 225 226 228 233 234 246 251 253 254 261 277 277 286 286 291 293 294 295 305
m1=204
Cluster 2:308 315 315 325 332 333 333 335 340 342 348 350 354 361 363 367 374 374 374 377 377 380 382 383 384 384 388 393 397 399 400 402 403 404 405 411 412 415 425 432 449 452 453 464 472 474 475 477 483 486 487 488 492 493
m2=398
--- Iteration Number:2
Cluster 1:101 107 107 113 114 115 118 136 137 140 146 157 157 168 178 183 187 192 192 198 198 198 205 212 214 215 215 225 226 228 233 234 246 251 253 254 261 277 277 286 286 291 293 294 295
m1=202
Cluster 2:305 308 315 315 325 332 333 333 335 340 342 348 350 354 361 363 367 374 374 374 377 377 380 382 383 384 384 388 393 397 399 400 402 403 404 405 411 412 415 425 432 449 452 453 464 472 474 475 477 483 486 487 488 492 493
m2=397
---
Iteration Number:3
Cluster 1:101 107 107 113 114 115 118 136 137 140 146 157 157 168 178 183 187 192 192 198 198 198 205 212 214 215 215 225 226 228 233 234 246 251 253 254 261 277 277 286 286 291 293 294 295
m1=202
Cluster 2:305 308 315 315 325 332 333 333 335 340 342 348 350 354 361 363 367 374 374 374 377 377 380 382 383 384 384 388 393 397 399 400 402 403 404 405 411 412 415 425 432 449 452 453 464 472 474 475 477 483 486 487 488 492 493
m2=397
--- The above experimental result shows that the proposed methodology satisfies the stated goal, by reducing the number of iterations from 6 (standard K Means algorithm) to 3.
6. Conclusion
In this paper the standard K Means algorithm is improved by reducing the number of iterations required for obtaining the final clusters. The proposed methodology was implemented and then compared the results obtained using K Means clustering algorithm. It is understood that the proposed methodology of first sorting the data set, dividing into k subsets and then obtain the initial centroids as the center data point of each subset and then carrying out standard K Means clustering algorithm reduces the number of iterations required for obtaining the final clusters. The future scope of the proposed algorithm would be to test it on higher dimensional data set.
References
[1] Jiawei Han and Micheline Kamber, Data Mining – Concepts and techniques, Elsevier
[2] Dr.Naveeta Mehta and Shilpa Dang, ”A REVIEW OF CLUSTERING TECHIQUES IN VARIOUS APPLICATIONS FOR EFFECTIVE DATA MINING”. IJRIM Volume 1, Issue 2 (June, 2011) (ISSN 2231-4334) [3] Napoleon, D. and P.G. Lakshmi,. "An Efficient K-means
Clustering Algorithm for Reducing Time Complexity using Uniform Distribution Data Points," in Trendz in Information Sciences and Computing (TISC), Chennai. 2010.
[4] Sumit Garg and Arvind K. Sharma “Comparative Analysis of Data Mining Techniques on Educational Dataset”, International Journal of Computer Applications (0975 – 8887) Volume 74– No.5, July 2013
ISSN 2348 – 7968
[6] Dr. M.P.S Bhatia1 and Deepika Khurana “Experimental study of Data clustering using k- Means and modified algorithms”, International Journal of Data Mining & Knowledge Management Process (IJDKP) Vol.3, No.3, May 2013.
[7] Madhu Yedla, Srinivasa Rao Pathakota and T M Srinivasa, “Enhancing K-means Clustering Algorithm with Improved Initial Center”, International Journal of Computer Science and Information Technologies, Vol. 1 (2) , 2010, 121-125 [8] Napoleon, D. and P.G. Lakshmi, “An efficient K-Means
clustering algorithm for reducing time complexity using uniform distribution data points”, in Trendz in Information Sciences and Computing (TISC), Chennai. 2010.
[9] Singh, R.V. and M.P. Bhatia,. "Data Clustering with Modified K-means Algorithm," in International Conference on Recent Trends in Information Technology (ICRTIT), Chennai, Tamil Nadu. 2011
First Author has completed his B.E. degree in Information Technology in 2009 and M.E. degree in Computer Science and Engineering in 2013. He has worked as an Assistant Professor in Information Technology Dept. of Shree Rayeshwar Institute of Engineering And Information Technology, Shiroda-Goa for 2 years and currently working as an Assistant Professor in Computer Engineering Dept. of Agnel Institute of Technology and Design, Assagao-Goa since June 2015. He is currently a ISTE lifetime member. He has presented till now 5 research paper in various International online journals and conferences. His research interest includes data mining and networking.
Second Author has completed her B. E. degree in Computer