Evaluation of air-displacement plethysmography in children aged
5 – 7 years using a three-component model of body composition
J. C. K. Wells
1*, N. J. Fuller
1, A. Wright
2, M. S. Fewtrell
1and T. J. Cole
3 1MRC Childhood Nutrition Research Centre, Institute of Child Health, 30 Guilford Street, London WC1N 1EH, UK 2
MRC Human Nutrition Research, Elsie Widdowson Laboratory, Fulbourn Road, Cambridge CB1 9NL, UK 3
Department of Paediatric Epidemiology and Biostatistics, Institute of Child Health, 30 Guilford Street, London WC1N 1EH, UK
(Received 12 August 2002 – Revised 18 March 2003 – Accepted 13 May 2003)
The aim of the present study was to evaluate air-displacement plethysmography (ADP) in children aged 5 – 7 years. Body-composition measurements were obtained by ADP, 2H dilution and anthropometry in twenty-eight children. Calculation of body volume by ADP
was undertaken using adult and children’s equations for predicting lung volume and surface area. Fat-free mass (FFM) was calculated using a three-component model. Measured FFM hydration was then compared with values from the reference child. Differences between measured and reference hydration were back-extrapolated, to calculate the error in ADP that would account for any disagreement. Propa-gation of error was used to distinguish the contributions of methodological precision and biological variability to total hydration variabil-ity. The use of children’s equations influenced the results for lung volume but not surface area. The mean difference between measured and reference hydration was 0·6 (SD 1·7) % (P,0·10), equivalent to an error in body volume of 0·04 (SD 0·20) litres (P,0·30), and in per-centage fat of 0·4 (SD1·9) (P,0·28). The limits of agreement in individuals could be attributed to methodological precision and biological variability in hydration. It is concluded that accuracy of ADP was high for the whole group, with a mean bias of,0·5 % fat using the three-component model, and after taking into account biological variability in hydration, the limits of agreement were around^2 %
fat in individuals. Paediatric rather than adult equations for lung volume estimation should be used.
Fat mass: Fat-free mass: Bodpod: Body composition: Children
Recent decades have seen major advances in the non-inva-sive measurement of body composition. Such progress is reflected in greater understanding of body composition in health and disease, particularly in adults. Similar progress in children has been hindered by practical difficulties, and by complexity arising from chemical immaturity of the fat-free mass (FFM). Paediatric patients, in whom body-composition alterations are often most marked, there-fore remain difficult to study.
The impact of disease on body composition is best addressed by applying multi-component models. Such models, combining measurements of different body proper-ties, are not dependent on assumed constant properties of FFM, and are predicted to be more accurate than two-com-ponent models (Fulleret al.1992; Wellset al.1999). The three-component (3C) model, based on measurements of weight (WT), total body water (TBW) and body volume (BV), distinguishes fat, water and fat-free dry tissue. The four-component model further incorporates a measurement
of whole-body bone mineral content and distinguishes fat, water, mineral and protein, although the proportion of WT attributed to protein also includes free amino acids, nucleic acids, urea and glycogen (Fuller et al. 1992). However, there is still some concern as to the accuracy of dual-energy X-ray absorptiometry (DXA) data for bone mineral content, with values from Lunar instrumentation being approximately 15 % higher than values from Hologic instrumentation (Tothill et al. 1994). Thus the 3C model may represent a more robust reference method until this discrepancy is resolved.
In practical terms, measurements of WT and TBW pre-sent no difficulties in younger age groups, and the develop-ment of DXA likewise allows measuredevelop-ment of bone mineral content in all age groups. The limiting measure-ment for multi-component models in children is therefore BV, traditionally measured by underwater weighing (UWW). This technique has been used in children as young as 5 years (Hewitt et al. 1993; Reillyet al.1995),
*Corresponding author:Dr J. Wells, faxþ44 20 7831 9903, email [email protected]
Abbreviations: ADP, air-displacement plethysmography; BD, body density; BV, body volume; 3C, three-component; DXA, dual-energy X-ray absorptiometry; FFM, fat-free mass; FM, fat mass; FRC, functional residual capacity; HT, height; SA, surface area; SAA, surface area artifact; TBW, total body water; TGV, thoracic gas volume; TV, tidal volume; UWW, underwater weighing; Vb, biological variation; Vm, methodological
variation; Vr, residual variation; Vt, total observed variation; WT, weight.
but is too demanding for widespread use or application in patients. Whole-body air-displacement plethysmography (ADP) has therefore been developed as a more acceptable alternative to UWW (Dempster & Aitkens, 1995). It has been successfully validated in adults (McCrory et al.
1995; Nun˜ez et al. 1999; Wagner et al. 2000), although additional studies suggest that ADP may slightly overesti-mate body density (BD) compared with UWW (Collins
et al.1999). The technique is also readily accepted in chil-dren (Nun˜ezet al.1999; Dewitet al.2000; Wells & Fuller, 2001). However, its validity in younger age groups remains uncertain.
Both accuracy and precision are potential problems when applying ADP to younger age groups, due to the fact that the equipment is designed for adult body size. It has recently been shown that ADP generally has precision superior to UWW in both children and adults, but is prone to occasional rogue values. These can be eliminated by performing pairs of tests, and discarding results differing in BD by .0·007 kg/l (Wells & Fuller, 2001). In terms of accuracy, two studies have reported no difference in children’s BD assessed by ADP and UWW (Dewit et al.
2000; Demerath et al. 2002), while two others have shown a small bias (Nun˜ez et al. 1999; Lockner et al.
2000). However, validation of ADP against UWW in younger subjects is confounded by the difficulty of adjust-ing underwater WT for lung volume. For practical reasons, residual lung volume is usually measured on land, and the resulting value then assumed to apply to the measurement of underwater WT (Nun˜ezet al.1999; Lockneret al.2000; Demerath et al. 2002). This approach may generate bias, and UWW is therefore a problematic reference method for evaluating ADP in younger age groups. The more appropriate approach, of measuring lung volume simul-taneously with underwater WT, has been used in children only rarely (Dewitet al.2000).
In the present study an alternative approach has therefore been adopted, by using the hydration of FFM as the refer-ence instead of BV or BD, as described later (p. 701). Our study had two main aims: (1) to measure body composition in children aged 5 – 7 years using a 3C model, and to com-pare empirical and reference values for the hydration of FFM, in order to evaluate ADP; (2) to investigate the effect of using children’sv. adult equations for predicting lung volume and surface area (SA) in ADP calculation.
Methods
A sample of twenty-eight healthy children aged 5 – 7 years was recruited from local schools, and visited our laboratory for a 40 min measurement session. Ethical permission was granted by the ethical committees of Cambridge Health Authority and the former MRC Dunn Nutrition Unit.
Anthropometry
WT was measured with the child dressed in a swimsuit using the scales integral to the ADP instrumentation, previously validated against weights of known value (Wells et al. 1999). Height (HT) was measured to the nearest 0·5 cm using a portable stadiometer (Karrimetre;
Castlemead, Ware, UK). BMI was calculated as WT/HT2 (kg/m2). Skinfold thickness was measured at the biceps, tri-ceps, subscapular and supra-iliac sites using Holtain calli-pers. The mean of three measurements was used at each site. Waist and hip circumferences were measured with a soft tape. All skinfold measurements were made on the left side of the body.
2H dilution
TBW was determined by2H-labelled water dilution with a dose equivalent to 0·05 g/kg body WT. Doses were given made up as fruit squash, and saliva samples collected pre-dose and 4 h post-dose using absorbent salivettes (Sarstedt, Nu¨mbrecht, Germany). Samples were analysed in duplicate, as described by Hoffman et al. (2000). Briefly, they were equilibrated with H2gas in the presence
of a catalyst and the enrichment of the equilibrated gas measured using an isotope ratio mass spectrometer (Micro-mass, Altrincham, Cheshire, UK). Precision of the analyses was, for pre-dose samples, 0·13 parts per million SD at an average of 152·31 parts per million and for post-dose samples 0·224 parts per million SD at an average of 221·64 parts per million. These precision values produce an error of 0·1 % on a TBW measurement. 2H-labelled water dilution space was assumed to overestimate TBW by a factor of 1·044 (Racette et al. 1994). Fluid intake during the equilibration period, recorded to the nearest 50 ml, was subtracted from raw TBW values.
Body volume
BV was measured by ADP using Bodpod instrumentation (Life Measurement Instruments, Concord, CA, USA) according to the manufacturer’s instructions and rec-ommendations as described previously (Dewit et al.
2000). The subject wore a close-fitting swimsuit and swim-ming cap. Raw volume, appearing transiently on the screen during the measurement procedure, was recorded and used in subsequent calculations.
Raw BV requires adjustment for thoracic gas volume (TGV; litres) and air next to the skin (using the SA artifact (SAA; litres). Thus:
Actual BV ðlitresÞ ¼raw BVþ0·4 TGV2SAA; ð1Þ
where TGV was predicted using child-specific equations as well as the adult equations of Crapo et al.(1982) used in the manufacturer’s software. TGV was calculated as the sum of functional residual capacity (FRC; Crapo et al.
1982; Rosenthal et al. 1993) and half tidal volume (TV; Zapletalet al.1976). Equations 2 to 7 show the calculation of FRC and TV for adult males and females, and for boys and girls.
For adult males (Crapo et al.1982):
FRC ðlitresÞ ¼ ð0·0472£HTÞ þ ð0·0090£AÞ
25·290;
TV ðlitresÞ ¼1·2 ðmanufacturer’s valueÞ:
For adult females (Crapoet al.1982):
FRC ðlitresÞ ¼ð0·0360£HTÞ þ ð0·00310£AÞ
23·182;
TV ðlitresÞ ¼0·7 ðmanufacturer’s valueÞ:
ð3Þ
For boys (Zapletalet al.1976; Rosenthalet al.1993):
FRC ðlitresÞ ¼ ð0·02394£HTÞ21·716; ð4Þ
Log TV¼ ð1·8643£Log10HTÞ21·3956: ð5Þ
For girls (Zapletalet al. 1976; Rosenthal et al.1993):
FRC ðlitresÞ ¼ ð1·1478£HTÞ2ð0·0136745£HT2Þ
þ ð6·98227757£1025£HT3Þ
2ð1·2725216£1027£HT4Þ
233·928; ð6Þ
Log TV¼ ð1·8643£Log10HTÞ21·3956; ð7Þ
where HT is in cm, and A is age in years.
SA was calculated according to the formulae of both Dubois & Dubois (1916) and Haycock et al. (1978), in order to establish the effect of selecting children’sv. adult equations on final values. Equation 8 calculates SA for adults (Dubois & Dubois, 1916):
SA ðcm2Þ ¼71·84£WT0·425£HT0·725: ð8Þ
Equation 9 calculates SA for children (Haycock et al.
1978):
SA ðm2Þ ¼0·024265£WT0·5378£HT0·3964; ð9Þ
where WT is in kg, and HT is in cm. SAA was then calculated as 2k£SA, where k is a constant (personal communication, Life Measurements Instruments 1998).
Multi-component model
Fat mass (FM) was calculated by the 3C model using equation 10 (Fulleret al.1992):
FM ðkgÞ ¼ ð2·220£BVÞ2ð0·764£TBWÞ
2ð1·465£WTÞ: ð10Þ
FFM was calculated as the difference of WT and FM (see later; p. 701).
Evaluation of air-displacement plethysmography
The ideal method for evaluation of ADP would be another established technique measuring BV. However, as dis-cussed earlier (p. 700), the only existing such method is UWW, which is difficult for young children to cope with and may produce biased results due to the tendency
to adjust WT underwater for lung volume measured at a different time point. A relatively new technique, photonic scanning (Wellset al.2000), is not yet sufficiently refined for this purpose due to hardware limitations.
An alternative approach would be to validate ADP directly against an index of body composition itself, rather than against BV. The problem here is that each body-composition methodology incorporates assumptions concerning the composition of FFM. Thus this approach effectively tests agreement between theoretical assump-tions as well as agreement between physical techniques, and is not able to distinguish these two components of agreement. For example, using ADP in its basic form, BV is converted into body-composition values using Archimedes’ principle, which requires assumed constant values for the density of FM and FFM. It has previously been shown in children aged 8 – 12 years that the use of such assumed constant values of FFM density induces error in body-composition calculation (Wells et al.1999), and the present study contributes further to this issue.
However, not all aspects of FFM composition vary in the same way. As discussed in greater detail in the next section (p. 701), FFM hydration is a relatively reliable aspect of FFM composition during childhood. In the present study ADP was therefore evaluated through comparison of measured and reference values for FFM hydration. Hydration was calculated using the 3C model, using the methods described earlier (p. 700). Rearrangement of equation 10 gives:
FFM ðkgÞ ¼ ð2·465£WTÞ2ð2·220£BVÞ
þ ð0·764£TBWÞ: ð11Þ
Percentage FFM hydration was then calculated as (TBW/FFM)£100. This calculation method suffers from the limitation that TBW is incorporated into both numer-ator and denominnumer-ator of the equation; hence any error on TBW is included in both terms and hence largely cancels out due to covariance. A 1 % error in TBW is equivalent to only a 0·32 % absolute change in hydration fraction.
Age- and gender-specific values for FFM hydration were taken from the reference child (Fomonet al.1982), revised by Schoeller (1996), to improve correction of 2H-labelled dilution space for proton exchange. Using this comparative approach, differences between measured and reference hydration values could be extrapolated backwards in order to calculate the error in BV that would account for these differences. In order to support the use of assumed hydration values as a reference, a brief review of theoreti-cal and empiritheoreti-cal work is provided.
Review: hydration of fat-free mass in infants and children
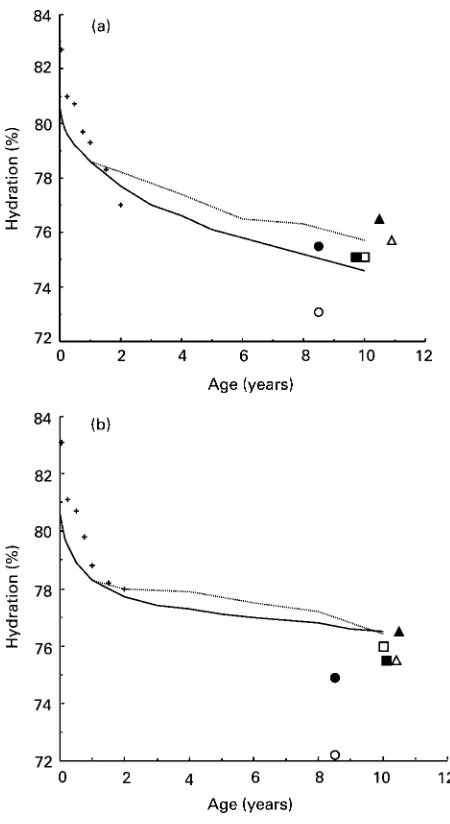
Hydration values for children from birth to 10 years were first calculated from multiple data sources by Fomon
10 years (girls). Values in between these time-points were predicted, taking into account changes in WT, length and subcutaneous skinfold thickness. These data were sub-sequently revised by Schoeller (1996), as described earlier (p. 701).
A further reworking of the data was conducted by Lohman (1989), who made modifications intended to take into account predicted linear changes with age of the water and mineral components of FFM. As can be seen in Figs. 1(a) and 1(b), the values of Fomon et al.
(1982) and Lohman (1989) agree within 1 % of each other throughout the age range of 1 – 10 years, with the Lohman values being slightly higher throughout in each gender.
Several multi-component studies of older children’s body composition have provided empirical support for the
predicted values (Figs. 1(a) and 1(b)). In infancy, empirical values determined by Butteet al.(2000) were close to the reference child values in each gender. The remaining studies have focused on the later period of childhood, and there are no data sets that specifically address children within the age range of 2 – 8 years. Studies by Boileauet al.(1984), Roemmichet al.(1997), Wellset al.
(1999) and Bray et al.(2001), all focusing on an average age of 10 years, show relatively good agreement, with all values being within 1 % of both the Fomon et al. (1982) and Lohman (1989) values except the Bray et al. (2001) data in boys. While three of these studies used models based on theoretical calculations, Brayet al.(2001) derived their model using empirical data from DXA as the refer-ence. Their model is therefore limited by the accuracy of DXA in measuring soft tissue, and DXA is not regarded as a gold standard for body composition.
A study of children with a slightly lower average age of 8·5 years by Hewittet al.(1993) showed poorer agreement with the Fomon et al. (1982) and Lohman (1989) data, depending on the gender of the child and the multi-com-ponent model used to calculate FFM. The markedly lower values obtained with the four-component model (72 – 73 %) may be attributed to an unsuitable adjustment for whole-body bone mineral density predicted from measurements of the forearm alone. However, values obtained with the 3C model were much closer to those of other studies.
Finally, further theoretical models of water distribution predict that FFM hydration is unlikely to vary beyond rela-tively narrow limits. Wang et al.(1999) have developed a physiological model, in which FFM hydration is shown to be determined by four factors: (a) hydration of body cell mass; (b) hydration of extracellular fluid; (c) extracellular solids:TBW ratio; (d) extracellular water:intracellular water ratio. These authors argue that well-established homeostatic regulatory mechanisms maintain cellular and extracellular hydration with great stability, such that fac-tors (a) and (b) vary minimally in healthy adults and can be assumed to be stable across the human lifespan. Factors (c) and (d) are predicted to vary with age, due to variation in extracellular solid mass, in the proportion of immature cells and in the extracellular fluid:cell mass ratio. Ratio (c) is low at birth, and increases rapidly to adolescence, while ratio (d) is maximal at birth and rapidly falls to the adult value. Manipulation of these ratios therefore allows prediction of FFM hydration values during growth, and the authors reported close agreement between the values of the reference child and their model.
In agreement with this model, assessments of FFM hydration variability between individuals in both adults (Fuller et al. 1992) and children aged 8 – 12 years (Wells
et al. 1999) show relatively low variability, in the order of ^1·5 %.
The present brief review has considered both empirical and theoretical support for the predicted values for FFM hydration of Fomon et al.(1982). It is concluded that the predicted values are consistent with theoretical models of cellular-level hydration ratios, and that almost all values obtained using theoretically derived models agree within 1 % of the predicted values both in infancy and in later
childhood. Values that differ by.1 % from the reference child values can mostly be attributed to inappropriate assumptions in the underlying calculations. The age- and gender-specific hydration values of the reference child have therefore been assumed to be an adequate reference for the present study. However, it is important to note that even relatively small errors in hydration imply signifi-cant errors in BV. The values used were 77·1, 77·0 and 76·9 % for boys aged 5, 6 and 7 years respectively, and 76·1, 75·8 and 75·5 % for girls aged 5, 6 and 7 years respectively.
Statistics
Agreement between reference and measured values of FFM hydration was assessed by paired t test. Limits of agreement in individuals were calculated as twice the stan-dard deviation of the mean difference (Bland & Altman, 1986). The initial approach assumed the measurements of WT and TBW to be reliable, such that any difference between measured and predicted values for FFM hydration could be attributed to inaccuracy in measurement of BV by ADP. A more complex approach was then applied, whereby the contribution of methodological error from all techniques to agreement in hydration was investigated. To determine the extent to which measurement error accounted for lack of agreement between measured and predicted values, error was propagated for FFM hydration as described previously (Wellset al.1999). Error was pro-pagated by the delta method, using Fieller’s theorem to take into account covariance in ratios (Kendall & Stewart, 1977). This method calculates the maximum possible error as the differential of a function (Oehlert, 1992), using data on repeatability to represent measurement error. For our purposes, methodological error was calculated as precision as described by Bland & Altman (1986).
Error was also propagated for estimating the density and hydration of FFM, and FM and FFM in the 3C model. For FFM hydration, biological variation (Vb), methodological
variation (Vm), residual variation (Vr) and total observed
variation (Vt) were distinguished using the following
equation, an extension of that used previously (Wells
et al.1999):
V2t ¼V2mþV2bþV2r;
where Vtis the observedSDof a given measurement, Vmis
theSDof the propagated methodological error in the same
units, Vb is the SD of biological variability in hydration
reported in our previous study of children aged 8 – 12 years (Wells et al. 1999), and Vr is the remaining
proportion of Vt not accounted for by Vb and Vm. All
these terms are expressed in the same units, and the three components of Vtare assumed to be uncorrelated. All
stat-istics were carried out using the Minitab software release 6.2 (Minitab Inc., 1990; State College, PA, USA).
Results
All subjects successfully completed the protocol. The sample comprised twelve children (four males, eight
females) aged 5 years, nine (five males, four females) aged 6 years, and seven (three males, four females) aged 7 years.
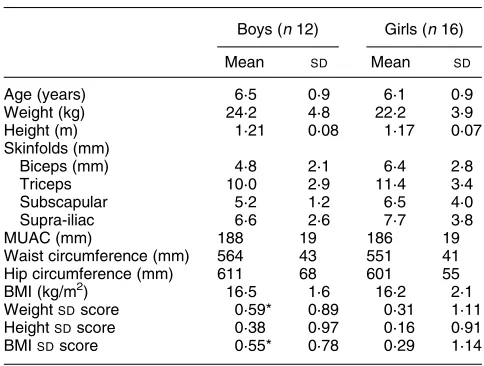
Age and anthropometric characteristics of the children are given for each gender in Table 1. On average, the girls were younger, lighter and shorter, and had larger skin-folds than the boys, but none of these differences achieved statistical significance. On average, both genders had posi-tiveSD scores for WT, HT and BMI relative to UK 1990 reference data (Coleet al.1995; Freemanet al.1995), sig-nificantly so in the boys for WT and BMI.
Raw body-composition measurements are given in Table 2. The boys had greater BV, BD and TBW, consist-ent with their greater lean mass, but only the difference in TBW was significant. Incorporation of these raw data into the 3C model (Table 3) indicated that the boys had signifi-cantly greater mean FFM and lower percentage fat than the girls.
Use of the equations of Crapo et al.(1982), integral to the ADP software, gave mean values for FRC of 0·79 (SD 0·43) litres, whereas the child-specific equations gave significantly higher values of 1·17 (SD0·13) litres, a
differ-ence of 0·38 (SD0·37) litres (P,0·0001). The mean differ-ence between adult and children’s TV was 0·61 (SD 0·24)
litres. To some extent, these differences cancel each other out, such that the mean difference in TGV calculated
Table 2.Raw body-composition data (Mean values and standard deviations)
Boys (n12) Girls (n16)
Mean SD Mean SD
Body volume (l) 23·1 4·7 21·3 3·9
Body density (kg/l) 1·049 0·011 1·042 0·014
Total body water (l) 15·4* 2·7 13·3 2·0
* Mean value was significantly different from that for girls (P,0·05).
Table 1. Age and anthropometry of the twenty-four children aged 5 – 7 years
(Mean values and standard deviations)
Boys (n12) Girls (n16)
Mean SD Mean SD
Age (years) 6·5 0·9 6·1 0·9
Weight (kg) 24·2 4·8 22·2 3·9
Height (m) 1·21 0·08 1·17 0·07
Skinfolds (mm)
Biceps (mm) 4·8 2·1 6·4 2·8
Triceps 10·0 2·9 11·4 3·4
Subscapular 5·2 1·2 6·5 4·0
Supra-iliac 6·6 2·6 7·7 3·8
MUAC (mm) 188 19 186 19
Waist circumference (mm) 564 43 551 41
Hip circumference (mm) 611 68 601 55
BMI (kg/m2) 16·5 1·6 16·2 2·1
WeightSDscore 0·59* 0·89 0·31 1·11
HeightSDscore 0·38 0·97 0·16 0·91
BMISDscore 0·55* 0·78 0·29 1·14
MUAC, mid-upper arm circumference.
using children’sv. adult’s equations was only 0·07 (SD0·27)
(range20·54 to 0·43) litres. The effect of this TGV differ-ence on values for BV was a differdiffer-ence of 0·02 (SD 1·1)
litres. Use of the equations of Dubois & Dubois (1916) and Haycock et al. (1978) produced almost identical values for SAA of 0·40 (SD 0·05) litres, with the differences likewise trivial in all individuals. However, in all subsequent analyses BV was calculated using the child-specific equations for both TGV and SA. Further calculations indicated that choice of SA equation would affect final body-composition values in very thin or fat children. The difference between the two equations approached 4 % for children with^3 BMI SD scores, and many patients have more extreme nutritional status than this range.
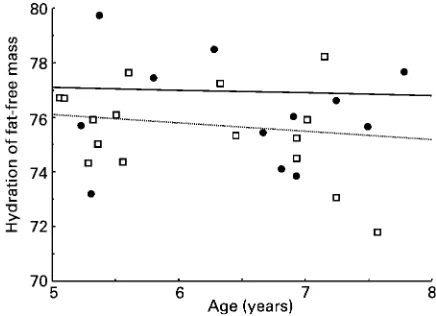
Mean hydration calculated by the 3C model was 75·8 (SD 1·8) %, in comparison with the average reference value of 76·4 (SD 0·6) %, equivalent to a mean bias of 0·6 (SD1·7) % (P,0·10). The mean difference in hydration
was equivalent to an error of20·04 (SD0·20, range20·38 to 0·36) litres in BV (P,0·30), equivalent to 0·2 (SD 0·9,
range 22·0 to 1·6) % of BV (P,0·26). This corresponds to a bias in percentage fat (calculated using the 3C model) of 20·4 (SD 1·9, range 24·1 to 3·3) (P,0·025). A comparison between measured and reference hydration is shown in Fig. 2. The individual data points are scattered
relatively evenly around the reference lines, with no dis-cernible correlation with age in either gender.
Precision values were 0·21 litres for TBW, 0·06 litres for BV, and 0·01 kg for WT. Propagation of error for hydration indicated the value of Vmto be 0·85 %. Taking a value for
Vbof 1·6 % (Wellset al. 1999), the residual proportion of
the limits of agreement Vrwas equivalent to zero. Thus the
lack of agreement between measured and predicted hydration could be attributed entirely to biological variabil-ity in hydration and methodological precision. Inaccuracy of the measurement techniques did not appear to contribute to the disagreement.
There was no significant correlation between BV error (calculated as the difference between the measured value and the value required to produce the reference hydration value) and either BV (r20·21; NS) or percentage fat (r20·02; NS), suggesting that there was no clear effect of size or fatness on volume accuracy within this range of BV (15·8234·8 litres).
The density of FFM was calculated to be 1·0847 (SD 0·0073) kg/l, with no significant difference between gender (boys 1·0832 (SD 0·0079) kg/l; girls 1·0858
(SD 0·0069) kg/l). For both genders these values were higher than those given in the reference child (boys 1·078 – 1·081; girls 1·073), with the difference significant in girls (D¼0·0128 (SD 0·0 69) kg/l; P,0·0001) but not
in boys (D¼0·0036 (SD 0·0079) kg/l;P¼0·14).
Propagation of error gave precision values for the 3C model as follows: FM and FFM, 0·20 kg; density of FFM, 0·0025 kg/l. This latter value represents a minority of the total variability of 0·0072 kg/l, indicating that the biological variability of this trait is 0·0067 kg/l.
Discussion
The increasing interest in children’s body composition requires that measurement techniques suitable for younger age groups be developed. ADP represents a technique con-siderably less demanding than UWW, and its precision has been shown to be acceptable in children aged 4 years and over (Wells & Fuller, 2001). The present study further explored its accuracy and application in a multi-component body-composition model in younger children.
ADP measures BV, and ideally its accuracy should be evaluated by reference to an alternative technique measur-ing the same property. The only such technique currently available is UWW. However, comparison of ADP with UWW in younger subjects is compounded by the practical complexity of UWW measurement. Young children find it difficult to exhale fully under water, so investigators tend to measure residual lung volume before or after the under-water procedure (Nun˜ezet al. 1999; Lockneret al. 2000; Demerath et al. 2002). However, the assumption that residual lung volume measured in this way is representa-tive of lung volume during underwater WT measurement may not be valid, due to differences in posture, or failure of subjects to exhale to the same degree while underwater. Ideally, lung volume should be measured at the same time as underwater WT, as has been practised in a previous study of older children (Dewitet al.2000). In the present study, focusing on children aged 5 – 7 years for whom the
Table 3. Body composition calculated by the three-component model
(Mean values and standard deviations)
Boys (n12) Girls (n16)
Mean SD Mean SD
FFM (kg) 20·2* 3·5 17·6 2·6
Fat mass (kg) 4·0 1·8 4·6 2·0
Percentage fat 16·0* 4·6 20·3 5·4
Fat mass hydration (%) 76·2 1·9 75·5 1·7 FFM density (kg/l) 1·083 0·008 1·086 0·007 FFM, fat-free mass.
* Mean value was significantly different from that for girls (P,0·05).
entire UWW procedure is daunting, an alternative approach to ADP evaluation was adopted, by using FFM hydration as the reference. As part of this general approach, it was also considered whether adult-based equations for the prediction of SA and lung volume in ADP calculation are appropriate for younger children.
Measurement of BV by ADP requires correction for the effect of skin temperature on air pressure, taking into account skin SA calculated from anthropometric data. The manufacturer’s software incorporates the SA equations of Dubois & Dubois (1916). These equations, derived almost a century ago from a small number of mainly adult subjects, may not be appropriate for contemporary children. However, it was found that substitution of these equations with those of Haycocket al.(1978) made a tri-vial difference to final BV values, both in the group as a whole and in any given individual. Nevertheless, although the choice of SA equation appears to have no effect on the body-composition values obtained for subjects of BV$15 litres, it is suggested that children’s equations should still be preferred as they may have greater accuracy in particu-larly thin or fat children.
In contrast, it was found that the utilisation of adult TGV prediction equations is inappropriate for younger children, even though on average the error is modest. The equations of Crapo et al.(1982), derived in adults and incorporated into the ADP software, significantly underestimate FRC in children in comparison to the values obtained from child-specific equations. The assumption of non-variable TV as in adults likewise generates overestimations. On average, these errors are in opposite directions and cancel out, such that the mean error of TGV prediction was only 0·06 litres, equivalent to 0·02 litres of BV. Underlying this low average error however are significant biases in individual children, with the limits of agreement for BV estimation being ^2·2 litres. Such errors would produce
highly erroneous final values for body composition, and the use of children’s lung volume equations in BV calcu-lation is therefore of great importance.
Our assessment of ADP accuracy was therefore based on child-specific equations for both SA and lung volume. Using the resulting BV values in the 3C equation, compari-son of empirical and theoretical values for FFM hydration indicated a small mean bias of 0·6 %, equivalent to,0·5 % fat. Our study therefore indicates that ADP is relatively accurate in groups of children aged 5 – 7 years. Agreement in individuals was poorer, with the 95 % limits of agree-ment being ^4·2 % fat. However, these limits of
agree-ment assume that all of the bias between measured and reference values can be attributed to inaccuracy in ADP, and that the other measurements utilised in calculation of FFM hydration are accurate and precise. In practice, these other measurements, along with biological variability in hydration, contribute to the limits of agreement, and therefore the proportion of the limits of agreement of between-technique bias that can be attributed to other sources has been considered. Our calculations indicate that more than half of the limits of agreement can be attrib-uted to biological variability in hydration. After taking this variability into account, it can be estimated that the range of error in individuals is ^2 % fat. Furthermore, this
remaining variability can be attributed to methodological imprecision, of which ADP is the principal source. Thus no evidence was found that inaccuracy of ADP contributes to between-technique bias over and above its error from imprecision.
This finding is in general agreement with previous studies of ADP in children. Dewit et al. (2000) reported no difference in mean BV measured by ADPv. hydroden-sitometry in children aged 8 – 12 years. In most subjects agreement between methods was very close; however, in four subjects agreement was considerably poorer, which may be due to occasional rogue values arising from incon-sistencies in subject behaviour or testing environment (Wells & Fuller, 2001). Fields & Goran (2000) also found ADP to measure fatness without significant bias compared with the four-component model in children aged 9 – 14 years, although they found a significant differ-ence between ADP and UWW equivalent to 2·6 % fat (Fields et al. 2002). Lockner et al. (2000) found a slight overestimation of BD by ADP compared with UWW and DXA in children aged 10 – 18 years, equivalent to a mean bias in fatness of 2·9 %. Similarly, Nun˜ez et al.(1999) in a study of children aged 6 – 19 years observed a significant bias of small magnitude in density against the reference UWW technique, indicating that ADP overestimated fat-ness in fatter individuals. Demerath et al. (2002) found no significant mean difference between UWW and ADP in children aged 8 – 17 years, but noted a trend for ADP to underestimate fat in fatter subjects and overestimate it in leaner subjects. No such trend between error and fatness or size was found in the present study.
These studies all demonstrate the potential of ADP in younger age groups, and with regard to healthy children imply that biases, where found, tend to remain small and of low clinical significance. Further, the comparisons described earlier (p. 705) do not reveal which of the methods accounts for any error. The precision of UWW is generally reported to be poorer than that of ADP (Dewit et al. 2000; Fields et al. 2002), and its use as a reference technique may therefore magnify apparent dis-agreement due to random error, as well as potentially con-tributing systematic error from measurement of lung volume. However, associations reported elsewhere between subject fatness and between-technique agreement are of concern, and continued evaluation of ADP is rec-ommended if the technique is to fulfil its potential in pae-diatric research. Furthermore, precision may be poorer in some patient groups who may find it more difficult to comply with the protocol. Children with cystic fibrosis, for example, may not be able to breathe so consistently during the measurement periods.
correlation between body size and calculated ADP error was observed, although such a relationship might have been confounded by variation in subject movement, another possible source of error. It is also not known whether the adjustments for TGV and SAA require con-stants of the same magnitude in young children, whose body proportions differ from those of adults (Stratz, 1909).
Composition of fat-free mass
Whereas the four-component model measures the three principal components of FFM (fat, mineral and protein), the 3C model assumes a constant mineral:protein ratio. The established 3C equation was based primarily on data from adults (Brozeket al.1963), and in the present study this constant ratio has been assumed to be applicable to younger children despite the chemical immaturity of their FFM. Our group is currently investigating this issue elsewhere.
Only one previous study has applied multi-component models to children in the same age range. Using the 3C model in twenty-eight children aged 5 – 10 years, with BV measured by hydrodensitometry, the reported values for the hydration of FFM were 75·5 (SD 1·8) % and 74·9
(SD 1·4) % in boys and girls respectively (Hewitt et al.
1993), slightly lower than reference values of 75·9 – 77·6 % (Fomon et al. 1982) but consistent with our values obtained in the present study (76·2 (SD 1·9) % in
boys; 75·5 (SD1·7) % in girls).
Our study provides new data on the density of FFM in children aged 5 – 7 years, with values significantly higher (1·085 (SD 0·007) by the 3C model) than those proposed by Fomon et al. (1982) in the reference child (1·080 – 1·082 in boys, and 1·073 in girls), although when the genders were analysed separately, only the girls’ results achieved significance. This increased FFM density, in the absence of changes in water content, implies a greater pro-portion of mineral in the FFM than that assumed by Fomon
et al.(1982), particularly in girls. Most values in the refer-ence child were predicted from measurements made only at birth, 6 months and 9 years (boys) or 10 years (girls). The authors admitted that the greatest uncertainty in their mod-elling arose from the lack of data on total body Ca at most ages. Thus the differences reported in the present study appear to be real, and imply that some of the assumptions used in calculation of the reference child are inappropriate. Differences in FFM density have important implications for the way in which BD, obtained by ADP, is converted into body composition using two-component models and Archimedes’ principle. Until this problem is resolved, ADP will not be able to provide accurate values for chil-dren’s body composition when used in a two-component model. Using predicted values for FFM density (Lohman, 1989), a significant mean bias in percentage fat is obtained compared with the measured value using the 3C model (D¼2·3 (SD 2·9);P,0·0005).
Conclusion
ADP represents a viable method for BV measurement in younger children, being acceptable to subjects aged
5 years and over, and having good precision compared with UWW. Our study indicates that accuracy of the method is acceptable for groups (mean bias ,0·5 % fat), and is sufficient for clinical purposes in individuals too (limits of agreement approximately ^2 % fat). However,
optimisation of accuracy and precision in younger children may require further adjustment, possibly both of the cor-rection factors used to adjust for lung volume and SA, and of the hardware in order to take into account smaller body size. Further evaluations are therefore recommended. Likewise, empirical data on the density of FFM throughout childhood are required before ADP can be used indepen-dently as a two-component technique. Child-specific equations for the prediction of TGV should be used, and although the use of adult equations for SA calculation was not found to generate bias in this population, it is suggested that children’s equations should be used in this context too, to minimise error in very thin or fat subjects.
References
Bland JM & Altman DG (1986) Statistical methods for assessing agreement between two methods of clinical measurement.
Lanceti, 307 – 310.
Boileau RA, Lohman TG, Slaughter MH, Ball TE, Going SB & Hendrix MK (1984) Hydration of the fat-free body in children during maturation.Hum Biol56, 651 – 666.
Bray GA, DeLany JP, Harsha DW, Volaufova J & Champagne CM (2001) Body composition of African American and white children: a 2-year follow-up of the BAROC study.
Obes Res9, 605 – 621.
Brozek J, Grande F, Anderson JT & Keys A (1963) A densitometric analysis of body composition: revision of some quantitative assumptions.Ann N Y Acad Sci110, 113 – 140. Butte NF, Wong WW, Hopkinson JM, Smith EO & Ellis KJ (2000) Body composition during the first 2 years of life: an updated reference.Pediatr Res47, 578 – 585.
Cole TJ, Freeman JV & Preece MA (1995) Body mass index reference curves for the UK, 1990.Arch Dis Child73, 25 – 29. Collins MA, Millard-Stafford ML & Sparling PB, et al. (1999) Evaluation of the BOD POD for assessing body fat in collegiate football players. Med Sci Sports Exerc 31, 1350 – 1356.
Crapo RO, Morris AH, Clayton PD & Nixon CR (1982) Lung volumes in healthy non-smoking adults.Bull Eur Physiopathol Respir18, 419 – 425.
Demerath EW, Guo SS, Chumlea WC, Towne B, Roche AF & Siervogel RM (2002) Comparison of percent body fat estimates using air displacement plethysmography and hydrodensitome-try in adults and children.Int J Obes Relat Metab Disord26, 389 – 397.
Dempster P & Aitkens S (1995) A new air displacement method for the determination of human body composition. Med Sci Sports Exerc27, 1692 – 1697.
Dewit O, Fuller NJ, Fewtrell MS, Elia M & Wells JCK (2000) Whole body air displacement plethysmography compared with hydrodensitometry for body composition analysis. Arch Dis Child82, 159 – 164.
Dubois D & Dubois EF (1916) A formula to estimate the approximate surface area if weight and height be known.
Arch Intern Med17, 863 – 871.
Fields DA, Goran MI & McCrory MA (2002) Body-composition assessment via air-displacement plethysmography in adults and children: a review.Am J Clin Nutr75, 453 – 467.
Fomon SJ, Haschke F, Ziegler EE & Nelson SE (1982) Body composition of reference children from birth to age 10 years.
Am J Clin Nutr35, 1169 – 1175.
Freeman JV, Cole TJ, Chinn S, Jones PRM, White EM & Preece MA (1995) Cross sectional stature and weight reference curves for the UK, 1990.Arch Dis Child73, 17 – 24.
Fuller NJ, Jebb SA, Laskey MA, Coward WA & Elia M (1992) Four-component model for the assessment of body composition in humans: comparison with alternative methods, and evaluation of the density and hydration of fat-free mass.Clin Sci82, 687 – 693.
Gnaedinger RH, Reineke EP, Pearson AM, Van Huss WD, Wessel JA & Montoye HJ (1963) Determination of body density by air displacement, helium dilution, and underwater weighing.Ann N Y Acad Sci110, 96 – 108.
Haycock GB, Schwartz GJ & Wisotsky DH (1978) Geometric method for measuring body surface area: a height-weight formula validated in infants, children, and adults. J Pediatr
93, 62 – 66.
Hewitt MJ, Going SB, Williams DP & Lohman TG (1993) Hydration of the fat-free body mass in children and adults: implications for body composition assessment. Am J Physiol
265, E88 – E95.
Hoffman DJ, Sawaya AL & Coward WA, et al.(2000) Energy expenditure of stunted and non-stunted boys and girls living in the shantytowns of Sao Paulo, Brazil. Am J Clin Nutr 72, 1025 – 1031.
Kendall M & Stewart A (1977) The Advanced Theory of Statistics, 4th ed., pp. 246 – 247, London: Griffin & Co Ltd. Lockner DW, Heyward VH, Baumgartner RN & Jenkins KA
(2000) Comparison of air-displacement plethysmography, hydrodensitometry, and dual X-ray absorptiometry for assessing body composition of children 10 to 18 years of age.Ann N Y Acad Sci904, 72 – 78.
Lohman TG (1989) Assessment of body composition in children.
Pediatr Exerc Sci1, 19 – 30.
McCrory MA, Gomez TD, Bernauer EM & Mole´ PA (1995) Evaluation of a new air displacement plethysmograph for measuring human body composition. Med Sci Sports Exerc
27, 1686 – 1691.
Nun˜ez C, Kovera AJ & Pietrobelli A, et al. (1999) Body composition in children and adults by air displacement plethysmography.Eur J Clin Nutr53, 382 – 387.
Oehlert GWA (1992) A note on the delta method. Am Stat46, 27 – 29.
Racette SB, Schoeller DA, Luke AH, Shay K, Hnilicka J & Kushner RF (1994) Relative dilution spaces of 2H- and 18O-labeled water in humans.Am J Physiol267, E585 – E590. Reilly JJ, Wilson J & Durnin JVGA (1995) Determination of body composition from skinfold thickness: a validation study.
Arch Dis Child73, 305 – 310.
Roemmich JN, Clark PA, Weltman A & Rogol AD (1997) Alterations in growth and body composition during puberty. I. Comparing multicompartmental body composition models.
J Appl Physiol83, 927 – 935.
Rosenthal M, Cramer D, Bain SH, Denison D, Bush A & Warner JO (1993) Lung function in white children aged 4 to 19 years: II – single breath analysis and plethysmography. Thorax48, 803 – 808.
Schoeller DA (1996) Hydrometry. InHuman Body Composition, pp. 25 – 43 [AF Roche, SB Heymsfield and TG Lohman, editors]. Champaign, IL: Human Kinetics.
Stratz CH (1909) Wachstum und Proportionen des Menschen vor und nach der Begurt (Growth and proportions of humans before and after birth).Arch Anthropol8, 287 – 297.
Tothill P, Avenell A & Reid DM (1994) Precision and accuracy of measurements of whole-body bone mineral: comparisons between Hologic, Lunar and Norland dual-energy X-ray absorptiometers.Br J Radiol67, 1210 – 1217.
Wagner DR, Heyward VH & Gibson AL (2000) Validation of air displacement plethysmography for assessing body composition.
Med Sci Sports Exerc32, 1339 – 1344.
Wang Z, Deurenberg P, Wang W, Pietrobelli A, Baumgartner RN & Heymsfield SB (1999) Hydration of fat-free body mass: new physiological modeling approach. Am J Physiol 276, E995 – E1003.
Wells JCK, Douros I, Fuller NJ, Elia M & Dekker L (2000) Assessment of body volume using three-dimensional photonic scanning.Ann N Y Acad Sci904, 247 – 254.
Wells JCK & Fuller NJ (2001) Precision of measurement and body size in whole-body air-displacement plethysmography.
Int J Obes Relat Metab Disord25, 1161 – 1167.
Wells JCK, Fuller NJ, Dewit O, Fewtrell MS, Elia M & Cole TJ (1999) Four-component model of body composition in children: density and hydration of fat-free mass and compari-son with simpler models.Am J Clin Nutr69, 904 – 912. Zapletal A, Paul T & Samanek M (1976) Normal values of static
pulmonary volumes and ventilation in children and adolescents.