DESIGNING A LOW PASS FIR FILTER BY USING RECTANGULAR
AND TALOR WINDOW
1Pramod Yadav, 2Shankarlal Sahu, 3Vijendra Prajapati, 4Pranay Kumar Rahi 1,2,3BE Scholar, 4Assistant Professor
1,2,3,4Department of Electrical and Electronics Engineering 1,2,3,4Institute of Technology, Korba
Chhattisgarh India
1[email protected], 2[email protected],
ABSTRACT
In this paper a low pass FIR filter has been presented using windowing method based on Rectangular andTtaylor window techniques of order 10. In this paper, we represent the significance of filter in our daily life. The analysis of magnitude and phase response of proposed FIR low pass filter are performed using MATLAB Simulation. The result window technique provides better result in term of magnitude and phase response of low pass FIR filter.
Keywords – DSP, FIR, low pass filter, rectangular and taylor window, MATLAB.
1. INTRODUCTION
Digital signal processing is the technique employed for the mathematical manipulation of an information signal so as to modify or improve it. For this purpose filters are mainly used. The filter is used to describe a linear time-invarient system used to perform spectral shaping or frequency selective filtering. Filter is used in digital signal processing is widely used a number of ways, such as equalization of communication channels, signal detection in radar, sonar and communications, and for performing analysis of the spectra of a variety of signal [1].
Digital signal processing (DSP) is an important field of study that has come about due to advances in communication theory, digital computer technology, and consumer devices. There is always a driving need to make thing better and dSP provides many techniques for doing this [2].
A signal carries information and the objective of signal processing is to extract useful information
carried by the signal. the method of information extraction depends on the type of signal and the nature of the information being carried by the signal [3].
Application of digital signal processing
1. Telecommunication – Echo cancellation in telephone networks, adaptive equalization, telephone dialing application, modems and cellular phone.
2. Military – radar signal processing, sonar signal processing, navigation, secure missile guidance. 3. Image processing – image representation, image
compression, image enhancement, satellite weather map and animation, robotic vision, image analysis recogination.
4. Speech processing – speech analysis methods are used in automatic speech recognition, speaker verification and speaker identification. Speech synthesis techniques includes conversion of written text into speech, digital audio and equalization.
5. Signal filtering – removal of unwanted background noise, removal of interface, separation of frequency bands and shaping of the signal spectrum. [4]
2. WINDOW TEECHNIQUE
The FIR filter design process using window function can be enumerated as:
i. Define filter specification.
ii. Specify a window function according to the filter specification.
iii. Compute the filter order required for a given set of specification.
v. Compute the coefficients the ideal filter according to the filter order.
vi. Compute FIR filter coefficients in accordance the obtained window function and the coefficients of the ideal filter.
vii. If the resulting filter has a very wide or a very narrow transition region, it is mandatory to change the filter order by decreasing it according to needs, and after this process the steps 4, 5 and 6 are interated as many times as needs. [5] The window used in this paper to design the FIR filter are:
1.
Rectangular window.2.
Taylor window.3.
WINDOWS AND THEIR EQUATIONS.
Several window functions have been proposed. Listed below are some of the most common:
Rectangular window
Hanning window
Hamming window
Blackman window
Kaiser window
To reduce the oscillation in Fourrier series method, the fourier coefficient are modified by multiplying the infinite impulse response by a finite weighing sequence 𝜔(𝑛) called a window. Windows are characterize by the main lobe width which is the bandwidth between first negative and first positive zero crossing, and by their ripple ratio. The main lobe far as possible in the main lobe and the energy in the side lobe should be as low as possible.
Two desirable characteristic of a window function are:
1) Fourier transform of the window function should have a small width of the main lobe. 2) Fourier transform of the winmdow function
should have side lobe that decrease in energy rapidly as/ tends to zero.
Window can be categorized as fixed or adjustable window function. Fixed window such as rectangular, hanning, hamming, and blackman window have only one independent parameter window length which control the main-lobe width. Adjustable window have two or more independent parameters such as window length and one more additional parameters that can control the other window’s characteristics [6,7]. The Kaiser window is a kind of two parameter window
function. In a Kaiser window width of main lobe can be controlled by adjusting the length of the filter and side lobe level can be controlled by varying the other parameter. But the Kaiser window has the disadvantage of higher computational complexity due to the use of vessel function in the calculation of the window coefficient.
However the amplitude of side lobe and ripples in pass band is also increased. The function is
𝜔(𝑛) = {𝛼 − (1 − 𝛼) cos ( 2𝜋𝑛
𝑀 − 1) , 0 ≤ 𝑛 ≤ 𝑀 − 1)
Otherwise the value of 𝜔(𝑛) is zero.
3.1. RECTANGULAR WINDOW
The rectangular window is what you would obtain if you were to simply segment a finite portion of the impulse response without any shaping in the time domain:
𝜔[𝑛] = {1, 0 ≤ 𝑛 ≤ 𝑀 0, 𝑜𝑡ℎ𝑒𝑟𝑤𝑖𝑠𝑒
We have studied this function extensively in class, and know it’s DTFT to be
𝜔(𝑒𝑗𝜔) =sin (
𝑀𝜔 2 ) sin (𝜔2) 𝑒
−𝑗𝜔𝑀 2⁄
Compare the plots of the original sinc function above (without the phase term) and its magnitude plotted in dB,
20log10(|𝜔(𝑒𝑗𝜔)|).[8]
3.2 TAYLOR WINDOW
Taylor function are obtained from a weighted – cosine series added to a constant, or a pedestal. A similar form of these function can be obtained by dropping from of some of the higher – order terms. If all, except the first term, are dropped, a taylor function is obtained which can be expressed as
𝑓(𝑡) = {
(1+𝐾)
2 + (
1−𝐾 2 ) 𝑐𝑜𝑠
𝜋𝑡
𝜏 , |𝑡| ≤ 𝜏
0, 𝑒𝑙𝑠𝑒𝑤ℎ𝑒𝑟𝑒
Where Fourier transform is
𝐹(𝜔) = (1 + 𝐾)𝑠𝑖𝑛𝜔𝜏
𝜔 +
(1−𝐾)
2 [
sin(𝜔+𝜋𝜏)𝜏
(𝜔+𝜋 𝜏)
+sin (𝜔−
𝜋 𝜏) (𝜔−𝜋
4. SIMULATION AND RESULT
PARAMETER VALUES
Sampling frequency(Fs) 48000
Cut-off frequency(Fc) 10800
Order(N) 10
Table 1: Parameter specification.
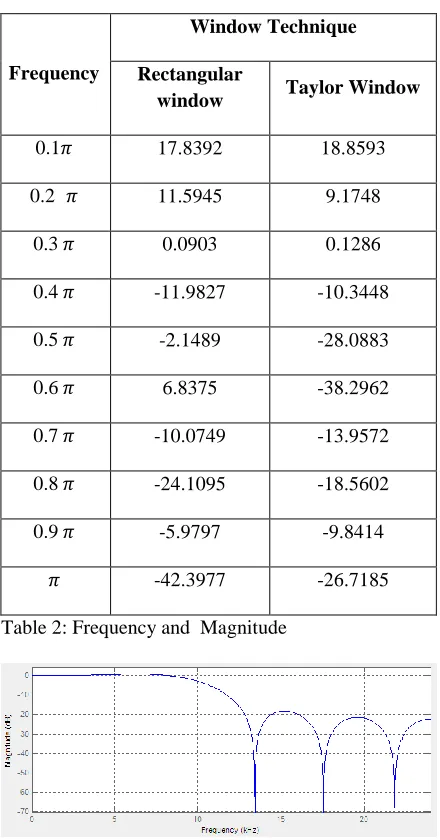
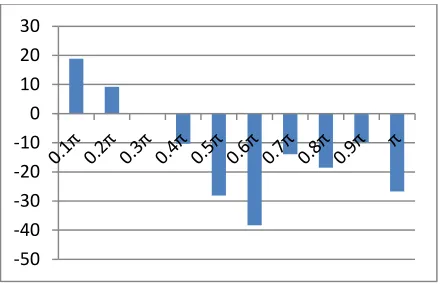
Table 2: Frequency and Magnitude
Figure 1: Magnitude Response of Rectangular Window Technique.
Figure 2: Phase Response of Rectangular Window Technique.
Figure 3: Filter Coefficient of Rectangular Window Technique.
Figure 4: Filter Information of Rectangular Window Technique.
Figure 5: Magnitude Response of Taylor Window Technique
Frequency
Window Technique
Rectangular
window Taylor Window
0.1𝜋 17.8392 18.8593
0.2 𝜋 11.5945 9.1748
0.3 𝜋 0.0903 0.1286
0.4 𝜋 -11.9827 -10.3448
0.5 𝜋 -2.1489 -28.0883
0.6 𝜋 6.8375 -38.2962
0.7 𝜋 -10.0749 -13.9572
0.8 𝜋 -24.1095 -18.5602
0.9 𝜋 -5.9797 -9.8414
Figure 6: Phase Response of Taylor Window Technique.
Figure 7: Filter Coefficient of Taylor Window Technique.
Figure 8: Filter Information of Taylor Window Technique.
Figure 9: Magnitude and Frequency Plot of Rectangular Window.
Figure 10: Magnitude and Frequency Plot of Taylor Window Technique.
CONCLUSSION
This paper briefly describes the two techniques use to design FIR filter. The availability of well defined equation for calculating window coefficient hence made this method preferable. But if offers vary little design flexibility. Rectangular windows offer very low order to need given specification. If can be seen that the height if the side-lobes is the lowest using the rectangular window but highest using the taylor window.the width of the major lobe is highest in case of the rectangular window and almost equal in the case taylor window.the best digital filter design results comes for using the taylor window from the window design technique.
REFERENCES
[1] J.G. Proakis and D. G. Manolakis, Digital Signal Processing Principles, Algorithms and Applications 3rd Edition Prentice- Hall, 2002.
[2].Michael Weeks, “digital signal processing ” Using MATLAB and Wavelets, Infinity Science Press, pp.1 2007.
[3] Sanjit K. Mitra “digital signal processing” a computer- based approach second edition McGraw Hill, pp.1.
[4] S Salivahanan, C Gnanapriya, A Vallavaraj, “digital signal processing ” Tata McGraw-Hill, second edition pp.3,443-448.
[5] Sonika Gupta and Aman Panghal, “Performance Analysis of FIR Filter Design by Using Rectangular, Hanning and Hamming Windows methods”, International Journal of Advanced Research in Computer Science and Software Engineering, Volume 2, ISSN: 2277 128X, pp. 273-277. Issue 6, June 2012. -50
-40 -30 -20 -10 0 10 20 30
[6] T. Saramaki, Finite impulse response filter design in Handbook for Digital Signal Processing, Edited by S. K. Mitra and J. F. Kaiser, IBSN 0-471-61995-7 John Wiley &Sons Inc, 1993.
[7] Oppenheim, R. Schafer, and J. Buck, Discrete-Time Signal Processing second edition, Prentice-Hall,1999.
[8] Carnegie Mellon, “Notes on FIR Filter Design Using Window Function”, Siganls and System (18-396).
[9] INSTN Electronics & Telecom. ENGRS, VOL. 26, NO.1, 1980.
AUTHORS
Pramod yadav persuing bachelor of engineering in electrical and electronics engineering in 5th semester from institute of technology korba,Chhattisgarh Swami Vivekananda Technical University Chhattisgarh ,india.
Shankarlal sahu persuing bachelor of engineering in electrical and electronics engineering in 5th semester from institute of technology korba, Chhattisgarh swami Vivekananda technical university Chhattisgarh, india.
Vijendra prajapati persuing bachelor of engineering in electrical and electronics engineering in 5th semester from institute of technology korba, Chhattisgarh swami Vivekananda university, chhattisgrh,india.
Pranay Kumar Rahi received the bachelor of technology degree in Electronics and Telecommunication engineering collage, guru ghashidas university, bilaspur Chhattisgarh, india in 2004, and persuing master of engineering in electronics and communication engineering from national institute of technical teacher’s training & research, Punjab university,