JOURNAL OF
RANGE MANA
Published bimonthlwJanuary, March, May, July, September, November
Copyright 1980 by the Society for Range Management
Managlng Editor FLOYD E. KINSINGER
2780 West Fifth Avenue Denver, Colo. 80204 Technical Editor REX D. PIEPER
Dept. of Animal & Range Sciences New Mexico State University Las Cruces, NM. 88003 Book Revlew Editor RICHARD E. FRANCIS
Rocky Mtn. Forest (L Range Experiment Station 240 West Prospect Fort Collins, Colo. 80521 Productlon Editor PATRICIA G. SMITH
2780 West Fifth Avenue Denver, Colo. 80204 Edltorlal Board 1978-80
DONALD A. KLEBENOW, Reno, Nev. JAMES T. NICHOLS, North Platte, Neb. MICHAEL D. PITT, Vancouver, B.C. RONALD E. SOSEBEE, Lubbock, Tex. 1979-81
ROD BOVEY, College Station, Tex. NEIL FRISCHKNECHT, Provo, Utah MARTIN VAVRA, Union, Ore. HAROLD GRELEN, Pineville, La. 1980-82
HENRY MAYLAND, Kimberly, Ida. JOHN MENKE, Davis, Calif. STEPHEN SHARROW, Corvallis, Ore. PHILLIP URNESS, Logan, Utah
INDIVIDUAL SUBSCRIPTION is by membership in the Society for Range Management.
LIBRARY or other INSTITUTIONAL SUBSCRIP- TIONS on a calendar year basis are $58.00 for the United States postpaid and $88.00 for other coun- tries, postpaid. Payment from outside the United States should be remitted in US dollars by interna- tional money order or draft on a New York bank. BUSINESS CORRESPONDENCE, concerning sub- scriptions, advertising, reprints, back issues, and related matters, should be addressed to the Manag- ing Editor, 2760 West Fifth Avenue, Denver, Colo. 80204.
EDITORIAL CORRESPONDENCE, concerning manuscripts or other editorial matters, should be addressed to the Technical Editor, Dept. of Animal and Range Sciences, New Mexico State University, Las Cruces, N.M. 88003.
INSTRUCTIONS FOR AUTHORS appear on the inside back cover of each issue.
THE JOURNAL OF RANGE MANAGEMENT (ISSN 0022-409X) is published six times yearly for $56.00 per year by the Society for Range Management, 2760 West Fifth Avenue, Denver, Colo. 80204. SECOND CLASS POSTAGE paid at Denver, Colo. POSTMASTER: Return entire journal with address change-RETURN POSTAGE GUARANTEED-to Society for Range Management, 2760 West Fifth Avenue, Denver, Colo. 80204.
GEMENT
TABLE OF CONTENTS:
Vol. 33, No. 6, November 1980
ARTICLES 404
408
410
415
423 426
428
435
439
442
446
451
455 457
460
463
465
Effects of Atrazine, 2,4-D and Fertilizer on Crude Protein Content of Oklahoma Tallgrass Prairie by R.L. Baker, J. Powell, R.D. Morrison, and J.F. Stritzke Effect of Fertilizer and Brush Control on Soil Fertility by W.E. McMurphy, L.M.
Rommann, J.H. Stiegler, and J.F. Stritzke
Nutritive Content of Sheep, Goat, and White-tailed Deer Diets on Excellent Condition Rangeland in Texas by F.C. Bryant, M.M. Kothmann, and L.B. Merrill Historical Perspectives on Range Burning in the Inland Pacific Northwest by Dean A. Shinn
Infiltration Rates on Rootplowed Rangeland by John M. Tromble
An Aspect of Feeding Behavior and Its Importance to Grazing Systems by Ernest A. Gluesing and David F. Balph
Diet Selection by Cattle under High-Intensity Low-Frequency, Short Duration, and Merrill Grazing Systems by Charles A. Taylor, M.M. Kothmann, L.B. Merrill, and Doak Elledge
Factors Influencing Magnesium in High Plains Forage by Merle L. Fairbourn and Arthur R. Batchelder
Emergence of Bitterbrush Seedlings on Land Disturbed by Phosphate Mining by D. Terrance Booth
Nutritional Characteristics of High Yielding Exotic Grasses for Seeding Cleared South Texas Brushland by P.F. McCawley and B.E. Dahl
Plant Phenology in Galleta-Shadscale and Galleta-Sagebrush Associations by Richard L. Everett, Paul T. Tueller, J. Barry Davis and Allen D. Brunner Effects of Grazing and Sagebrush Control on Potential Erosion by C. W. Johnson, G.A. Schumaker, and J.P. Smith
Chemical Composition of the Sandlily (Leucocrinum montanum) by Frank Rauzi Response of Wavyleaf Oak to Nitrogen Fertilization by Volney W. Howard, Jr., Jerry R. Cox, and G. Morris Southward
Salt Tolerance of Two Saltbush Species Grown in Processed Oil Shale by Steven G. Richardson and C.M. McKell
Townsend Ground Squirrel Diets in the Shrub-Steppe of Southcentral Washing ton by L.E. Rogers and K.A. Gano
Control of Bitterweed with Herbicides by D.N. Ueckert, C.J. Scifres, S.G. Whisen- ant, and J.L. Mutz
BOOK REVIEWS
470 Ecology and Utilization of Desert Shrub Rangelands in Iraq. by D.C.P. Thalen; Wildl$e Habitats in Managed Forests: The Blue Mountains of Oregon and Washington technical editor, Jack Ward Thomas.
Effects of Atrazine, 2,4-D and Fertilizer on
Crude Protein Content of Oklahoma Tall-
grass Prairie
R.L. BAKER, J. POWELL, R.D. MORRISON, AND
J.F. STRITZKE
Abstract
Various combinations of atrazine, 2,4-D, and NPK fertilizer were applied initially in 1975 on a tallgrass prairie in good condi- tion and again as a retreatment in 1976 on one-half of each treated area. Application of atrazine with fertilizer increased crude protein content, crude protein yield, and range condition during the summer. Differences in protein levels in dormant forage were not evident. Therefore the application of atrazine and fertilizer appears to be more feasible for summer grazing or production of high quality prairie hay than for yearlong or winter grazing,
Forage dry matter content, nutrient composition, and palatability of range plants are important factors affecting livestock performance. Early growth of range plants is gen- erally more nutritious than material of older, more mature plants. However, grazing animals must often utilize more mature, less nutritious forage for maintenance and produc- tion in late summer, fall, and winter.
The protein content of many tallgrass prairie plants declines rapidly in summer (Powell et al. 1978) and often does not meet livestock maintenance requirements. Even when fertilized, the protein content and digestibility of tall- grass prairie forage often reach low levels by maturity (Rao et al. 1973).
Herbicides have been used to increase and maintain pro- tein in grasses (Sneva 1967, Kay and Tore11 1970). Nontoxic concentrations of atrazine [ 2-chloro-4-(ethylamino)-6- (isopropylamino)-s-triazine] increase nitrogen metabolism in many grasses (Kay 1971, Houston and van der Sluijs
1975), although the physiological processes are not fully understood (Dumford and Ebert 1976).
Livestock production could be increased or supplemental feed costs reduced by increasing the protein content of herbage throughout the growing season. Therefore, the objective of this study was to determine the effects of atra- zine, 2,4-D, and fertilizer on the protein content of tallgrass vegetation in northcentral Oklahoma.
Study Area
The study area is 2.25 ha of loamy upland rangeland, 11 km north of Stillwater, Oklahoma. Elevation is about 280 m. Stil- lwater has a continental climate with average maximum observed
Authors are graduate research assistant, associate professor of range science, professor of statistics, and associate professor of agronomy, Oklahoma Agricultural Experiment Station.
This report is a contribution of the Oklahoma Agricultural Experiment Station as Journal Article number 3512.
Appreciation is expressed for partial funding from CIBA-GEIGY Corporation and to Mr. Jim Williams for providing the study area. The senior author is currently range scientist, Southern Forest Experiment Station, U.S. Dep. Agr., Forest Service, New Orleans, Louisiana.
Manuscript received October 10, 1979.
Editor’s Note: The first two articles of this issue discuss Oklahoma rangeland and may be of special interest to those planning to attend the Annual Meeting of the Society for
Range Management in Tulsa, February 8-13, 1981.
temperatures exceeding 40” C from June through September, and average minimum observed temperatures below -20” C from December through March (Fig. 1). Annual precipitation averages 820 f 250 mm, and its distribution during the 210day growing season is 21% (April-May), 28% (June-August), and 17% (September-October). Wind occurs most frequently in March and April and pan evaporation is more than 250 mm/ mo in June, July, and August.
Topography is rolling with smooth areas confined to broad interstream divides (Gray and Galloway 1959). Slope of the land varies from 2 to 6% eastward. Soils are predominately fine-loamy, mixed, thermic, Udic Argiustoll. Range site is good condition loamy prairie that was moderately grazed by cows and calves or mowed for hay prior to the study. Major species in the study area include Schizachyrium scoparium, Sorghastrum nutans, Panicum virgatum, Andropogon gerardi, Aristida oligantha, Panicum oli- gosanthes (all varieties), Ambrosia psilostachya, and various members of the Cyperaceae referred to as Carex.(Waterfall 1972, includes unpublished updates by R.J. Tyrl, OSU herbarium curator).
Methods
A randomized block experimental design was used in 1975 with
40-
120 30
100 20 z
0
i 60 IO $
; 60 0:
a
40 -10
20 -20
ON I I D r”‘I J FMAMJJASO 1 1 -30 Winter Spring Summer Fall
Fig. 1. Longterm (81 years) average monthly precipitation (mm), absolute observed temperatures (C), wind (km Jday), and evaporation (mm Jmo) for study area.
three replications of eight treatments. Randomly selected 12 X 15-m plots were treated with foliar sprays of atrazine and 2,4-D [(2,4-dichlorophenoxy) acetic acid] on June 27, 1975, with a tractor-powered boom sprayer using 187 liters water/ha at 2.8 kg/cm2 pressure. Fertilizer (N-P-K) was broadcast June 7 at the rate of 67-45-45 kg/ ha. The eight treatments included (1) untreated, (2) 1.1 kg atrazine/ ha, (3) 3.4 kg atrazine/ ha, (4) 0.8 kg 2,4-D/ ha, (5) fertilizer, (6) 2,4-D i- atrazine, (7) 3.4 kg atrazine + fertilizer, and (8) 3.4 kg atrazine i- 2,4-D + fertilizer.
Standing herbage weight was estimated by species in July, August, and November 1975 using modified weight-estimate (Pechanec and Pickord 1937) and double sampling (Wilm et al.
1944). Species production on six, 0.5-m2 samples were estimated for each treatment in each replication. Two of the six samples were clipped at a 5-cm stubble height and dried at 60” C to a constant weight to determine the estimation correction factor and dry mat- ter content. Soil samples were collected at 0 - 30 cm and 30 - 60 cm depths at each clipped sample site to determine soil water content gravimetrically (National Academy of Science 1962).
All standing vegetation was mowed to a IO-cm height with a rotary lawnmower in March 1976 and left on plots as ground litter. A split plot design was superimposed on the randomized block design in 1976. One-half of each plot received the same treatment as in 1975, while the other half remained untreated to measure residual effects. In 1976, fertilizer was broadcast May 10 and herbicides were applied as in 1975 on June 4. Herbage yields were estimated in June, July, August, and November to coincide with similar phenological growth stages in 1975. Four estimates per treatment area were recorded with one estimated sample clipped. Other sampling procedures were unchanged from 1975.
Forage samples were mixed by hammermilling and then ground with a Wiley Mill to pass through a 2-mm screen. The 1975 nitrogen analyses were by the micro-Kjeldahl and nitrogen ana- lyzer procedures (OSU Soil and Water Testing Laboratory, Stil- lwater, Unpublished procedures) while 1976 analyses were by the macro-Kjeldahl procedure (AOAC 1970).
Data were analyzed using ANOVA procedure of the Statistical Analysis System (Barr and Goodnight 1972). Statistically signifi- cant differences among selected combinations of treatment means were determined using the least significant differences (LSD) from the analysis of variance. All differences discussed are based on LSD’s at the 90% level of probability unless otherwise indicated.
Results and Discussion
Weather
Drought conditions prevailed throughout most of the study period after a wet May 1975 (Fig. 2). An 8-week summer drought with very limited rainfall occurred in July and August 1975. Drought conditions continued into winter with no recharge of subsoil water. In 1976, only March and April precipitation was above average and no single rainfall event produced more than 25 mm precipitation. By the end of July 1976 available soil water was extremely low. Many of the plants were under plant water stress for the remainder of the growing season. In general, unfavorable growing condi- tions were due more to limited precipitation than to temper- ature or wind extremes.
First Year .Treatment Effects
In June 1975 prior to treatments, herbage protein content was 9.9% and protein yield was about 130 kg/ ha (Fig. 3). With above-average precipitation in May and June, plants were actively growing.
By July protein content decreased to 7.4% on untreated areas, but ranged from 8.5% to 11.5% on the treated areas. Protein levels on areas treated with either 1.1 or 3.4 kg of atrazine were about 1% higher than those in herbage on areas treated with 2,4-D. Protein levels were highest on areas treated with both atrazine and fertilizer, and about 1% higher on these areas than on areas where fertilizer alone or fertilizer and 2,4-D in combination were applied. Species composition varied sufficiently so that no one species or group of species was responsible for the differences in pro- tein content.
There was less difference in protein yield than in protein content due to treatments. The higher rate of atrazine tem- porarily reduced herbage yields and negated the effect of higher protein content on protein yield. Areas receiving only fertilizer had much higher protein yields than other treated areas and about twice the protein yield as on untreated areas.
In August protein content in untreated herbage was unchanged from that in July; however protein levels on treated areas decreased 1.5 to 3.0%. August protein levels
Treatma~ts
16 U - Ur,‘<ected
4 D- 2,4-D
” -:‘-‘ZcZ.CC ( I LfJ/liO)
I?, 500
14 A3-/‘,tw,ns (3kg/ha)
fi- :.l::w:n P- Phcspku
12 K-Potcss~um
i 400 l t
Fig. 2. Study period average monthly precipitation (mm), absolute
observed temperatures (C), wind @m/day), evaporation (mmlmo).
Fig. 3. First year treatment effects on protein content (%) andprotein yield
(kg/ha, oven-dry) of herbage in 1975. (Content LSD.10: July-1.8; August--1.8; November-0.8. Yield LSD.10: July-70; August-80; November-45.)
16 t
14 t t
I2 t
were highest on areas receiving both atrazine and fertilizer
and, as in July, lower than average on areas. treated with
2,4-D.
Protein yields remained higher on all fertilized areas than
on untreated areas or areas treated with only one herbicide.
In general protein yields were as high or higher in August
than in July because of the increased herbage yield. The
relative increases in herbage yield were large enough to
offset the decreases in protein content.
Protein content and herbage yield declined between late
summer and early winter. Differences in both protein con-
tent and protein yield were relatively small after frost.
Residual Effects
In June 1976 the protein content in untreated herbage was
about the same as that in untreated herbage in 1975; how-
ever, herbge and protein yields on treated areas were about
65% greater in 1976 than in 1975 (Fig. 4). Although May
1976 precipitation was only about 40% of average, 128 mm
of rain in April 1976 and rest from grazing in 1975 may have
caused the higher yields in June 1976. Tallgrasses and other
warm-season perennial grasses were most abundant on
treated areas, whereas early summer grasses and forbs were
most abundant on untreated areas.
The high proportion of tallgrasses on areas treated with
the higher rate of atrazine or with only fertilizer apparently
caused lower protein content in herbage on these areas.
Tallgrasses on these areas appeared to be in more advanced
stage of growth than similar grasses on untreated areas or in
areas treated with both atrazine and fertilizer in 1975.
But July and thereafter, there was little difference between
protein contents or yields in herbage from any area. Protein
contents decreased 2.5 to 4.0V0 between June and July on all
areas. From July through November 1976 protein contents
were relatively low on all areas and 1 to 2% lower than at
comparable times in 1975 due to poor growing conditions in
1976.
Retreatment Effects
Herbicides were not applied until after the June l-3,1976,
sampling whereas fertilizer was applied May 10, 1976.
Therefore, June values in Figure 5 represent residual effects
of herbicides and retreatment effects of fertilizer.
/ Content
L
YieldTfeotments IJ - Untreated D- 2,4-O
GI -Atrozme ( I kg/ho) 500 A3-Atrozlce (3kg/ho) N-Nitrogen P-Phosphorus
K-Potossium 400
Fig. 4. Residual effects of treatments on protein content (%) andprotein yield (kg/ha, oven-dry) of herbage in 1976. (Content LSD.10: June-1.4: July-0.7; August-1.2; November-1.1. Yield LSD.10: June-90; July-50; August-JO; November-40.)
406
r
ContcJune
:nt
Yield
July
Treatments U - Untreated
A3-Atrazine (3kg/ha)
P-Phosphorus
K - POtOSSUfI
Fig. 5. Retreatment effects onprotein content (%)andprotein yield (kg/ha, oven-dry) of herbage in 1976. (Content LSD.10: June-2.5; July-1.0; August-1.4; November-1.2. Yield LSD.10: June--160; July-60; August-loo; November-65.)
Protein contents and yields were much greater on all
retreated areas than on untreated areas in early June (Fig.
5). Herbage treated with only fertilizer contained 16.2%
protein while herbage treated with fertilizer plus residual
herbicide treatments codes as (DNPK, A3NPK, A3DNPK)
(Fig. 5) contained 13.0 to 13.7% protein. Herbage on areas
receiving only fertilizer was 38% forbs, twice the forb pro-
duction of any of the other three fertilizer treatments that
also included an herbicide. More than half the forb produc-
tion on fertilizer-only areas was from
Ambrosia psilosta- chya,a forb normally high in protein content throughout
the growing season (Joe Blaine, OSU Range Science senior
student, Unpublished data) but low in palatability.
Ambro- sia psilostachyawas reduced by herbicides in 1975 and was
absent from herbicide-treated areas in 1976.
Herbage protein was about 2% lower on all areas in July
1976 than on comparable areas in July 1975. Protein yields
on fertilized (NPK, DNPK, A3NPK, A3DNPK) areas how-
ever, were 1 i/2 to 2 times greater in 1976 than in 1975. Protein
contents and yields on herbicide-only areas (Al, A3, D)
were no greater than those on untreated areas and were
much lower than those on areas receiving fertilizer (NPK,
DNPK, A3NPK, A3DNPK).
Protein content was greatest in July and August on those
areas receiving both atrazine and fertilizer even though
herbage was predominately tallgrasses. The combination of
atrazine and fertilizer therefore improved range condition
(i.e., increased the proportion of tallgrasses) and maintained
a relatively high protein content. In November crude protein
content levels were relatively low on all areas and particu-
larly low on areas treated with herbicides and not fertilizer.
Conclusions
The application of atrazine with fertilizer increased crude
protein content of actively growing tallgrass prairie vegeta-
tion during two successive dry years. No residual effects on
plant protein levels the year following treatment were evi-
dent. Fertilizer or atrazine alone increased herbage protein
levels. The combination of atrazine plus fertilizer improved
range condition and palatability of herbage by decreasing
undesirable species, such as
Aristida oligantha
and
Ambro-
sia psilostachya,
and by increasing desirable perennial
grasses while protein levels remained consistently high.
Atrazine alone increased the percentage of tallgrasses in
herbage and this change apparently reduced dormant her-
bage protein levels. However, atrazine did appear to delay
maturity of some tallgrass species in late summer.
Further study is necessary to determine long-term effects
of repeated treatments of atrazine on tallgrass species. The
maximum period of increased protein content appears to be
short, but with proper use and management the opportunity
for utilizing high quality forage appears available. Our
results indicate the application of atrazine and fertilizer on
tallgrass prairie will be more useful for hay production and
summer cattle grazing than for yearlong or winter grazing.
Protein yield was greatly increased the second year. If this
increase can be maintained indefinitely with optimum rate
and date of application of atrazine and fertilizer, this prac-
tice may provide a significant management and production
alternative for ranchers.
Literature Cited
AOAC. 1970. Methods of analysis. 1 Ith ed. Ass. Official Agr. Chemists. Washington, D.C. 1015 p.
Barr, A.J., and J.H. Goodnight. 1972. A User’s Guide to the Statistical Analysis System. Sparks Press, Raleigh, N.C. 260 p.
Dumford, S.W., and E. Ebert. 1976. Plant constituents. p 21-35. In: F.A. Gunther and J.D Gunther, eds. Residue Reviews. Vol. 65, Effects of triazine herbicides on the physiology of plants. Springer-Verlag, N.Y.
103 p.
Gray, F., and H.M. Galloway. 1959. Soils of Oklahoma. Okla. Agr. Exp. Sta. Misc. Pub. MP-56. 65 p.
Houston, W.R., and D.H. van der Sluijs. 1975. S-triazine herbicides com- bined with nitrogen fertilizer for increasing protein on shortgrass range. J. Range Manage. 28: 372-376.
Kay, B.L. 1971. Atrazine and simazine increase yield and quality of range forage. Weed Sci. 19: 370-372.
Kay, B.L., and D.T. Torell. 1970. Curing standing range forage with herbicides. J. Range Manage. 23: 34-41.
National Academy of Sciences, Subcommittee on Range Research Methods. 1962. Basic problems and techniques in range research. Nat.
Res. Council. Washington, D.C. 341 p.
Pechanec, J.F., and G.D. Pickford. 1937. A weight estimate method for the determination of range or pasture production. J. Amer. Sot. Agron. 29: 894-904.
Powell, J., F.R. Crow, and D.G. Wagner. 1978. Plant biomass and nutrient cycling on a grazed, tallgrass prairie watershed. First Int. Rangeland Congress Proc. 1: 681-683.
Rao, M.R., L.H. Harbers, and E.F. Smith. 1973. Seasonal changes in nutritive value of bluestem pastures. J. Range Manage. 26: 419-422. Sneva, F.A. 1967. Chemical curing of range grasses with paraquat. J.
Range Manage. 20: 389-394.
Waterfall, U.T. 1972. Keys to the Flora of Oklahoma. Okla. State Univ. Bookstore. Okla. State Univ., Stillwater. 246 p.
Wilm, H.G., D.E. Costello, and G.E. Klipple. 1944. Estimating forage yield by the double-sampling method. J. Amer. Sot. Agron. 36: 194-203.
With aerial photographs and a Bausch &
It is compact, lightweight, simple to operate.
Lomb ZOOM TRANSFER SCOPETM instrument,
And much more.
you can map and plan land use studies quickly,
We’ll be happy to recommend the
economically, simply.
instrument that’s best for your needs. Call us at
The Z.TS.@ instrument optically mixes
(716) 338-6000. Or send coupon for illustrated
aerial photographs and data base
brochure.
r IIIIII----I.I--II----~
JRM 1180I
1,
Name I Orgamzahon IAddress
I
I
City/Prownce ZIPI
1
~~----I~~~~~III----~~
Telephonewithout projection,
without expensive
darkroom
equipment.
It compen-
sates for distortion.
BAUSCH 6 LOMB @
Scwttfic OptIcal Products Oivislon
ROCHESTER, NEW YORK 14602 USA 716-338-6000. TWX 510-253-6189 TELEX 978231. CABLE BAUSCH 8 LOMB
Effect of Fertilizer and Brush Control on Soil
Fertility
W.E. MCMURPHY, L.M. ROMMANN, J.H. STIEGLER, AND J.F. STRITZKE
Abstract
Seven years after herbicide application was applied to reduce woody vegetation and increase native grass, there was no change in total available soil N03-N, P, and K in the surface 15 cm. However, the area of native grass conversion had more soil K in the surface 5 cm and a higher pH in the surface 15 cm than the area supporting woody vegetation. Brush control followed by seeding of tall fescue (Festuca arundinacea) and annual fertilization with N, P, and K increased total available soil P and K in the surface 15 cm. Most of the P increase was in the surface 5 cm. Fertilizer applied to areas seeded to fescue appeared to reduce soil pH from that of native grass conversion.
Eastern Oklahoma has several million hectares of range- land presently dominated by woody vegetation. Over the
past
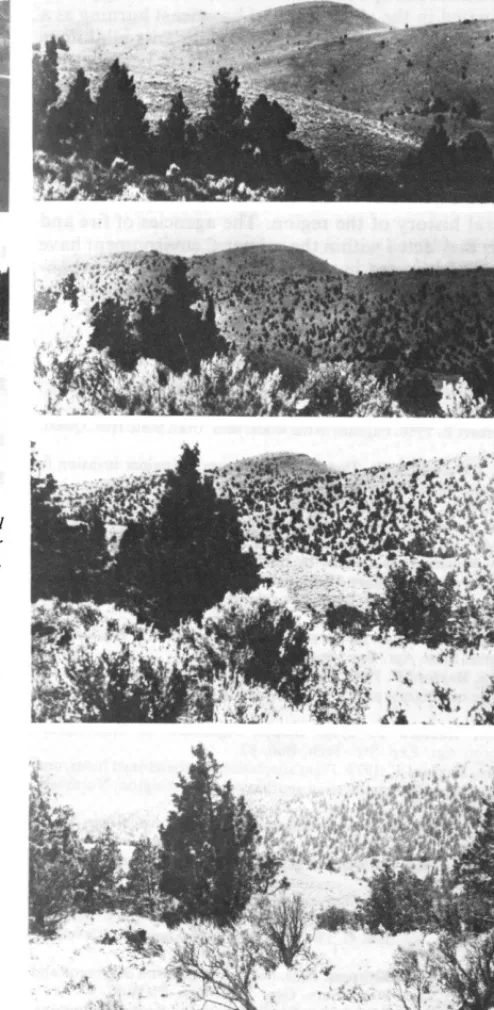
30 years some of these lands have been cleared of brush by herbicide and mechanical means to increase grass pro- duction. McMurphy et al. (1976) described a method of converting such land to a tall fescue Festuca arundinacea) pasture through aerial herbicides, controlled burning and aerial seeding with fertilization.The objective of this study was to evaluate some of these fertilizer and herbicide effects upon soil fertility.
Study Area and Methods
The study site was near Lamar in eastern Hughes County, Okla., at the western edge of the Ouachita Highland resource area. The mean annual precipitation is approximately 105 cm and reasona- bly well distributed throughout the year with only the month of January receiving less than 5 cm. The soils are of the Hector- Hartsells association (Lithic Dystrochrepts and Typic Haplu- dults). The stony outcrops, low water holding capacity, and 5 to 30 percent slopes place it in Capability Class VII as a Shallow Savan- nah range site.
The dominate overstory vegetation is blackjack oak (Quercus marilandica) and post oak (Q. stellata). Understory woody species are winged elm (Ulmus alata), hickory (Carya spp.), and tree huckleberry (Vaccinium arboreum). The major grasses are broom- sedge (Andropogon virginicus) and little bluestem (Schizachyrium scoparium).
Studies were initiated in 1970. Four areas of over 30 ha each were studied and are hereafter referred to as (I) brush, (2) native grass, (3) fescue 1970, and (4) fescue 1973. The brush was an untreated area with a heavy wooded cover as described above. Native grass area was sprayed in 1970 and 1972 for brush control and the resulting increase of native grass. Fescue 1970 was sprayed for brush control in 1970 and 1972 followed by seeding of Kentucky 3 1 tall fescue (Festuca arundinacea) in the fall of 1970 and fertilized annually. Fescue 1973 was sprayed for brush control in 1973 and seeded to Kentucky 31 tall fescue followed with fertilization of about one half as much total fertilizer as fescue 1970 received.
Authors are professors and associate professors of Agronomy, Oklahoma State University, Stillwater 74074.
This report is Journal article 3650 of the Agricultural Experiment Station, Okla- homa State University, Stillwater 74074. This research was supported in part by the Sarkeys Foundation, Oklahoma City.
Manuscript received July 15, 1979.
408
The general methods of the aerial seeding and fertilization of tall fescue has been described by McMurphy et al. (1976) and details of the herbicide treatments have been published by Stritzke et al. (1975). Basically, treatments involved aerial herbicide application in early June, a controlled burn in September, followed by aerial seeding of fescue and fertilization. Total fertilizer applied to the fescue 1970 treatment was 746 kg of N, 100 kg of P, and 220 kg of K/ha, while fescue 1973 treatment received a total of only 328 kg of N, 59 kg of P, and 116 kg of K/ha.
Ten soil samples were taken from each area in July, 1977. Each of these 10 samples was a composite of 6 sub-samples, which were then fractioned into depths of O-5 cm, 5-10 cm, lo-15 cm and 15-30 cm. While the major soils in the area were of the Hector- Hartsells association, samples were taken only from the Hartsells fine sandy loam. The rocky nature of the Hector soils prevented sampling at these depths.
Available phosphorus was extracted with the Bray-P1 extrac- tant using a 2O:l solution to soil ratio. Exchangeable potassium was determined on an atomic absorption spectrophotometer. Soil pH was determined on a 1:l soil to water paste.
Results
Conversion from brush to native grass had no apparent effect on soil fertility 7 years later (Table 1). However, there
Table 1. Mean soil test results for different land uses (surface 15 cm) and different soil depths.
Kg/ ha of available
Item Soil P Soil K PH
Land Use
Brush 10 95 5.1
Native Grass Release 11 108 5.5
Fescue 1970 63 176 5.2
Fescue 1973 45 203 5.0
LSD (I-0.05) 6 36 0.2
was a difference in distribution of soil K with a significant increase in the surface 5 cm in the native grass area (Fig. 1). The amount of P and K in soil from these two unfertilized areas would be considered low and less than 50% sufficient for growth of warm-season grasses (Tucker 1977).
Both tall fescue areas had significantly greater quantities of soil P than the unfertilized areas (Table 1). This accumu- lation of soil P was related to the amount of fertilizer P applied and would be about 95 and 90% sufficient for opti- mum tall fescue production in fescue 1970 and fescue 1973, respectively (Tucker 1977). It is also significant that most of the applied P was still in the top 5 cm (Fig. 2). This empha- sizes the need for good soil conservation practices on these land areas since any loss of top soil would result in signifi- cant P loss.
The amount of soil K was also significantly increased on the fescue converted areas (Table 1) and this is estimated to
150
125
100
25
. BRUSH
0 NATIVE
0 FESCUE
A FESCUE GRASS
1970
1973
I I I I
- _- __ _-
5 10 15 30
CM SOIL DEPTH
Fig. 1. Available soil K @pm) at dfferent soil depths as affected by fertilizer and brush control. LSD (p=O.O5)=12.8 ppm.
be 80% sufficiency for tall fescue (Tucker 1977). This repres- ents essentially a doubling of soil K and an increase was generally reflected at all depths (Fig. 1).
The treatments affected soil pH (Table 1). Converting the brush area to native grass resulted in a significant increase in soil pH. However, converting to tall fescue and fertilizing resulted in a pH no different than the brush area. It is possible that the resulting increase in pH that occurred with native grass was offset in fescue by the acidifying effect on the applied N fertilizer (McMurphy et al. 1975).
Available soil N was determined by the N03-N analysis.
50
40
0 30 -I
i z k 20
10
l BRUSH
0 NATIVE
0 FESCUE
fi FESCUE GRASS
1970
1973
5 10 15 30
CM SOIL DEPTH
Fig. 2. Available soil P (ppm) at different soil depths as affected byfertilizer and brush control. LSD (FO.O5)=4.4 ppm.
All samples contained less than 6 kg of available N/ha with no significant difference among treatments.
Literature Cited
McMurphy, W.E., C.E. Denman, and B.B. Tucker. 1975. Fertilization of native grass and weeping lovegrass. Agron. J. 67: 233-236.
McMurphy, W.E., J.F. Stritzke, B.B. Webb, and L.M. Rommann. 1976.
From brush range to tall fescue pasture with aerial treatments. Range- man’s J. 3: 119-121.
Stritzke, J.F., W.E. McMurphy, and R.W. Hammond. 1975. Brush control with herbicides In: Sarkeys Research and Development Report. Okla- homa Agr. Exp. Sta. Misc. Pub. 95.
Tucker, B.B. 1977. Oklahoma soil fertility handbook. Oklahoma Agr. Ext. Serv. in cooperation with Okla. Plant Food Educ. Sot.
Nutritive Content of Sheep, Goat, and White-
tailed Deer Diets on
Rangeland in Texas
Excellent Condition
F.C. BRYANT, M.M. ROTHMANN, AND L.B. MERRILL
Abstract
A one-year study was initiated in August, 1975, to examine the nutritive content in diets of four kinds of sympatric ruminants on excellent condition rangeland of the Edwards Plateau in Texas. Sheep, Angora goat, and Spanish goat diets were collected from animals fitted with permanent esophageal cannulae. Nutritive con- tent of white-tailed deer diets was estimated by hand-plucking representative forages as the deer were observed grazing them. Mean, annual levels of crude protein (CP) were similar among the four kinds of animals. All diets were lowest in CP during January and February, with livestock diets showing higher levels than deer. However, deer diets were higher in CP than sheep and goat diets during spring and summer. During January and February, the livestock diets warranted only minimum protein supplementation while deer diets were significantly below recommended levels. Digestible energy (DE) levels were higher for sheep diets than for diets of either goats or deer. Similarly, the goat diets were higher in DE than deer diets. The DE levels were generally adequate for sheep but critically low for Angora goats during late gestation. Deer diets were very low in DE during winter and again in early summer, coinciding with the period of peak lactation. Energy would appear to be more limiting for animal production than protein under the conditions of this research.
Several kinds of herbivores are sympatric on the Edwards
Plateau of Texas. The smaller herbivores using the range-
land are sheep, Angora goats, Spanish goats, and white-
tailed deer (Odocoileus
virginianusL.). Sheep and Angora
goats were introduced at the turn of the century, while
Spanish goats are a more recent introduction. White-tailed
deer have long been part of the endemic fauna.
Sheep differ from goats in their foraging preference
(McMahan 1964). There are indications that Spanish and
Angora goats express different forage preferences under
certain conditions (C.A. Taylor, pers. comm.); however,
these differences apparently were minor on excellent condi-
tion rangeland (Bryant et al. 1979). Differences in observed
forage preferences and in nutrient requirements of the dif-
ferent kinds of animals suggest that each may require differ-
ent management to obtain optimum production.
Good range management practices have generally been
thought to benefit animal production. Thus, as more pro-
ducers strive to improve their ranges, it is important to
determine, seasonally, nutrients that may limit animal pro-
duction on ranges in higher condition classes. Information
Authors
are assistant professor, Range and Wildlife Management, Texas Tech University, Lubbock 79409; professor, Department of Range Science, Texas A&M University, College Station 77843; and professor in charge, Texas A&M University Research Station at Sonora 76950. Portions of this research were submitted in partial fulfillment of requirements for the Ph.D. degree in Range Science at Texas A&M University by Bryant. The authors gratefully acknowledge the assistance of Charles A. Taylor and Ed Huston of the Texas Agricultural Experiment Station.This report is TA 14973 from the Texas Agricultural Experiment Station. Manuscript received March 26, 1979.
410
on nutrient levels in diets from excellent condition range-
land was not available for the Edwards Plateau.
The objective of this study was to determine the nutritive
content of diets selected by sheep, Angora goats, Spanish
goats, and white-tailed deer on an excellent condition
rangeland.
Study Area and Methods
The field research was conducted at the Texas A&M University Agricultural Research Station located on the Edwards Plateau near Sonora, Texas. Topography, climate, and vegetation there have been described by Smeins et al. (1976) and Bryant and Koth- mann (1979). Briefly the study area occurs at 735 m elevation, has an average rainfall of 65 cm, and a growing season of 235 days.
The study area was an 8-ha enclosure located within a 33-ha pasture and was described in detail by Bryant et al. (1979). From
1948 to 1970, the pasture received light continuous grazing (16 ha/animal unit [au]) with a 2:l:l au ratio of cattle, sheep, and Angora goats, respectively. In 1970, it was rootplowed and seeded with both introduced and native grass species. Stocking rate was subsequently increased to 6.5 ha/au and the Merrill grazing system (four pastures, three herds, 12 mo grazing followed by 4 mo rest) was applied. To take advantage of high forage production, the stocking rate was further increased to 5.4 ha/au in 1974 and to 5.2 ha/au in 1977. This pasture was considered to be in excellent range condition and has consistently yielded the greatest production per animal of any pasture on the Sonora Research Station (L.B. Merrill, pers. comm.).
Diets of all four kinds of animals were sampled on five consecu- tive days each month for 1 yr, beginning August 20, 1975. The livestock and deer were fasted overnight before each collection day. Bryant et al. (1979) reported how the animals were handled and the collection regime.
Livestock diets were obtained from four
each of Angora goats,Spanish goats, and sheep fitted with permanent esophageal
cannu- lae described by Taylor and Bryant (1977). Due to losses, a total of 8 Angora goats, 11 Spanish goats, and 9 sheep were used to collect diet samples throughout the study. Each sampling day, the extrusa samples were collected in screen-bottomed bags, thoroughly hand- mixed, and a sub-sample was taken and stored at -20” C for chemical analysis.Twenty, wild-trapped white-tailed deer fawns were raised and trained following the guidelines of Reichert (1972). Two adapted to the rigors of transporting and handling and could still be allowed free range of the study area without the confines of a leash (Fig. 1). At project initiation one fawn was 5 mo old while the other was-4 mo. Thus, the deer used were in their most critical nutritional stage of life, weanling to yearling age (4 to 17 months).
Samples of species and their plant parts were hand-plucked each collection day to represent those selected by the deer as they were observed grazing the study area. The basic criteria suggested for use of hand-plucking, the selection of plant parts (Halls 1954) and
use of lightly grazed areas (Cook 1964), were observed in tixs study. Hand-plucked samples were frozen within 1 hr of collection and stored at -20” C.
All diet and hand-plucked samples were freeze-dried (-50” C, 20-100 microns of pressure) and ground in a Wiley mill to pass a l-mm screen. They were composited across individual animals within days and across days within individual animals for each kind of animal within collection periods. Chemical analyses included organic matter (%), organic nitrogen (%), and in vitro digestible organic matter (%).
Crude protein (CP) was calculated by multiplying total organic nitrogen X 6.25; digestible energy (DE) was estimated by the procedure described later. All values reported are expressed on an oven-dry, organic matter basis to avoid variability from ash con- tamination by saliva.
Organic matter was determined by ashing duplicate samples in a muffle furnace at 550° C for 5 hr. Nitrogen determination, expressed as crude protein, followed the micro-Kjeldahl procedure
(A.O.A.C. 1970). Invitrodigestibleorganicmatterwasdetermined
following the procedures of Van Soest (1970). Sheep and goat samples were incubated 48 hr using steer innocula. The hand- plucked deer samples were incubated for48 hrusinginnocula from one of the deer used during the study and later fitted with a rumen fistula. Following the incubation, samples were killed with mer- curic chloride and stored in a refrigerator until they were refluxed in a neutral detergent solution. Digestible energy was calculated from in vitro digestible and neutral detergent extractable organic matter using the formula:
D.E. = (G-4 (0 x R
(G) VJ
where:
D.E. = digestible energy in kcal/kg organic matter. G = organic matter (%) X oven-dry weight (g) of
salrlple.
H = weight (g) of organic matter residue after in vitro digestion and neutral detergent extraction. I = known in viva digestibility of a standard forage. _I = batch in vitro digestibility of a standard forage. K = constant of 4,000 kcal/kg of digestible organic
matter.
Anderson (1977) reported all laboratory procedures in greater detail.
In order to evaluate the effect of innoculum source, 20 deer samples from all seasons of the year were incubated with steer
innocula. Digestibility coefficients of all deer samples were adjusted to correct for the significant difference (K.05) between steer and deer innocula using the following regression equation:
y = -.a31 +.871x
where:
y = .uncorrected digestion coefficient of hand-plucked deer samples incubated with steer innocula X = uncorrected digestion coefficient of hand-plucked
deer samples incubated with deer innocula
Nutrient content of diets was subjected to analysis of variance to detect significant differences among kinds of animal, periods, and the kind X period interaction. Differences among means were evaluated with Duncan’s multiple range test (Dixon and Massey
1969).
Crude Protein
Results and Discussion
Mean annual CP content of the diets selected by the four kinds of animals was similar (Table 1). However, changes in
availability of forage and associated dietary shifts induced seasonal fluctuations in the levels of CP for each kind of animal (Fig. 2).
Kind of animal
Crude protein’ (%I
Digestible energy2 www
11.1 2283b
11.1 2278b
10.9 2492”
Sheep, goat, and deer diets were relatively constant in CP from late summer until November when diets began to decline (Fig. 2). During January and February crude protein levels ranged from 7.1 to 8.7%, the lowest levels observed during the study. Crude protein levels in the diets of all animals increased markedly when forb growth began in spring (Bryant et al. 1979). Deer diets showed dramatic increases in CP content, especially in April when the hand- plucked diets approached 18%, which was higher (p<O.OS) than CP levels of any livestock diets. Percent CP in all diets declined in May as forb standing crop increased (Bryant et al. 1979). Kothmann (1968) noted no decline in crude pro- tein levels of sheep diets from April to May. However, for Angora goats, Malechek (1970) reported a decline from April to May in dietary crude protein similar to that found in this study. These variations are probably a function of different stages of plant maturity in May resulting from different growing conditions. Usually, structural carbohy- drates increased and percent CP decreases with increased plant maturity.
16 1
a-- - --a ANGORA GOAT ( k=ll 1%)
x-x SPANISH GOAT ( R=ll 1%)
‘+-&i f
I -- -0
s 1 , I I I I 1 1 1 ’ ’
A S 0 N D J F M A M J J
MONTH
181
A S 0 N D
~;~ONT;
M A M
Fig. 2. Crude protein levels (%) in diets selected by Angora goats, Spanish goats, sheep, and white-tailed deer grazing excellent condition rangeland on the Sonora Research Station during 1975-76.
regrowth which was of high quality due to the rain and also was more available because the non-test livestock were removed from the pasture.
According to Huston et al. (197 I), Angora goats require not less than 9.0% CP regardless of weight or physiological status. The CP requirements for gestation, lactation, and growth vary from 10.0 to 13.3% depending upon weight. Percent CP required by Spanish goats, though unknown, is likely lower than for Angoras since Angoras produce mohair and Spanish goats do not. Thus, under excellent range conditions, Angora and Spanish goat diets appeared to contain sufficient CP for maintenance in all months except January and February (Fig. 2). Although this defi- ciency was slight, minimal protein supplementation would be recommended for producing animals (growing kids or pregnant females). Rangeland in low condition classes may require more protein supplement for longer periods due to the reduced diversity of high-quality plants and inadequate forage quantity.
Sheep require 8.9% CP for maintenance (N.R.C. 1975). Their diets were at or above maintenance in all autumn months and would have derived little benefit from supple- ment unless they had been in late gestation during January and February (Fig. 2). Researchers in other localities have
412 JOURNAL OF RANGE MANAGEMENT 33(6), November 1980
also reported that CP content of sheep diets was not limiting to animal production (Arnold et al. 1966; Bedell 1971; Wil- son 1976).
Crude protein requirements for white-tailed deer, espy-
cially
fawns are thought to be higher than for livestock. Murphy and Coates (1966) considered 12% CP adequate for growth and reasonable production. French et al. (1956) found 13-16s CP was required by young deer for optimum growth. Ullrey et al. (1967) reported fawns receiving a 13% CP ration gained significantly faster than those receiving 8% CP. Unfortunately, these results have been compiled from deer where the dietary level of CP was held constant and not subject to seasonal fluctuations that free-ranging deer expe- rience. Also, the energy value of the rations was given little consideration. Regardless, diets selected by fawns in this study may have been below their CP requirements for opti- mum growth from August through March (Fig. 2). The CP levels late in autumn may have been adequate for pregnant does in early gestation. However, there was an especially critical period in January and February when deer diets contained as little as 7% CP. Milford and Haydock (1965) reported 7% CP was the minimum level required by sheep for positive nitrogen balance. At least 8% CP was needed for maximum cellulose digestion in lambs (Church 1972). Since diets were hand-plucked and actual CP levels in deer diets were probably higher, the hand-plucked estimates may represent the minimum. However, the low levels observed in this study indicate a nutritional problem for growing fawns. Digestible EnergySheep selected diets higher (K.05) in DE than did goats or deer (Table 1). Digestible energy in Angora and Spanish goat diets did not differ significantly, but deer diets were lower (K.05) in DE than goat diets.
There was a significant interaction of kind of animal by collection period. Digestible energy content of all diets gen- erally declined from August through January, but deer diets continued to decrease through February (Fig. 3). These reductions in DE were associated with increased browse in diets, primarily leaves and twigs of plateau oak (Quercus virginianus var. fusiformes [Small] Sarg.), and reduced amounts of grasses and forbs. However, during January, D.E. remained low even when grass increased in all livestock diets by an average of 15% (Bryant et al. 1979). Thus diets shifted from predominantly browse to about equal propor- tions of grass and browse (Bryant et al. 1979). This shift apparently did not result in an increase in DE in the diets (Fig. 3). During February, when grass dominated sheep and Angora goat diets, DE increased significantly. Digestible energy in Spanish goat diets also increased in February; however, their diets were still lower (P<.O5) in DE than either Angora goat or sheep diets. Spanish goats selected nearer a 50:50 grass:browse mixture in February (Bryant et al. 1979) and the oak browse depressed DE levels. Deer selected primarily browse through the winter months and their lowest dietary level of DE (1,806 kcal/ kg) was recorded during February.
The availability of cell walls to a ruminant is largely a function of lignification, which depresses digestibility (Van Soest 1967). Cell walls of browse are highly lignified, approaching 15% in some browse species (Wilson et al.
2800
a---a ANGORA GOAT(R=2283kcal/kg) x-x SPANISH GOAT CR=2278 kcal/kg)
E
1600
-I
I
I I I I I I 1 I I I I
A S 0 N D M A M J J
2900 -I
I
s---s SHEEP(X=2492iual/kg) I \ I
2700 I \
d4 DEER CR=2027 kcallkg) I \ I’
I’ \ l
I \ 1
A S 0 N D M A M J J
Fig. 3. Digestible energy levels (kcaljkg) in diets selected by Angora goats,
Spanish goats, sheep, and white-tailed deer grazing excellent condition rangeland on the Sonora Research Station.
generally results in low digestibility (Wilson et al. 1979), and thus, low DE.
In March when forbs (Bryant et al. 1971) and CP content increased in all diets, DE increased significantly (K.05) only in deer diets. Levels of DE in goat diets actually decreased while DE in sheep diets remained constant. Evi- dently, the increase in forbs was not the reason for the observed increase of DE in deer diets. Grass use decreased in Angora goat diets, remained constant in sheep diets, and increased slightly in Spanish goat and deer diets (Bryant et al. 1979). The increase in DE in deer diets may be explained either by the increased use of succulent grass, the ability to select higher quality forb species, or both.
Goat diets were relatively low in DE from December through March. This period coincides with late gestation since Angora goats are generally bred to kid in March. Van der Westhuysen and Roelofse (197 1) reported that long term sub-maintenance energy feeding from mid- to late gestation increased abortion rates of both habitual aborters and apparently normal females. Consequently, it may be neces- sary on the Edwards Plateau to supplement energy during
winter, especially if goats are known to be consuming large amounts of Plateau oak.
Digestible energy levels in the diets of all kinds of animals increased significantly during April. Sheep diets remained high in DE during May while goat and deer diets declined. This was attributed to low browse content in diets of sheep (2-S%), while goat diets were as high as 25-35s browse. Since most sheep and goats are bred for spring lambing or kidding, the higher DE in spring diets would accompany their period of heavy lactation.
Browse increased sharply in diets of all kinds of animals during June, corresponding to the hot, dry weather (Bryant et al. 1979). Digestible energy in goat and deer diets, which contained more than 30% browse during June, dropped to critically low levels comparable to those observed in December and January. Although sheep diets also decreased in DE, the levels were comparable to those in late summer or late winter. This suggests DE was critically low not only in winter but also during late spring-early summer. The latter period corresponds to the time when white-tailed deer normally are in heavy lactation.
Digestible energy increased in the diets of all kinds of animals in July as favorable weather prevailed and percent grass and forbs in diets increased and browse decreased. Summers in Texas usually remain hot and dry. Thus con- tinued low energy levels in deer diets during summer may be partly responsible for an August-September die-off of young deer which is frequently experienced (Marburger and Thomas 1965).
From the data gathered in this study, energy appears to be the major limiting nutrient on excellent condition range- land. Assuming energy requirements of 2,200 kcal/ kg for Angora goats weighing 36 kg (Huston et al. 1971), diets in this study did not meet minimum levels for maintenance of Angora goats in November, December, January, March, and June. Information was not available as to the energy requirements for Spanish goats. A 70-kg ewe requires 2,400 kcal/kg of feed ingested for maintenance (N.R.C. 1975). Diets contained sufficient energy to meet the requirements for ewes on all dates except in November, December, and January (Fig. 3). Digestible energy also appeared low in February and March for ewes in late gestation bred to lamb in March, but was adequate for heavy lactation by April. But, livestock in good condition going into winter may be able to cope with minor energy shortages by catabolizing fat depots.
Digestible energy content of deer diets probably would not have provided the 173 kcal/ kg BW.75 required for opti- mum growth of fawns or the 160 kcal/ kg BW.75 required by pregnant does, assuming does and fawns select similarly in the quality of the diets (Ullrey et al. 1969, Thompson et al. 1973). These low estimates of DE for deer suggest a need for refining techniques to determine DE content of their diets. Even so, the comparatively low levels observed in June were indicative of critically low levels of DE for lactating does, growing fawns, and maturing bucks,
Conclusions
Livestock diets from rangeland in excellent condition appeared to contain levels of CP acceptable for maintenance and production. Small amounts of protein supplement probably would have been beneficial during January and February. Deer diets also were lowest in CP during the
winter months and intensive deer herd management would
necessitate supplemental protein at this time. Supplemental
feeding of deer, however, should be accompanied by a har-
vest of surplus animals.
Energy appeared to be marginal at times during summer
and early autumn and deficient during late autumn and
winter for all four kinds of animals. The lactating female
deer
mayrequire energy supplementation
during early
summer. Angora goats require additional energy during late
gestation (December, January, and February) to improve
kid crops and overall reproductive performance, especially
during dry winters when goats eat large amounts of Plateau
oak.
Literature Cited
Anderson, D.M. 1977. Standing crop, diets, travel, and weight changes
under short duration and continuous grazing. Ph.D. Diss. Texas A&M Univ., College Station. 180 p.
Arnold, G.W., J. Ball, W.R. McManus, and LG. Bush. 1966. Studies on the
diet of the grazing animal. I. Seasonal changes in the diet of sheep grazing on pastures of different availability and composition. Aust. J. Agr. Res. 17: 543-556.
Association of Official Agricultural Chemists. 1970. Official methods of
analysis. (1 lth ed.) Ass. Off. Agr. Chem., Washington, D.C. 1015 p.
Bedeii, T.E. 1971. Nutritive value of forage and diet of sheep and cattle
from Oregon subclover-grass mixtures. J. Range Manage. 24: 125-133.
Bryant, F.C., and M.M. Kothmann. 1979. Variability in predicting edible
browse from crown volume. J. Range Manage. 32: 144-146.
Bryant, F.C., M.M. Kothmann, and L.B. Merrill. 1979. Diets of sheep,
Angora goats, Spanish goats and white-tailed deer under excellent range conditions. J. Range Manage. 32: 412-417.
Church, D.C. 1972. Digestive physiology and nutrition of ruminants. Vol. 2
Nutrition. Oregon State Univ., Book Stores, Inc. Corvallis. 801 p.
Cook, C.W. 1964. Symposium on nutrition of forages and pastures: Col-
lecting forage samples representative of ingested material of grazing animals for nutritional studies. J. Anim. Sci. 23: 265270.
Dixon, W.J., and F.J. Massey. 1969. Introduction to Statistical Methods.
McGraw-Hill Book Co. 637 p.
French, C.E., L.C. McEwan, N.D. Magruder, R.H. Ingram, and R.W.
Swift. 1956. Nutrient requirements for growth and antler development in
the white-tailed deer. J. Wildl. Manage. 20: 221-232.
Halls, L.K. 1954. The approximation of cattle diet through herbage sam- pling. J. Range Manage. 7: 269-270.
Huston, J., M. Shelton, and W.C. Ellis. 1971. Nutritional requirements of
the Angora goat. Texas Agr. Exp. Bull. 1105: l-16.
Kothman, M.M. 1968. The botanical composition and nutrient content of
the diet of sheep grazing on poor condition pasture compared to good condition pasture. Ph.D. Diss. Texas A&M Univ., College Station. 60~.
Malechek, J.C. 1970. The botanical and nutritive composition of goat diets
on lightly and heavily grazed ranges in the Edwards Plateau of Texas. Ph.D. Diss. Texas A&M Univ., College Station. 61 p.
Marburger, R.G., and J.W. Thomas. 1965. A die-off in white-tailed deer of
the Central Mineral region of Texas. J. Wildl. Manage. 29: 706-716.
McMahan, C.A. 1964. Comparative food habits of deer and three classes of
livestock. J. Wildl. Manage. 28: 798-808.
Milford, R., and K.P. Haydock. 1965. The nutritive value of protein in
subtropical pasture species grown in southeast Queensland. Aust. J. Exp. Agr. Anim. Hus. 5: 13-17.
Murphy, D.A., and J.A. Coates. 1966. Effects of dietary protein on deer.
Trans. N. Amer. Wildl. Conf. 31: 129-138.
National Research Council. 1975. Nutrient requirements of domestic ani-
mals; No. 5. Nutrient requirements of sheep. National Academy of Sciences. 72 p.
Reichert, D.W. 1972. Rearing and training deer for food habits studies.
U.S. Dep. Agr., Forest Serv. Res. Note RM-208. 7 p.
Smeins, R.E., T.W. Taylor, and L.B. Merrill. 1976. Vegetation of a 25-year
exclosure on the Edwards Plateau of Texas. J. Range Manage. 29: 24-29.
Taylor, C.A., and F.C. Bryant. 1977. A durable esophageal cannula for
sheep and goats. J. Range Manage. 30: 397-398.
Thompson, C.B., J.B. Holter, H.H. Hayes, H. Silver, and W.E. Urban, Jr.
1973. Nutrition of white-tailed deer. I. Energy requirements of fawns. J.
Wildl. Manage. 37: 301-311.
Ullrey, D.E., W.G. Youatt, H.E. Johnson, L.D. Fay, and B.L. Bradley.
1967. Protein requirements of white-tailed deer fawns. J. Wildl. Manage.
3 1: 679-785.
Ullrey, D.E., W .G. Youatt, H.E. Johnson, L.D. Fay, B.L. Schoepke, and
W.T. McGee. 1969. Digestible energy requirement for winter mainte-
nance of Michigan white-tailed does. J. Wildl. Manage. 33: 482490.
Van der Westhuysen, J.M., and C.S.M.B. Roelofse. 1971. Effect of shelter
and different levels of dietary energy and protein on reproductive perfor- mance in Angora goats with special reference to the habitual aborter. Agroanimalia. 3: 129- 132.
Van Soest, P.J. 1967. Development of a comprehensive system of feed
analysis and its application to forages. J. Anim. Sci. 26: 119-128.
Van Soest, P.J. 1970. Chemical basis for the nutritional evaluation of
forages. Proc. Nat. Conf. on Forage Qual. Eval. and Util., Lincoln, Neb., 1969. p. Ul-U19.
Wilson, A.D. 1976. Comparison of sheep and cattle grazing on semi-arid
grassland. Aust. J. Agr. Res. 27: 155-162.
Wilson, A.D., N.C. Weir, and D.T. Torreli. 1971. Evaluation of chamis
(Adenostoma fasiculatum) and interior live oak (Quercus wizlizenii) as feed for sheep. J. Anim. Sci. 32: 1042-1050.
CHANGE OF ADDRESS notices should be sent
to the Managing Editor, 2760 West Fifth Ave., Denver, Colo. 80204, no later than the first day of the month of issue. Copies lost due to change of address cannot be replaced unless adequate notice is given. To assure uninterrupted service, provide your local postmaster with a Change of
Address Order (POD Form 3575) indicating
thereon to guarantee forwarding postage for second-class mail.