IJEDR1502210
International Journal of Engineering Development and Research (www.ijedr.org)1290
Early Detection of Lung Cancer Using Image
Processing and Classification Technique
1
Neha,
2Dr. Jayant Shekhar
1S.I.T.E.,2Professor (Director,SITE) 1Department of CSE,
1Subharti Institute of Technology & Engineering, Meerut,India
________________________________________________________________________________________________________
Abstract - In this paper, an approach is proposed which uses CT scan images of lungs for the effective diagnosis of lung
cancer at a prior stage thus increases the survival rate of patient. The most common sign of lung cancer is the pulmonary nodule. The most crucial and important aspect of image processing is the effective identification of lung cancer nodules. This system first preprocesses the image in dicom format (DCM) for removal of noise and segmentation of the region of interest. Feature vector is then defined by extracting the structural and textural features. In this paper, support vector machine(SVM) classifier is applied to detect lung cancer as well as its severity(whether stage 1 or stage 2)as this algorithm achieves a accuracy of 95.12% which helps to reduce the mortality rate of this deadly disease by taking the remedial actions by patients.
Index Terms - Dicom , classifier, SVM & feature vector.
________________________________________________________________________________________________________
I.INTRODUCTION
Cancer is considered as a major health problem in the world today. According to GLOBOCAN 2012 statistics, 8.2 million deaths occurred in 2012 and 14.1 million new cases were diagnosed, due to cancer which is quiet high as compared to 12.7 million new cases and 7.6 million deaths due to cancer in the year 2008. According to study [1], it has been found that Lung Cancer causes the highest mortality rate worldwide than all other types of cancer. Lung cancer is considered as the most common malignancy leading to the cancer related death, survival from which is highly dependent on the early and accurate diagnosis [2]. If Lung cancer is diagnosed at an early stage, then there is a survival rate of 47% according to American cancer society. In present scenario, automated diagnostic systems field plays a crucial role in the diagnosis of any disease. Image Processing and data mining are such field where automated diagnostic system is designed especially for medical diagnosis results in the solution that can help in decreasing the mortality rate.
With the increase in population, volume of data is also growing proportionally, so there is a greater need of extracting the knowledge from the data. Data mining contributes much towards this and has its application also in the healthcare industry. Lung cancer can use data mining for its early detection as being a disease it is highly dependent on previous data. Data mining has already have applications in the diagnosis of cancer such as classification of cancer stage from tree-text histology report [3], cancer lesion detection [4], and breathe biomarker detection [5] and pulmonary nodule detection [6], and so on. The automatic system that we define here takes the various images of the lung cancer patients as the input, preprocessed the images, extract features for forming the feature vector then performs the classification for the positive or negative category of lung cancer based on Support Vector machine (SVM).
II.LITERATURE SURVEY
Various works already proposed for detection of the lung cancer has been summarized.
The work presented in [7] proposes An automatic CAD system for early detection of lung cancer by analyzing LUNG CT images using several steps. The approach starts by extracting the lung regions from the CT image using several image processing techniques. Bit plane slicing technique is used in the first step in the extraction process to convert the CT image into a binary image. After the extraction step, the extracted lung regions are segmented using region growing segmentation algorithm. Then, the initial lung candidate nodules resulting from the Region growing segmentation are analyzed to extract a set of features to be used in the diagnostic rules. After that to segment the lung region to detect cancerous region and to get the accurate result. The work proposed in [8], implements a genetic algorithm for lung nodule detection based on spherical forms. The algorithm was tested on 70 CT scan tests and gets an accuracy of 90% by obtaining a correct detection of 160 nodules with a false positive value of 14.6/test. The research work presented in [9] focuses on the problem of extracting the candidate nodule. “Break and fix” methodology has used. The performance of the method is measured by doing experiments on CT scans which shows accuracy and robustness.
IJEDR1502210
International Journal of Engineering Development and Research (www.ijedr.org)1291
In the work in [11], a three step segmentation process has been proposed for the analysis of lung image. If the area occupied by GGO (Ground Glass Opacity) is large in CT image, then doctor easily extract the features. However, when GGO exists as a small area, there is a higher possibility to overlook the light gray shadow . In their model, first step is to extract ROI to segme nt the lung area. Preprocessing of the CT slices is carried out by using binarization, labeling, shrinking and expansion to achieve better segmentation accuracy. Calculation of features of GGO shadows like mean value, semi interquartile range and standard deviation have been carried out in the second step. In the final step, linear discriminant function is used to extract the GGO shadow’s regions . Feature values of the suspicious shadows were calculated to classified them into a certain number of classes.In [12], they proposes a method for obtaining the size of a nodule by analyzing the scale space, and uses Gauss Laplacian for obtaining the features, after that, the diameter is obtained.
III.METHODOLOGY
This section gives the detailed description of the proposed lung nodule classification methodology .The system comprises of the following steps: 1) Image acquisition,2)Preprocessing,3) Postprocessing, 4) Calculation texture and structural features and SVM classification. The classifier is trained and tested, and used to predict the severity of the cancer patient (stage-I or stage-II). Explanation of each stage is presented in the following section:
A. Image Acquisition
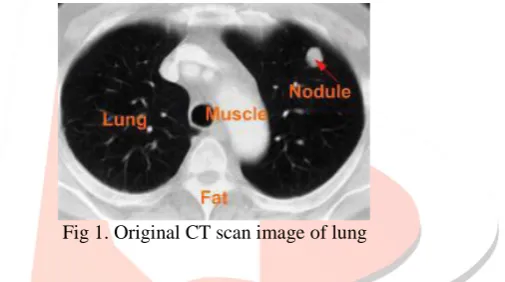
The initial stage of the proposed automatic techniques is the extraction of lung region from the CT scan image. . The grayscale images of the lungs with and without nodules. The images were in digital imaging and communications in medicine (DICOM) which is the standard for medical images.
Fig 1. Original CT scan image of lung
B. Preprocessing
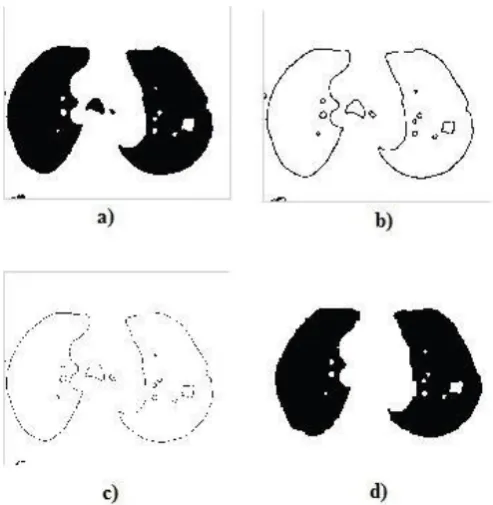
In this section, preprocessing step is described to get the clear region of interest(ROI).Gaussian white noise is the most common noise present in the dicom images. The input image is converted to gray scale and to remove Gaussian white noise, Non Local Mean filter is applied. Lung nodule is separated from other part of the CT scan images by the help of segmentation .Otsu's threshold algorithm is used for the segmentation purpose.
(a) (b) (c)
Fig 2: Segmentation: a) Original Image, b) Background removed Image, c)Threshold Image.
C. Postprocessing
IJEDR1502210
International Journal of Engineering Development and Research (www.ijedr.org)1292
Figure 3 shows the post-processing enhancement process in detail. a)Morphological Operations,b)Border Detected Image, c)Border Thinned Image, d)Filled Image
D. Feature Extraction
Lung nodule detection is one of the most difficult task in computerized lung cancer detection system as lung nodules attached to blood vessels and both are similar in grey scale[13].In this module, output of post processing is given as input for extracting the feature of nodule. On the basis of these features, classifier is trained and tested for providing the final output i.e. severity of the disease. Various features for detecting the lung nodule and formulation of feature vector is described as FV={F1,F2,F3F4,F5,F6}. These features are described as:
1. AREA: It is a scalar value that gives the total number of pixels in the area Of Interest and helps in isolating small objects.
2. EQUIV DIAMETER: It is the diameter of a circle with the same area as the area Of Interest, defined in equation (2.1).
Equiv diameter = √4∗𝐴𝑟𝑒𝑎
√𝜋 2.1
3. CONVEX AREA: It is value that gives the number of pixels in convex image of the area Of Interest which is a binary image with all pixels within the hull filled in.
4. SOLIDITY: The percentage of the pixels in the convex hull that are also in the area Of Interest as defined in equation (2.2).
solidity = 𝑎𝑟𝑒𝑎
𝑐𝑜𝑛𝑣𝑒𝑥 𝑎𝑟𝑒𝑎 2.2
5. ENERGY: is used to describe measure of information in an image, represented in equation (2.3).
energy ( j ) = ∑ 𝐼𝑛𝑡𝑒𝑛𝑠𝑖𝑡𝑦(𝑘)𝑘 2 2.3
6. MEAN & STANDARD DEVIATION: The mean value of an image gives the average intensity value of all the pixels in the same region defined in equation (2.4) and standard deviation,is a measure of how much that gray levels differ from mean, defined by equation (2.5)
Mean(g) = 1
𝑁∑ 𝐼𝑛𝑡𝑒𝑛𝑠𝑖𝑡𝑦(𝑘)
𝑁
1 2.4
Std(g) = 1
𝑁∑ (𝑀𝑒𝑎𝑛(𝑘) − 𝐼𝑛𝑡𝑒𝑛𝑠𝑖𝑡𝑦(𝑘))
𝑁
𝑘=1 2 2.5
IJEDR1502210
International Journal of Engineering Development and Research (www.ijedr.org)1293
IV.EXPERIMENTAL RESULTSThe proposed scheme is thoroughly tested using different lung CT image dataset. A total of 111 images for stage- I and 70 samples for stage-II dataset is taken for experiment from National Lung Screening Trial (NLST). Four-fifth of the total data is used for training and the remaining one fifth is used for testing the classifiers. The Confusion Matrix for the SVM, are shown in table 1.For testing purpose, dataset is 24 images of stage I and 17 images of stage II. Confusion matrix is shown in table 1. TP(True Positive) is 24,depicting that 24 images of stage I are predicted as stage I, FP(False Positive) is 2,depicting 2 images of stage II are predicted as stage I, FN(False Negative) is 0, that is no image of stage I are predicted as stage II. TN(True Negative) is 15, means 15 images of stage II are predicted as stage II.
Table 1: Confusion Matrix for SVM Classification
Actual
Positive Negative Predicted Positive 24
Negative 0 15
Table 2 shows the Performance Metrics (Recall, Accuracy, Specificity, and Precision,) for the test data.
Table 2: Performance Metrics for test data Metrics
Classifier Accuracy(%) Precision(%) Recall(%) Specificity(%)
SVM 95.12 92.31 100 88.24
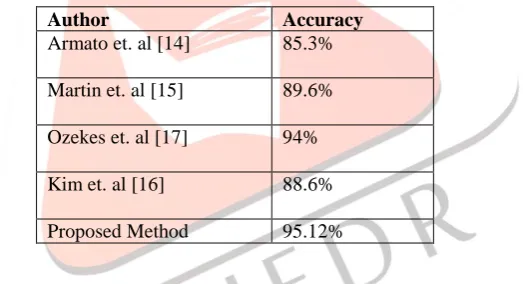
From table 3, it is clearly shown that accuracy of SVM is 95.12% which is much better than the other classifiers. SVM thus more accurately predicts images of stage I and stage II .
TABLE 3: Comparison of proposed method with existing techniques
Author Accuracy
Armato et. al [14] 85.3%
Martin et. al [15] 89.6%
Ozekes et. al [17] 94%
Kim et. al [16] 88.6%
Proposed Method 95.12%
V. CONCLUSION
In this paper, we achieved our purpose of developing an automatic system of higher accuracy using image processing and classification technique for predicting the status of the patient at an early stage of lung cancer. Detailed feature set has been successfully detected. The results got are very satisfactory as the system is more accurate and efficient as SVM classifier has an accuracy of 95.12% with RBF Kernel.
REFERENCES
[1] Ferlay J, Soerjomataram I, Ervik M, Dikshit R, Eser S, Mathers C, Rebelo M, Parkin D M, Forman D, Bray, F (2013).
GLOBOCAN 2012 v1.0, Cancer Incidence and Mortality World Wide: IARC Cancer Base No. 11, Lyon, France: International Agency for Research on Cancer.
[2] A. Farag, A. Ali, J. Graham, and et al., “Evaluation of geometric feature descriptors for detection and classification of
lung nodules in low dose ct scans of the chest,” in Proc. ISBI, 2011, pp. 169–172
[3] M. Iain , M. Darren, F. Mary-Jane ,”Classification of Cancer Stage from Free-text Histology Reports”, Proceedings of the 28th IEEE EMBS Annual International Conference New York City, USA, Aug 30-Sept 3, 2006.
[4] T. Jia , Y. Wei, D. Wu, ”A Lung Cancer Lesions Detection Scheme Based on CT Image”, 2nd International Conference on Signal Processing Systems (ICSPS), 2012.
[5] D. Siqi, H. Tianlin , S. Yang, L. Chun, H. Yuanqing*, “ Detection of Lung Cancer with Breath Biomarkers Based on SVM Regression”, Fifth International Conference on Natural Computation 2009.
[6] L. Yang, Y. Jinzhu , Z. Dazhe,”A Method of Pulmonary Nodule Detection utilizing multiple support V Vector Machine”, International Conference on Computer Application and System Modelling, 2010.
IJEDR1502210
International Journal of Engineering Development and Research (www.ijedr.org)1294
[8] Sousa J. R., Silva A. C., de Paiva A. C. and Acatauass N.R., “Methodology for automatic detection of lung nodules incomputerized tomography images,” Computer Methods and Programs in Biomedicine, vol. 98, no. 1, pp. 1–14, april 2010.
[9] Diciotti S., Lombardo S., Coppini G., Grassi L., Falchini M. and Mascalchi M., “The log characteristic scale: A consistent measurement of lung nodule size in ct imaging,” IEEE Transactions on Medical Imaging, vol. 29, no. 2, pp.
397–409, february 2010.
[10] Lee Y, Hara T, Fujita H, Itoh S, Ishigaki T, “Automated detection of pulmonary nodules in helical CT images based on an improved template-matching technique”, IEEE Trans. Med. Imaging, Vol. 20, pp.595–604, 2001.
[11] Hyoungseop Kim, Seiji Mori, Yoshinori Itai, Seiji Ishikawa, Akiyoshi Yamamoto and Katsumi Nakamura,” Automatic Detection of Ground-Glass Opacity Shadows by Three Characteristics on MDCT Images”, World congress on medical physics and biomedical engineering, IFMBE Pro2, 2007.
[12] Pu J., Paik D., Meng X., Roos J. and Rubin G., “Shape break and repair strategy and its application to automated medical image segmentation,” IEEE Transactions on Visualization and Computer Graphics, vol. 17, no. 1, pp. 115– 124, january 2011.
[13] M. Usman Akram, M. Younus Javed, and Anam Tariq ”Lung Nodule Detection in CT Images using Neuro Fuzzy Classifier “†, Department of Computer Engineering College of Electrical & Mechanical Engineering National University of Sciences & Technology Department of Computer & Software Engineering ‡ Bahria University ‡ Islamabad, Pakistan.
[14] S.G. Armato 3rd , M. B. Altman, J. Wilkie, S. Sone, F. Li, K. Doi, andA. S. Roy. ”Automated lung nodule classification following automatednodule detection on CT: A serial approach”, Med. Physics, Vol. 30,No.6, pp. 1188-1197, June 2003
- 2001.
[15] M. Dolejsi and J. Kybic, ”Automatic two-step detection of pulmonary nodules,” in Proceedings of SPIE, ser. Medical Imaging 2007: Computer-Aided Diagnosis, M. L. Giger and N. Karssemeijer, Eds., vol. 6514. SPIE,February 2007, pp. 1-12
[16] J. S. Kim, J. H. Kim, G. Cho, K. T. Bae, ”Automated Detection of Pulmonary Nodules on CT Images: Effect of section thickness and reconstruction interval”, Journal of Radiology Vol. 236, pp. 295-299,2005 2013