Forage Selection by Mule Deer on Winter
Range Grazed by Sheep in Spring
MICHAEL A. SMITH, JOHN C. MALECHEK, AND KENNETH 0. FULGHAM
Abstract
Late spring grazing by sheep altered the amount of several forage categories available to deer the subsequent autumn and winter. Total herbaceous plant material was much reduced by spring-time sheep grazing, but regrowth following fall precipita- tion increased the proportion of green herbaceous material avail- able. Current year’s growth of bitterbrush was also increased relative to the nongrazed situation due to the release of moisture and nutrients accompanying the removal of herbaceous plants by sheep. Subsequently winter diets of mule deer on the sheep-grazed area were higher in herbaceous components but lower in shrub components than on the adjacent area where sheep had not been previously grazed. Implications of these findings are that quality of deer diets was not detrimentally affected where sheep had grazed during the preceding spring and a much greater animal yield is possible through dual use.
A deficit of winter forage apparently limits mule deer (Odocoileus hemionus hemionus) population over much of their range (Aldous 1945; Doman and Rasmussen 1944). This can be viewed in terms of both extent of winter rangeland and quantity
of forage (principally shrubs) produced there. The Utah
Division of Wildlife Resources estimates that there are approxi- mately 7,424,OOO ha of mule deer winter range in Utah,
including some 1,149,OOO ha dominated by the sagebrush
complex, primarily big sagebrush (Artemisia tridentatu). How- ever, big sagebrush is viewed as only moderate quality winter forage for deer because of its low acceptability (Smith and Hubbard 1954). This is a particular problem where sagebrush exists in stands devoid of more palatable shrub species. Winter deer losses in Utah appear to be inversely related to the amount of palatable browse species available (Robinette et al. 1952). The grazing of deer winter ranges by domestic livestock is common throughout the Inter-mountain West. Such ranges are grazed in spring when forage is typically in short supply for the livestock industry. Hence, the generally low state of produc- tivity of these ranges is viewed as a limitation to livestock production (Cook and Harris 1968) as well as to deer pro- duction.
Recent research indicates that with properly designed grazing strategies, livestock-big game competition can probably be minimized (Jensen et al. 1972; Jensen et al. 1976). Moreover, these same studies suggest that livestock may be used to manipulate vegetation on deer winter ranges to effectively
iv,
Authors were research assistant, associate professor, and research assistant, respective- Department of Range Science, Utah State University, Logan 84322.
Smith and Fulgham are now, respectively, assistant professor of animal science, Angelo State Univentty, San Angelo, Texas 76901, and assistant professor of animal and range sciences, New Mexico State University, Las Cruces 88003.
This report is Journal Paper NO. 2249 of the Utah Agricultural Experiment Station, the supporting institution for this research. Authors also acknowledge the Utah Division of Wildlife Resources (UDWR) for providing the study site, the experimental animals, and logistic support. Charles H. Jensen, game biologist, UDWR, assisted in site selection and study design. Dr. Charles Romesburg and Mr. Kim Marshall, US/IBP Desert Biome Project, were both especially helpful in the data analysis phase of the project.
Manuscript received November 14, 1977.
40
increase quantities of browse available to wintering deer. However, the specific responses of mule deer to such grazing systems have not been well established. Thus, the study reported in this paper was designed to determine: (1) the plant species present and available to wintering mule deer following spring-time sheep grazing and (2) the relative proportions of the various plant species in the diets of mule deer during the winter following the spring sheep grazing treatment.
Methods
The study was conducted at Hardware Ranch, Cache County, Utah, on an area similar in physiography and vegetation to
much
of the northern Utah and southern Idaho deer winter range. The area has southerly and southeasterly slopes supporting a mixed shrub-forb- grass plant community codominated by antelope bitterbrush (Purshiatridentatu) and big sagebrush (Artemisia tridentutu subsp. trident&z).
Two additional sagebrush species (A. tridentutu subsp. vuseyunu) and low sagebrush, (A. urbusculu) occur in limited abundance as do snowberry (Symphoricurpos oreophilus), Saskatoon serviceberry
(Amelunchier ulnifoliu), and Douglas rabbitbrush (Chrysothumnus viscidiforus). Herbaceous species of most importance are bluegrasses
(Pou prutensis and P. secundu), Junegrass (Koeleriu cristutu), beard- less bluebunch wheatgrass (Agropyron inerme), and the forbs Pacific aster (Aster chilensis var. udscendens), and mulesear wyethia
(Wyethiu umplexicuulis).
Annual precipitation of the area varies from 46 to 66 cm, with roughly 60% falling as snow. Mid-winter snow accumulations of 40 to 50 cm are not uncommon; but a sustained snow cover is generally not present on the area until late December, and spring thaw bares patches of ground as early as mid-March.
The Hardware Ranch, situated at an elevation of approximately 1,760 m, is generally considered at the upper end of the altitudinal gradient occupied by wintering mule deer in northern Utah. The mid-winter snowpack effectively excludes the area from winter-long occupancy by deer during years of above-average snow fall. However, substantial early winter and late winter grazing use by deer occurs every year. Elk (Cervus cunudensis) winter on the ranch, but a large-scale hay feeding program generally keeps heavy elk concen- trations localized on meadows and peripheral foothills. The ranch had not received livestock grazing for approximately 25 years preceding this study.
Two adjacent 2.4-ha pastures were fenced on an area previously selected for unifomrity of topography and vegetative cover. In late May and early June (1974) one pasture (designated sheep-deer) received 150 sheep-days per ha’ of grazing use over a 20-day period. Previous research on comparable pastures in the vicinity of the study site (Jensen et”a1. 1976) indicated that this time and intensity of grazing by sheep would achieve approximately 70% mean utilization of the current year’s forage crop. Artemisiu species were not included as part of the available forage for sheep, due to their low acceptability in
’ Forage consumed by the average 57-kg ewe and her 1%kg lamb was considered as one sheep-day of grazing use. Similarly, the quantity consumed by the average 57-kg adult doe was considered as one deer day of grazing use. Fawns (average weight=23 kg) were calculated as 0.4 deer units.
spring. A flock of 20 range ewes and their lambs were obtained on loan from a local rancher and were used for the sheep grazing treatment. The other pasture (designated deer-only) was not grazed by sheep. The following winter (1974-1975), five deer (two adult does and three fawns, born the previous June) were placed in each pasture for two 6-week periods. The first (early winter period) extended from early November to mid-December, and the second (late winter period) from mid-March to late April. Total cumulative deer grazing use was 100 deer-days per ha, an amount considered typical of northern Utah winter ranges.
The deer used in this experiment were hand reared on goat’s milk on a feeding schedule similar to that of Reichert (1972). Frequent handling was emphasized during the fawns’ first 2 months of life so that they imprinted on their handlers. Highly tractable animals were essential for making feeding observations in the experimental pas- tures, and the rearing process employed resulted in such animals. Any of the deer could be touched and handled by observers in the field situation.
Vegetation in the experimental pastures was sampled before and after deer grazing by using an electronically powered inclined point frame. The basic sampling unit, one frame of 20 pins, was observed on permanently located 1.0-m” quadrats during each sampling period. Forty-three and 62 randomly located quadrats were sampled in the deer-only and sheep-deer pastures, respectively. Point frame sampling (Warren-Wilson 1963), utilizing an angle of inclination of 32.5” from horizontal, identified species available and provided an index to abundance in both pastures before and after grazing by deer. Abun- dance is expressed here in terms of the mean number of contacts by the inclined point on each plant species and part (i.e., leaves and stems) as the pin traveled through successive 20-cm segments of the 120-cm vertical distance from the bar of the point frame to the soil surface. The vegetation abundance values reported for a species are means of all plant parts averaged over as many of the successive 20-cm strata as the species occupied or as the mean sum of two plant parts (leaves and stems) in the case of current annual growth (CAG), old, live, or dead parts. “All parts” is not a summation of the individual plant part categories but is a value obtained by averaging across part categories (such as stem, current, alive; stem, old, alive; or leaf, current, dead) applicable to a particular species. Values are not directly comparable between species because each species has a unique combination of plant parts and space occupied. CAG is defined as stems and leaves of grasses, forbs, or shrubs that were produced during a particular year’s growing season. Old parts included all leaves and stems that had prevailed for one or more years, and in the case of shrubs, this category included all of the contacts on the plant trunk and smaller branches,
was calculated and served as the experimental unit for statistical analysis. Calculations consisted of multiplying the number of mouth- fuls of each species consumed during a 30-minute daily sampling period for individual deer times the oven dry weight of the hand- plucked mouthful estimate. This gave the weight of forage of each species consumed during the sampling period. The weight of each species consumed divided by the sum of weights for all species yielded the proportion of the diet belonging to each species consumed during the 30-minute daily sampling period for each of the four deer sampled in each pasture. These procedures are adaptation of the methods of Reppert ( 1960) and Neff ( 1974). Neff ( 1974) discussed at some length the confidence to be placed in hand-plucked samples of deer diet components and the use of hand-reared deer. This method is similar to that described by Free et al. (197 1) except that the mouthful is a composite of several bites, the number depending on the individual deer and the plant species. The strong tendency of deer to graze on one plant species at a time facilitated using this adaptation of the bite-count method.
Data were analyzed statistically by analysis of variance, using least squares procedures (Draper and Smith 1966). The components of the fixed model for diets were treatments (sheep-deer and deer-only), winter periods (early and late), and weeks (four within each period). Fixed model components for vegetation analysis were treatments (sheep-deer and deer-only) and time of measurement (before and after deer grazing). The vegetation experimental unit was number of pin hits on a plant part category of a species.
Vegetation
Results
Big sagebrush, bitterbrush, and bluegrasses (the aggregate of Poa pratensis and P. secunda) were the most abundant plant species growing on the study area (Jensen unpubl. data). Although we attempted to select the two pastures for uniformity of vegetal cover as well as physiographic features, appreciable differences were subsequently found in abundance of several shrub species. Considering that data in Table 1 are treatment means reflecting the combined effects of possible site dif- ferences, spring-time sheep grazing, and two winter periods of deer grazing, direct attribution of differences in shrub abun- dance to specific sources of variation is not uniformly possible. However, several strong inferences are possible. For example, big sagebrush was 77% more abundant in the sheep-deer pasture than in the deer-only pasture, while all bitterbrush was 59%
except current year’s twigs. Dead parts were attached to the parent
plant. Litter was defined as all unattached ground cover of plant Table 1. Forage available to deer in two grazing regimes. Tabular values origin.
are mean numbers of point contacts per quadrat, averaged over October (before deer grazing) and May (after deer grazing) inventories. Dietary composition sampling consisted of ocular observations on
four deer (two adults and two fawns) in each pasture. The fifth deer was maintained in each pasture to achieve the specified level of
Grazing regime
Standard
grazing use and was excluded from dietary observations. Each of the Plant species and parts Sheep and deer Deer only error four were observed for one 30-minute period of actual grazing time
daily for 4 consecutive days during the middle 4 weeks of the two Big sagebrush 0. 19a3 0.1 lb3 0.01 grazing periods. Each deer was observed at a different time on
All parts’
successive days during a 4-day period. An observer counted the Bitterbmsh
number of mouthfuls of each plant species and part consumed during All parts’ O.lOa 0:18b 0.01 the 30 minutes of daily grazing, and immediately following the Current year’s parts* 0.05 0.05 0.01 observation, he hand-plucked representative mouthfuls of each Old live parts* 0.21a 0.35b 0.03 species selected during that sampling interval for an estimate of
mouthful weight. A mouthful was defined as the amount of forage for Bluegrasses
a particular species taken into the mouth between acts of swallowing. All parts’ 0.09a 0.24b 0.03 The slight, but obvious, contraction of throat muscles was the Live parts* 0.12 0.15 0.03 observer’s visual cue to swallowing. Size of mouthfuls varied widely Standing dead parts* 0.1
la 0.41b 0.04
among different plant species but appeared to be relatively uniform for Litter 9.71 9.32 0.50 a particular species. Observations were conducted simultaneously by a
separate observer in each pasture. Plucked samples were oven dried ’ Values are quadrat means for each plant part occurring in all strata considered and weighed. The percent contribution of each species to the total 2 Values are quadrat means of the sum of leaves and stems in all strata considered. mass of plant material consumed during a 30-minute grazing period
” For a particular plant species or plant part means followed by different letter suffixes are significantly (P<O.Ol) different.
more abundant in the deer-only pasture. Although no specific observations were made on diet selection by sheep during the spring grazing treatment, big sagebrush was not consumed by sheep in a previous study (Iskander 1973) on an adjacent site. Neither did deer consume big sagebrush in the present study.
Thus, pretreatment differences between pastures were un-
doubtedly the major contributor to differences noted for that species. Both sheep and deer consumed bitterbrush, but the remarkably larger quantity of old live parts in the deer-only pasture (Table 1) suggests that pretreatment differences be- tween pastures also played an important role for that species. Spring-time sheep grazing may have had the effect of increasing
the proportion of CAG on bitterbrush, however. CAG on
bitterbrush was 24% of old live parts in the sheep-deer pastures and only 14% in the deer-only pasture (Table 1). The uniformity of climatic and soil conditions on the two pastures seems to eliminate other possible causes for this difference. This supports earlier findings by Jensen et al. ( 1972) and Smith and Doe11 (1968) who suggested that regulated livestock grazing during spring can have favorable effects on subsequent shrub pro- duction, primarily through suppression of competition from herbaceous understory plants. The least favorable interpretation is the habitat quality for deer is not diminished by -regulated sheep grazing and that a greater proportion of the total plant community can be utilized. Jensen et al. (1976) found that heavy intense sheep grazing as used in this study may favor an increase in shrubs.
The removal of herbaceous plant material by sheep was indicated by the lesser amounts of bluegrasses present in the sheep-deer pasture. All bluegrass material was only 39% as abundant in the sheep-deer pasture as in the deer-only pasture (Table 1). Although live parts were about equally abundant in both pastures, dead leaves and stems were only 28% as abundant in the sheep-deer pasture as in the deer-only pasture. The ratio of live bluegrass parts to dead parts was 106% in the sheep-deer pastures and 37% in the deer-only pasture (Table 1). Grass plants in the sheep-deer pasture were characterized by short, dense tufts of new leaf material in comparison to those in the deer-only pasture that had few, but long and flexuous leaves dispersed through a sward of standing dead herbaceous material approximately 5-20 cm deep.
Temporal changes in plant material that occurred during the two deer-grazing periods (Table 2) were due to consumption and trampling by deer, breakage of snaw cover, and beginning
Table 2. Temporal changes in the forage resource during winter. The interval between measurements included six weeks of early winter deer grazing, 12 weeks of no grazing but heavy snow cover, and six additional weeks of late winter deer grazing. Tabular values are mean numbers of point contacts per quadrat, averaged over both grazing regimes.
Time of measurement
Species
October 1974 May 1975 (before deer (after deer grazing) grazing)
Standard error
Big sagebrush
All parts’ 0.16 0.14 0.01
Bitterbrush All parts’ Current part? Old live parts*
0.17a2 0.1 lb3 0.01 0.08a 0.02b 0.01
0.32 0.24, 0.01
Bluegrass
All parts’ 0.29a 0.05b 0.02
Live parts* 0.18a 0.09b 0.03
Standing dead parts* 0.52a O.OOb 0.04
Litter 9.93 9.09 0.50
I Values are quadrat means for each plant part occurring in all strata considered. z Values arc quadrat means of sum of leaves and stems in all strata considered. J For a particular plant species or plant part, means followed by different letter suffixes are
significantly (P~0.01) different.
of spring growth. Lack of control area, free from deer or other grazing effects, precluded quantification of grazing removal of plant material. However, the disappearance of 75% of bitter- brush CAG during the course of the winter (Table 2) should be largely attributable to deer grazing. Old live bitterbrush parts were 25% less abundant at the end of the winter due to deer use and breakage while grasses were 83% less abundant than prior to deer grazing. The effect of the snowpack in layering herbaceous material is evident in the reduction of bluegrass dead parts from 0.52 to 0.0 contacts per quadrat over the winter period (Table 2).
Diets
Treatment Effects
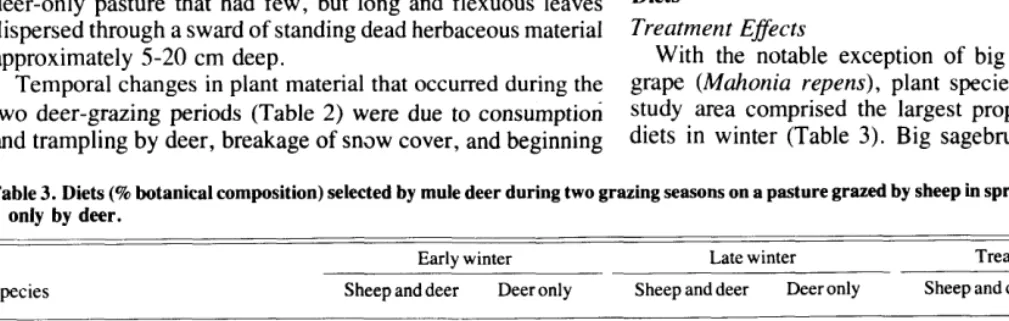
With the notable exception of big sagebrush and Oregon grape (Mahonia repens), plant species most common on the study area comprised the largest proportions of mule deer’s diets in winter (Table 3). Big sagebrush, highly abundant in
Table 3. Diets (9’0 botanical composition) selected by mule deer during two grazing seasons on a pasture grazed by sheep in spring and on a pasture grazed only by deer.
Early winter Late winter
Species Sheep and deer Deer only Sheep and deer Deer only
All shrubs 43. la’ 52.0b’ 65.5 65.6
All bitterbrush 27.8a 42.0b 49.5 55.5
Current bitterbrush 27.8 33.1 32.9a’ 26.7b’
Old bitterbrush 0.6a 8.9b 16.6a 28.8b
Oregon grape 9.0 8.0 9.3a 5.4b
Low sagebrush 2.7 1.1 5.5a 2.2b
Miscellaneous shrubs 3.5a 0.9b 1.2a 2.5b
All herbaceous 56.9a 48.0b 34.4 34.4
Green grasses 39.2a 32.4b 26.5 25.0
All forbs 17.7 15.6 7.9 9.4
Pacific aster 4.8 5.9 0.8 1.2
Mulesear wyethia 6.3 4.7 0.4a 4.3b
Miscellaneous forbs 6.7 5.2 6.7 3.9
’ Within a particular grazing season, treatment means followed by different letter suffixes are significantly (PcO. IO) different. ’ Treatment means differing significantly (P<O. 10) between grazing treatments are noted by different letter suffixes.
Treatment means
Sheep and deer Deer only
54.3 58.8
38.7a2 48.86’
30.4 29.9
8.3a 18.9b
9.2a 6.7b
4. la 1.7b
2.3 1.7
45.7 41.2
32.9 28.7
12.8 12.5
2.8 3.5
3.3 4.5
6.7a 4.5b
both pastures, received no measurable dietary use, whereas the _ bitterbrush in that pasture (Table 1). The cumulative effect of infrequently occurring Oregon grape, not found in any vegeta- these dietary differences would appear to be an increase in the tion sample quadrat, was consumed in significant amounts. nutritive quality of mule deer’s diet in the sheep-deer pasture Smith (1950) found big sagebrush to be only moderately over those in the deer-only pasture. Short et al. (1972) have acceptable to deer, yet he maintained that it is an important demonstrated the higher nutritional quality (digestibility, pro- forage species in the Intermountain region, particularly on tein content) of current year’s twigs as compared to l-year-old ranges where other browse species are absent or have been fully and older twig material. However, preliminary data on the utilized. The lack of use of big sagebrush as food in the present nutritional quality of diets consumed by deer in the two pastures study is probably explained by the relative abundance of other, (Fulgham et al. 1977) indicate that the relationships were more palatable forage species. However, dietary selection of complex. Dietary crude protein averaged about 2% higher in the plant species having high concentrations of secondary com- deer-only pasture during the early winter period, while diges- pounds (e.g., terpenes in sagebrush) is a complex and poorly tible energy content and in vitro digestibility of diets were understood process. For example, Smith and Hubbard (1954) numerically, although not significantly, higher in the sheep- observed yearly variation in consumption of big sagebrush by deer pasture.
penned deer ranging from complete rejection one year to In the late winter, consumption of herbaceous species was
moderate consumption the next. less influenced by previous sheep grazing than by phenological
We cannot completely discount that our deer were reared changes. An exception was mulesear wyethia, which did not under artificial circumstances and were not exposed to a wide begin growth while deer were in the pastures during the late array of native plant species prior to the grazing trials. Early winter grazing period. However, appreciable quantities of the experience or food imprinting has been found important in such forb’s large dry leaves had remained on the ground from the monogastric species as wild and domesticated rats (Galef and P revious year’s growing season in the deer-only pasture. Deer Clark, 197 1). Arnold and Maller (1977) recently demonstrated consumed these dead leaves soon after snow-melt. Both avail- the importance of nutritional experience upon subsequent food ability and consumption of mulesear wyethia were lower in the selection in adult sheep. Unfortunately, our experimental sheep-deer pasture during late winter (Table 3) because of prior design did not provide opportunities for evaluating the impor- use of the species by sheep. Consumption of all herbaceous
tance of such relationships in deer. species, in aggregate, did not differ between pastures.
Bitterbrush and grasses (principally Kentucky and Sandberg Shrub content of diets in late winter was similar in both bluegrass) were consistently greatest in dietary importance,
comprking in aggregate at least 67% of the diets. Other plant
pastures but individual species categories were different (Table 3). More old bitterbrush was selected in the deer-only pasture. species and species categories, including Oregon grape, low This difference probably indicates the combined effects of
sagebrush, miscekwous shhs, Pacific aster, mulesear declining availability of bitterbrush CAG due to greater con-
wyethia, and miscellaneous forbs were variably important sumption in the early winter and the greater percentage of old (Table 3). The relationship of all bitterbrush and low sagebrush
consumption between the two grazing regimes was similar to
bitterbrush there initially (Table 1). Bitterbrush CAG con-
the relationship of amounts available. The deer-only pasture had
sumption was slightly greater in late winter in the sheep-deer pasture. Oregon grape and low sagebrush were also used to more bitterbrush and less low sagebrush available than did the greater extent in the sheep-deer pasture. These dietary
sheep-deer pasture. differences suggest, as did those for early winter, that dietary
The major dietary difference between grazing regimes in- quality for mule deer was probably greater in the sheep-deer
volved the greater quantity of grasses and markedly more Pasture than that in the deer-only pasture. Preliminary
herbaceous species consumed by deer during early winter in the nutritional data (Fulgham et al. 1977) conditionally confirm this sheep-deer pasture than in the deer-only pasture (Table 3) even hypothesis. Averaged over the late winter period, dietary crude though equal amounts of bitterbrush CAG were available in protein, digestible energy, and in vitro digestibility were all both pastures. These differences are probably attributable to the slightly higher in the sheep-deer pasture.
smaller quantity of standing dead grass material in the sheep- deer pasture (Table 1). Heavy spring grazing by sheep had
Temporal Efsects
effectively utilized or layered the grass sward that would have Reduction in forage availability due to deer use and snow otherwise accumulated during the early summer growing sea- cover, and changes in plant phenology seemed to account for the son. Thus, the absence of standing dead herbaceous material in general trends in plant species present in mule deer diets through th the sheep-deer pasture had the important effect of making forbs, e winter. Considering the two treatments as a whole, shrubs low growing shrubs (e.g., Oregon grape), and the new green were generally more important than other species in late winter leaf material resulting from autumn regrowth of the cool-
primarily because snow cover (about 25 cm and 20 cm during
seasonal bluegrasses more accessible to deer in early winter.
weeks 1 and 2, respectively) limited availability of herbaceous
Arnold ( 1964) suggested that tall grasses reduced consumption
species during the first half of the period (Table 4). Forbs and
of low growing clover by sheep in Phalaris-annual grass-clover
grasses declined from an average of 53% in early winter to 34%
pasture. Other directly pertinent work recently qmed by
in late winter, while shrub use increased from 48% in early
McLean and Willms (1977) showed that fall grazing by cattle
winter to 66% in late winter. During the early winter when snow
removed mature stalks of bluebunch wheatgrass making new
cover was not a factor, shrubs (principally bitterbrush) in diets
grass more accessible to deer in spring. Thus livestock grazing
increased from about 40% in weeks 1 and 2 to approximately
ca.n delay the time when deer must depend on sh.h as the
55% in weeks 3 and 4, while dietary forbs declined from 22%
source of forage.
and 27% in weeks 1 and 2, respectively, to 7% in week 4. This
The greater quantity of old (from previous growing seasons>
shift apparently resulted from a reduction in forb availability
bitter-brush consumed in the deer-only pasture (Table 3) pro-
due to consumption. Green grasses consistently comprised
bably reflects the smaller proportion of bitterbrush CAG to old
about one-third of the diet throughout the early winter period (Table 4).
Table 4. Diets (5% botanical composition) selected by mule deer during early and late winter grazing periods.
Early winter weeks Late winter weeks Means
Species 1 2 3 4 1 2 3 4 Early Late
winter winter
All shrubs 39.5a’ 39.4a 57.4b 53.8b 78.2a’ 69.8b 72.0ab 42.4 47.5a2 65.6b’
All bitterbrush 30.1 29.7 38.7 41.2 61.5a 59.5a 57.0a 32. lb 34.9a 52.5b
Current bitterbrush 30. la 29.7a 38.7b 23.4a 38. la 38.3a 31.9a 10.9b 30.5 29.8
Old bitterbrush O.Oa O.Oa O.Oa 17.8b 23.4 21.2 25.1 21.9 4.4a 22.7b
Oregon grape 7.1 5.6 12.2 9.1 ll.Oa 8.3a 7.7a 2.3b 8.5 7.4
Low sagebrush O.Oa I.la 4.7b 2.0a 0.8a 1.2a 5.5b 7.9b 1.9a 3.9b
Miscellaneous shrubs 2.4 3.0 1.9 1.5 4.8a 0.7b 1.8b O.Ob 2.2 1.8
All herbaceous 60.5a 60.6a 42.6b 46.2b 21.8a 30.2b 27.9ab 57.6~ 52.5a 34.4b
Green grasses 38.8 32.9 32.2 39.2 19.9a 24.0a 20.9a 38. lb 35.8a 25.8b
All forbs 21.6a 27.7b 10.3c 7.oc 1.9a 6.2b 7.0b 17.4c 16.7a 8.6b
Pacific aster 10.8a 7.7b 1.4c 1.5c O.Oa O.Oa 0.5a 3.4b 5.3a l.Ob
Mulesear wyethia 4.7a lI.lb 3.5ac 2.5~ 1.3a 5.3b 2.2a 0.5a 5.5a 2.3b
Miscellaneous forbs 6. lab 8.9a 5.4b 3.0b 0.6a 0.9a 4.4b 15.4c 5.8 5.3
’ Within a particular grazing season. weekly means for a dietary component are significantly (P<O.O5) different if followed by different letter suffixes. ’ Seasonal means differing significantly (F~0.05) are denoted by different letter suffixe
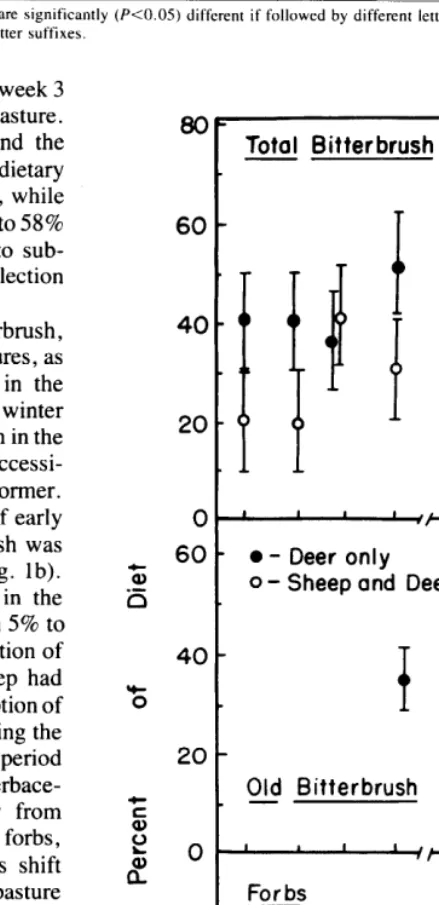
In late winter, snow melt was essentially complete by week 3 in the sheep-deer pasture and by week 4 in the deer-only pasture. Corresponding to the departure of the snow cover and the beginning of growth in cool season grasses and forbs, dietary shrubs declined from 78% in week 1 to 42% in week-4, while use of herbaceous species increased from 2 1% in week 1 to 58% in week 4 (Table 4). Continuation of observations into sub- sequent weeks would likely have shown even greater selection of green grass and emergent forbs.
Three dietary components, all bitterbrush, old bitterbrush, and all forbs, did not follow the same trends in both pastures, as indicated by significant season X week interactions in the analysis of variance. Bitterbrush consumption in early winter began at much lower levels in the sheep-deer pasture than in the deer-only pasture (Fig. la), probably due to the greater accessi- bility of the apparently preferred grass regrowth in the former. Consumption of old bitterbrush began during week 4 of early winter in the deer-only pasture, while no old bitterbrush was consumed in the sheep-deer pasture until late winter (Fig. lb). This dietary component remained consistently lower in the sheep-deer pasture throughout late winter, varying from 5% to 35% lower, apparently in response to the greater proportion of bitterbrush CAG to old bitterbrush present where sheep had grazed in spring. The relatively high and similar consumption of all bitterbrush (about 60% of diets) in both pastures during the first 2 weeks of late winter (Fig. la) corresponded to a period when snow cover severely limited the availability of all herbace- ous species. Animals in both pastures shifted away from bitterbrush and toward herbaceous species, particularly forbs, during the latter weeks of late winter. However, this shift occurred approximately 1 week earlier in the sheep-deer pasture (Fig. 1 a). As mentioned above, snow cover persisted approxi- mately 1 week longer in the deer-only pasture than in the sheep-deer pasture. A possible explanation of this difference is that the relatively deep layer of standing dead herbaceous material in the deer-only pasture presented an insulating effect, thus delaying soil warming (Geiger 1965). The major diver- gence in dietary forb use in the two pastures occurred during week 2 of late winter when animals in the deer-only pasture consumed appreciable quantities (10% of the diet) of the dry leaves of mulesear wyethia (Fig. lc). This species had been partially consumed by sheep in the other pasture and was unavailable there because of snow cover. In the deer-only pasture, deer use in early winter had not reduced the stature of
80
60
40
20
0
60 ‘3 -5
40
S
20
c S 2
8f 0
40
20
0
Bitterbrush
a.
--
l - Deer only 0 - Sheep and Deer
b .
Old Bitterbrush
For bs
I 2 3 4” I 2 3 4
Early Winter Weeks Late Winter Weeks
Fig. 1. Trends of three forage components in diets selected by deer during early and late winter periods. Vertical bars represent 95% confidence intervals.
the tall plants and they remained partially uncovered and available for consumption. However, by week 4 forb use in the sheep-deer pasture had greatly exceeded that in the deer-only pasture.
Summary and Conclusions
Mule deer grazing in the winter in a pasture grazed by sheep the previous spring selected a diet containing more herbaceous plant material and less shrub material than did deer in a similar
pasture not grazed by sheep. Fulgham (1978) in a study
concurrent with this found no large differences in overall nutritive quality of forage ingested by deer between the two treatments. These findings indicate that sheep grazing at the time and intensity used in this study will not detrimentally affect mule deer winter ranges in northern Utah. Moreover, the total stocking rate of the sheep-deer pasture (100 deer-da/ha + 150 sheep-da/ha) was more than 2X that of the deer-only pasture
( 100 deer-da/ha), indicating the potential for increased animal production per unit of land under dual-use grazing. We can offer no firm evidence on the length of time such relationships might persist without marked changes in the plant community struc- ture necessitating changes in the grazing program. This facet is presently being pursued in a related longer-term study (Jensen et al. 1976). However, preliminary information based on 4 years of spring sheep grazing does not suggest major successional changes that would have a direct bearing on food species important to wintering mule deer (Jensen, upubl. data).
Seasonal dietary changes indicated that wintering mule deer will select green grass and some cured forbs as long as they are available in preference to shrubs, although shrubs (primarily bitterbrush) were always the largest single component of diets.
Major dietary components in order of importance by weight were bitterbrush 42%, green grasses 30%, Oregon grape 8%, miscellaneous forbs, 6%, mulesear wyethia 4%) low sagebrush
3%, Pacific aster 3%, and miscellaneous shrubs 2%. Big
sagebrush, the co-dominant shrub on the site was totally rejected by deer as a food item probably because of the abundance of other more palatable forages.
Literature Cited
Aldous, C.M. 1945. A winter study of mule deer in Nevada. J. Wildl. Manage. 9: 145-15 1.
Arnold, G.W. 1964. Factors within plant associations affecting the behavior and performance of grazing animals. p. 133-154. In: D.J. Crisp, ed. Grazing in Terrestrial and Marine Environments. Blackwell Sci. Publ., London.
Arnold, G.W., and R.A. Mailer. 1977. Effects of nutritional experience in early and adult life on the performance and dietary habits of sheep. App. Anim. Ethol. 35-26.
Cook, C.W., and L.E. Harris. 1968. Nutritive value of seasonal ranges. Utah Agr. Exp. Sta. Bull. 472. 55 p.
Doman, E.R., and D.I. Rasmussen. 1944. Supplemental feeding of mule deer in northern Utah. J. Wild]. Manage. 8:317-338.
Draper, N.R., and H. Smith. 1966. Applied Regression Analysis. John Wiley and Sons, Inc., New York. 407 p.
Free, J.C., P.L. Sims, and R.M. Hansen. 1971. Methods of estimating dry- weight composition in diets of steers. J. Anim. Sci. 32:1003-1007.
Fulgham, K.O. 1978. Influence of spring sheep grazing on the forage intake and quality of diets consumed by pen-reared mule deer under winter range conditions. PhD Diss., Utah State Univ. Logan. 138 p.
Fuigham, K.O., J.C. Maiechek, and M.A. Smith 1977. Forage quality of a deer winter range grazed by sheep in spring. Proc. 30th Annual Meeting, Sot. Range Manage., Portland, Ore. p. 56 (abstract).
Galef, B.G., Jr., and M.M. Clark. 1971. Social factors in poison avoidance and feeding behavior of wild and domesticated rat pups. J. Comp. Physiol. Psychol. 75:341-343.
Geiger, R. 1%5. The Climate near the Ground. Harvard Univ. Press, Cambridge, Mass. 611 p.
Iskander, F.D. 1973. Factors affecting feeding habits of sheep grazing foothill ranges of northern Utah. PhD. Diss., Utah State University, Logan. 72 p.
Jensen, C.H., A.D. Smith, and G.W. Scatter. 1972. Guidelines for grazing sheep on rangelands used by big game in winter. J. Range Manage. 251346-352.
Jensen, C.H., P.J. Urness, and A.D. Smith. 1976. Productivity of big game winter forage can be enhanced by grazing with domestic sheep. Proc. 29th Annual Meeting, Sot. Range Manage., Omaha, Nebraska. p. 17 (abstract).
McLean, A., and W. Wilhns. 1977. Cattle and deer feeding habits on winter range in southern British Columbia. Proc. 30th Annual Meeting, Sot. Range Manage., Portland Ore. p. 56 (abstract).
Neff, D.J. 1974. Forage preference of trained mule deer on the Beaver Creek watersheds. Arizona Game Fish Dep. Spec. Rep. No. 4. 61 p.
Reichert, D.W. 1972. Rearing and training deer for food habits studies. U.S. Dep. Agr. Forest Serv., Rocky Mountain Forest and Range Exp. Sta. Res. Note RM 208. 7 p.
Reppert, J.N. 1960. Forage preference and grazing habits of cattle at the eastern Colorado range station. J. Range Manage. 13:48-65.
Robinette, W.L., 0. Juiander, J.S. Gaswiler, and J.G. Smith. 1952.
Winter mortality of mule deer in Utah in relation to range condition. J. Wildl. Manage. 16:289-299.
Short, H.L., R.M. Blair, and L. Burkart. 1972. Factors affecting nutritive values. p. 3 1 l-3 18. In: C.M. McKell, J.P. Blaisdell, and J.R. Goodin, eds. Wildland Shrubs-Their Biology and Utilization. U.S. Dep. Agr. Forest Serv. Intermountain Forest and Range Exp. Sta. General Tech. Rep. INT- 1, 1972.
Smith, A.D. 1950. Sagebrush as winter feed for deer. J. Wildl. Manage. 14:285-289.
Smith, A.D., and D. Doell. 1968. Guides to allocating forage between cattle and big game on big game winter range. Utah State Div. Fish and Game Pub. No. 68-l 1. 32 p.
Smith, A.D., and R.L. Hubbard. 1954. Preference ratings for winter deer forages from nothem Utah ranges based on browsing time and forage consumed. J. Range Manage. 7:262-265.
Warren-Wilson, J. 1963. Estimation of foliage denseness and foliage angle by inclined point quadrats. Aust. J. Bot. 11:95-105.