Telescope Array Hybrid Composition and Auger-TA Composition Comparison
WilliamHanlon1,∗for the Telescope Array Project
1University of Utah Dept. of Physics and Astronomy & High Energy Astrophysics Institute, 201 James Fletcher Bldg., 115 S 1400 E,
Salt Lake City, UT 84112, USA
Abstract.Telescope Array (TA) has completed analysis of nearly nine years of data measuring the atmospheric
depth of air shower maximum (Xmax) utilizing the TA surface detector array and the Black Rock Mesa and Long
Ridge fluorescence detector stations. By using both the surface array and the fluorescence detector, the geometry
and arrival time of air showers can be measured very precisely providing good resolution in determiningXmax.
Xmax is directly related to the air shower primary particle mass and is therefore important for understanding
the composition of ultra high energy cosmic rays (UHECRs). UHECR composition will help answer questions such as the distance and location of their sources. We discuss the experimental apparatus, analysis method, and
Xmax data collected. We compare the energy dependent distributions of the observed data to detailed Monte
Carlo simulations of four chemical species, then test which individual species are not compatible with the data through an analysis of the shapes of the distributions. We also discuss the present state of composition analysis and interpretation between the Auger and TA experiments. These are the two largest UHECR observatories in the world with large exposures and should shed light on UHECR composition.
1 Introduction
Ultra high energy cosmic ray (UHECR) mass composi-tion remains a tantalizing source of inquiry even in the era of very large exposure detectors. Deeper understanding of the composition of UHECRs will shed light on which models of propagation and sources are viable. Because flux in the UHECR regime is low (J(E) ≈ 3 ×10⁻³¹
eV−1m−2s−1sr−1) and is quickly falling with energy,
com-position cannot be directly measured on an event-by-event basis. Large detectors placed on the surface of the Earth, observing the resultantN2fluorescence of air shower
cas-cades produced by inelastic collisions of UHECR pri-maries and air are utilized instead. Observation of the depth of first interaction could be used to infer average pri-mary particle mass given a large enough statistical sample, since this distribution is dependent upon the cross section with air which is related to particle mass. This method too is impractical due to the large distances between interac-tion depth and detector, low signal-to noise ratio, and rela-tively small detector acceptance. Air showers grow in size as a function of longitudinal depth, which is measured in g/cm2, until the average energy per secondary particle falls below some critical energy. This depth is calledXmaxand
is observable out to several tens of kilometers by current fluorescence detectors (FDs) in use today [1, 2].
Given an ensemble of primaries of a single chemical element with varying energy, the meanXmax,Xmax, in an
energy bin is an increasing function of the logarithm of pri-mary energy, called the elongation rate, and it is inversely proportional to the logarithm of the primary particle mass:
∗e-mail: [email protected]
Xmax ∝ Dln(E/A), whereDis the elongation rate,E is
the energy of the primary particle, andAis the mass num-ber of the primary. Mixtures of primary elements have
Xmax ∝ lnA[3, 4]. The width of a distribution ofXmax,
σ(Xmax), in an energy bin is also related to the primary
par-ticle mass. Intuitively we can guess this result if we con-sider a nucleus of mass numberAand primary energyE, as a superposition ofAnucleons with average energyE/A.
This is reasonable in the limit of ultra high energies be-cause the collision energy is much larger than the binding energy per nucleon. Hadronic induced showers are more complicated due to effects of elasticity and multiplicity, so
σ(Xmax) is larger than the naive approximation. For single
elements it is found thatσ(Xmax) of theXmaxdistribution
in an energy bin decreases with increasing primary mass. For mixtures of elementsσ(Xmax)2∝D2(
ln2A−lnA2),
or σ(Xmax)2 is proportional to the variance of lnA. With
these relations among Xmax andσ(Xmax), we can
simu-late the UHECR flux arriving at a detector and compare the Xmaxdistributions, Xmax, andσ(Xmax) expected
accord-ing to detector exposure to that observed in data. Hadronic air showers are complicated due to unknown parameters such as cross section, multiplicity, and elasticity for ener-gies above those that can be recreated in the controlled experiments such colliders. Therefore hadronic models play an important role and are an important contribution to systematic uncertainty in understanding UHECR com-position. Model uncertainties will be discussed further in section 2.
Xmax is not observed by surface detectors (SDs), so,
progressing in TA and Auger through seeking to exploit the relationship between primary particle mass and the muon production in UHECR air showers [5, 6]. Muons produced in UHECR induced air showers are likely to sur-vive to ground level and primaries of larger mass number produce more muons. This information can potentially be used to measure the primary mass composition on an event-by-event basis. One large advantage of this method is that SD arrays have 100% duty cycle and run continu-ously, while FDs run only on clear, moonless nights pro-viding only a 10% duty cycle. Good sensitivity to muons and accurate hadronic models are required to do this. In particular it is now known that there are large discrep-ancies between model predictions of UHECR air shower muon flux on the ground and that predicted by the most recent hadronic models. TA and Auger each measure an excess of muons on the ground versus that predicted by QGSJet II and EPOS hadronic models [7, 8]. TA has measured lnAusing nine years of SD data and a mul-tivariate analysis technique up to E = 1020 eV, finding
lnA=1.52±0.08 [6].
This paper will describe the most recent, highest statis-tics measurement ofXmaxby Telescope Array in section 2.
Section 3 will describe Xmax measurements of the two
largest UHECR observatories and methods required to compare their results. Section 4 will summarize the de-tails reported in this work.
2 Telescope Array
X
maxResults
Telescope Array is the largest cosmic ray observatory in the Northern Hemisphere, covering∼700 km2in Millard
County, Utah (39.3◦ N, 112.9◦ W, 1400 m asl). Placed
within this area are 507 plastic scintillation surface detec-tors and three fluorescence detector stations. Each surface detector is 3 m2 in area and holds two layers of plastic
scintillator 1.25 cm thick. Each layer has 104 wavelength shifting fiber optic cables embedded in them, optically coupled to a PMT. Each SD contains FADC electronics modules to digitize signals from the PMTs, GPS modules to record times, and radio communications equipment to allow communication with one of three radio towers that monitor the SDs and runs regular diagnostics. When an SD records a low level trigger, which is simply some sig-nal above threshold, they communicate this information to the radio towers which scan multiple low level triggers oc-curring nearly coincident in time. When the requirements for an event level trigger are met, the radio tower broad-casts for a readout of the neighboring SDs and stores the data for offline analysis [9].
The three FD stations are located to the north (Mid-dle Drum), southwest (Long Ridge), and southeast (Black Rock) of the boundary of the SD array, each pointing to-wards the array center. The Middle Drum FD station em-ploys 14 FD telescopes repurposed from the HiRes exper-iment [10]. The Black Rock (BR) and Long Ridge (LR) FD stations were newly constructed for the TA experiment. Each of these new FD stations utilize 12 telescopes, con-sisting of a 6.8m2mirror, focusing light onto a
photomul-tiplier tube (PMT) cluster box containing 256 PMTs
ar-ranged in a 16x16 packed hexagonal array, and data ac-quisition (DAQ) hardware which includes FADC readout electronics, pattern recognition modules, and communica-tions hardware to communicate with a central trigger dis-tributor which directs readout and storage of data of all telescope DAQs when the condition for an event trigger is met [11, 12]. The twelve mirrors are arranged in a two ring configuration, with six mirrors in ring 1 observing between 3◦ - 18◦ in elevation, and six mirrors in ring 2 observing
between 18◦- 33◦. Total azimuthal coverage is 108◦.
Xmaxdata is collected in hybrid mode by searching for
time coincident events in the SD and FD data streams. Hybrid event observation allows for more accurate recon-struction of the shower track in the sky because it com-bines the FD observation of the shower along with the tim-ing and geometry information of the SD. By ustim-ing the SD timing and geometry, the shower angle (ψ) in the
shower-detector plane is very well constrained, allowing for a very accurate measurement ofXmax. Monocular reconstruction
of showers has poorXmaxresolution compared to hybrid
and stereo FD reconstruction methods. Multi-FD recon-struction of events also offers very good Xmaxresolution, about the same as for hybrid reconstruction, but the ac-ceptance of stereo events in TA is lower forE <1019eV
due to the large distance between FD stations. Hybrid re-construction provides the largest statistics study ofXmaxin
TA.
Previously TA has published results of hybridXmax
us-ing the Middle Drum FD station [13]. This present paper describes hybrid Xmax measurements utilizing the Black
Rock and Long Ridge detectors. Black Rock and Long Ridge are “twins” using the same hardware, same elec-tronics, and are similarly placed close to the border of the SD array (3 km and 4 km respectively), therefore they have similar hybrid acceptance. Middle Drum uses smaller mir-rors and is placed about 8 km from the surface array bor-der, giving it a very different acceptance particularly at low energies. Therefore Middle Drum reconstruction is not combined with Black Rock and Long Ridge events for this analysis.
This paper will summarize results of nearly nine years of BR/LR hybridXmax measurements recently published; further details about the analysis and results can be found there [14]. The data examined in this analysis spans the pe-riod 27 May 2008 to 29 November 2016, over which 1500 nights of data were collected. Time matching of BR/LR events and SD events resulted in 17,834 hybrid candidate events. An event only becomes an accepted hybrid event after it passes all quality cuts. Cuts on geometry such as track length cut, shower-detector plane cut, and zenith an-gle cut are used to ensure accurate reconstruction of the shower track. Cuts on fluorescence profileχ2,Xmax
brack-eting, and good weather nights ensure the shower profile is well observed and Xmax is well measured. An energy
cut is also applied to ensure that no events with recon-structed energy below 1018.2 eV are accepted. This cut
is imposed because of rapidly falling acceptance near this energy. After all quality cuts are applied 3330 events re-main as accepted hybrid events for E ≥ 1018.2 eV. To
progressing in TA and Auger through seeking to exploit the relationship between primary particle mass and the muon production in UHECR air showers [5, 6]. Muons produced in UHECR induced air showers are likely to sur-vive to ground level and primaries of larger mass number produce more muons. This information can potentially be used to measure the primary mass composition on an event-by-event basis. One large advantage of this method is that SD arrays have 100% duty cycle and run continu-ously, while FDs run only on clear, moonless nights pro-viding only a 10% duty cycle. Good sensitivity to muons and accurate hadronic models are required to do this. In particular it is now known that there are large discrep-ancies between model predictions of UHECR air shower muon flux on the ground and that predicted by the most recent hadronic models. TA and Auger each measure an excess of muons on the ground versus that predicted by QGSJet II and EPOS hadronic models [7, 8]. TA has measured lnAusing nine years of SD data and a mul-tivariate analysis technique up to E = 1020 eV, finding
lnA=1.52±0.08 [6].
This paper will describe the most recent, highest statis-tics measurement ofXmaxby Telescope Array in section 2.
Section 3 will describe Xmax measurements of the two
largest UHECR observatories and methods required to compare their results. Section 4 will summarize the de-tails reported in this work.
2 Telescope Array
X
maxResults
Telescope Array is the largest cosmic ray observatory in the Northern Hemisphere, covering∼700 km2in Millard
County, Utah (39.3◦ N, 112.9◦ W, 1400 m asl). Placed
within this area are 507 plastic scintillation surface detec-tors and three fluorescence detector stations. Each surface detector is 3 m2 in area and holds two layers of plastic
scintillator 1.25 cm thick. Each layer has 104 wavelength shifting fiber optic cables embedded in them, optically coupled to a PMT. Each SD contains FADC electronics modules to digitize signals from the PMTs, GPS modules to record times, and radio communications equipment to allow communication with one of three radio towers that monitor the SDs and runs regular diagnostics. When an SD records a low level trigger, which is simply some sig-nal above threshold, they communicate this information to the radio towers which scan multiple low level triggers oc-curring nearly coincident in time. When the requirements for an event level trigger are met, the radio tower broad-casts for a readout of the neighboring SDs and stores the data for offline analysis [9].
The three FD stations are located to the north (Mid-dle Drum), southwest (Long Ridge), and southeast (Black Rock) of the boundary of the SD array, each pointing to-wards the array center. The Middle Drum FD station em-ploys 14 FD telescopes repurposed from the HiRes exper-iment [10]. The Black Rock (BR) and Long Ridge (LR) FD stations were newly constructed for the TA experiment. Each of these new FD stations utilize 12 telescopes, con-sisting of a 6.8m2mirror, focusing light onto a
photomul-tiplier tube (PMT) cluster box containing 256 PMTs
ar-ranged in a 16x16 packed hexagonal array, and data ac-quisition (DAQ) hardware which includes FADC readout electronics, pattern recognition modules, and communica-tions hardware to communicate with a central trigger dis-tributor which directs readout and storage of data of all telescope DAQs when the condition for an event trigger is met [11, 12]. The twelve mirrors are arranged in a two ring configuration, with six mirrors in ring 1 observing between 3◦ - 18◦ in elevation, and six mirrors in ring 2 observing
between 18◦- 33◦. Total azimuthal coverage is 108◦.
Xmaxdata is collected in hybrid mode by searching for
time coincident events in the SD and FD data streams. Hybrid event observation allows for more accurate recon-struction of the shower track in the sky because it com-bines the FD observation of the shower along with the tim-ing and geometry information of the SD. By ustim-ing the SD timing and geometry, the shower angle (ψ) in the
shower-detector plane is very well constrained, allowing for a very accurate measurement ofXmax. Monocular reconstruction
of showers has poorXmaxresolution compared to hybrid
and stereo FD reconstruction methods. Multi-FD recon-struction of events also offers very good Xmaxresolution, about the same as for hybrid reconstruction, but the ac-ceptance of stereo events in TA is lower forE <1019 eV
due to the large distance between FD stations. Hybrid re-construction provides the largest statistics study ofXmaxin
TA.
Previously TA has published results of hybridXmax
us-ing the Middle Drum FD station [13]. This present paper describes hybrid Xmax measurements utilizing the Black
Rock and Long Ridge detectors. Black Rock and Long Ridge are “twins” using the same hardware, same elec-tronics, and are similarly placed close to the border of the SD array (3 km and 4 km respectively), therefore they have similar hybrid acceptance. Middle Drum uses smaller mir-rors and is placed about 8 km from the surface array bor-der, giving it a very different acceptance particularly at low energies. Therefore Middle Drum reconstruction is not combined with Black Rock and Long Ridge events for this analysis.
This paper will summarize results of nearly nine years of BR/LR hybridXmax measurements recently published; further details about the analysis and results can be found there [14]. The data examined in this analysis spans the pe-riod 27 May 2008 to 29 November 2016, over which 1500 nights of data were collected. Time matching of BR/LR events and SD events resulted in 17,834 hybrid candidate events. An event only becomes an accepted hybrid event after it passes all quality cuts. Cuts on geometry such as track length cut, shower-detector plane cut, and zenith an-gle cut are used to ensure accurate reconstruction of the shower track. Cuts on fluorescence profileχ2,Xmax
brack-eting, and good weather nights ensure the shower profile is well observed and Xmax is well measured. An energy
cut is also applied to ensure that no events with recon-structed energy below 1018.2 eV are accepted. This cut
is imposed because of rapidly falling acceptance near this energy. After all quality cuts are applied 3330 events re-main as accepted hybrid events for E ≥ 1018.2 eV. To
ensure the validity of our analysis TA makes extensive
use of a detailed Monte Carlo simulation which includes hourly and nightly databases of important runtime param-eters such as PMT pedestals, PMT gains, mirror reflec-tivity, and atmospheric profile. We simulate the running conditions of each night’s data that is collected to provide a simulated data sample approximately 10x that collected in data. Data and Monte Carlo are packed into the same data format and reconstructed using the same programs. Because of model dependencies and primary particle de-pendencies on observables, Monte Carlo is thrown for dif-ferent models and primaries. In this work we compare TA Xmaxdata to QGSJet II-04 [15] protons, helium, nitrogen,
and iron. We then perform data/Monte Carlo comparisons on observables that are important to good hybrid recon-struction of Xmax. Reconstruction bias and resolution is
also checked by examining the difference between thrown and reconstructed values of important reconstruction pa-rameters. Xmaxreconstruction bias is -1.1, -3.3, -3.8, and
-3.8 g/cm2 for QGSJet II-04 protons, helium, nitrogen, and iron respectively for E ≥ 1018.2 eV. Xmax resolution
is 17.2 g/cm2for protons and 13.2 g/cm2for iron. Energy bias ranges from 1.7% for protons to -6.5% for iron, with energy resolution no worse than 6% for any of the four species examined. Resolution and bias of important geo-metric observables are very good as expected for hybrid reconstruction; angular resolutions are < 1◦ and
resolu-tions onRp (shower impact parameter) and core location
are∼50 m.
We can compare theXmaxdistributions of the data with
that predicted by the Monte Carlo to see what elements best describe our observations. It is not clear what fraction of UHECRs in an energy bin are mixtures of different el-ements. For this work TA only compares data to the four individual QGSJet II-04 elements we simulated. This can be done by comparing the first two moments of the ob-servedXmaxdistributions in an energy bin, e.g.,Xmaxand
σ(Xmax). Simplifying entire distributions to their first and
second moments is problematic in the case ofXmax
distri-butions though.Xmaxdistributions are not normal
distribu-tions and may exhibit significant skew depending upon the primary element being examined. Light elements such as protons and helium have large positive skew (right tail is longer), while heavy elements such as iron have a much less pronounced tail. This in and of itself may not be a problem when sufficient statistics are available in data. UHECR flux falls rapidly with energy though and appears to be cutting offabove 1019.7eV [16]. This requires that UHECR observatories have very large exposures to pro-vide sufficient statistics to generate a distribution of events that is not susceptible to statistical biases when measur-ing their means and widths. Hybrid reconstruction ofXmax
is limited in its acceptance by requiring events fall within the boundaries of its SD array and TA’s SD reconstruc-tion is limited to zenith angles of 60◦. These two
con-straints reduce the total acceptance of hybrid reconstructed events as energy increases becauseXmax occurs closer to,
or even in, the ground. Hybrid reconstruction of Xmax
requires that Xmax be within the field of view of the FD
(Xmax bracketing). As energy increases only tracks with
increasing zenith angle have the potential to have sufficient
(E/eV) 10 log 18.2 18.4 18.6 18.8 19 19.2 19.4 19.6 19.8
)
2
> (g/cm
max
<X
640 660 680 700 720 740 760 780 800 820
801 758 572
395 289 170 132
80 87
27 19
801 758 572
395 289 170 132
80 87
27 19
data
QGSJet II-04 proton QGSJet II-04 helium QGSJet II-04 nitrogen QGSJet II-04 iron
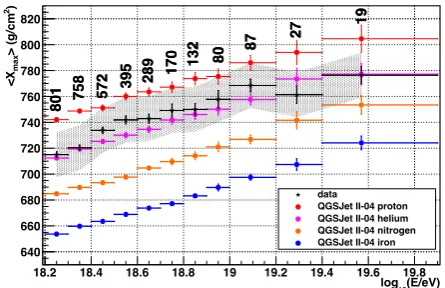
Figure1:MeanXmaxas afunctionof energyasobserved
by Telescope Array in BR/LR hybrid mode over nearly nineyearsofdatacollection.Thenumbersabovethedata pointsindicate the numberof events observed.The gray band is the systematic uncertainty of this analysis. Reconstructed Monte Carlo of four different primary speciesgeneratedusingtheQGSJetII-04hadronicmodel areshownforcomparison.
track length to reach shower maximum in the atmosphere. Smaller zenith angle acceptance though reduces the FD field of view for showers that also arrive relatively close by due to the constraint imposed by the simultaneous SD detection as well. Standard FD-only observation has an aperture that grows with energy beyond the boundaries of the SD array, whereas hybrid can only grow up until the acceptance of the far side of the SD is fully efficient. TA SD reconstruction is currently limited up to zenith angles of 60◦due to the difficulty of reconstructing the footprint
of the shower at such large angles. Stereo FD reconstruc-tion can address some of these problems. Stereo FD has equally goodXmaxresolution as hybrid, is not limited to a
smaller field of view at the highest energies, and has better acceptance than hybrid reconstruction at the highest en-ergies. Because of the potential loss of the most deeply penetrating events at the highest energies, the potential for bias inXmaxandσ(Xmax) must be considered. We present
the results of the first two moments of the observedXmax
distributions, but we also employ a morphological test of the shapes of theXmaxdistributions and calculate the
prob-ability that a given element is compatible with our obser-vations at the 95% confidence level.
Figure 1 and table 1 summarize the observed Xmax
for nearly nine years of hybrid operations utilizing the BR and LR FD detectors in coincidence with the SD ar-ray. Figure 1 also shows the predictedXmaxfor the four
QGSJet II-04 species simulated as well.Xmaxof the data
differs greatly from nitrogen and iron, more closely resem-blingXmaxof protons or helium. Notice that as energy
increases the size of the energy bins must be increased to attempt to capture sufficient events to make a good mea-surement of Xmax andσ(Xmax). Having only 27 or 19
events in a bin though, such as we have forE≥1019.2eV,
Elow E Ehigh Ndata Xmax σ(Xmax)
18.20 18.25 18.30 801 715±2+17
−17 63±2+−34
18.30 18.35 18.40 758 720±2+17
−17 59±2+−44
18.40 18.45 18.50 572 734±2+17
−17 58±2+−44
18.50 18.55 18.60 395 742±3+17
−17 61±3+−44
18.60 18.65 18.70 289 743±3+17
−17 58±3+−44
18.70 18.75 18.80 170 749±5+17
−17 65±6+−34
18.80 18.85 18.90 132 750±5+17
−17 52±5+−44
18.90 18.95 19.00 80 758±7+17
−17 61±8+−44
19.00 19.09 19.20 87 769±5+17
−17 46±4+−55
19.20 19.29 19.40 27 761±7+17
−17 35±4+−67
19.40 19.57 19.90 19 777±7+17
−17 29±4+−79
Table1:Xmaxandσ(Xmax)observedfornearly9years of
data by Telescope Array in BR/LR hybrid collection mode. Energy is in units of log10(E/eV) andXmaxand
σ(Xmax) are in g/cm2.
(E/eV) 10 log 18.2 18.4 18.6 18.8 19 19.2 19.4 19.6 19.8
)
2
> (g/cm
max
<X
680 700 720 740 760 780 800 820
data QGSJet II-04 proton QGSJet II-04 helium data sys. QGSJet II-04 proton sys. QGSJet II-04 helium sys.
Figure 2:TA BR/LR observed hybrid Xmaxand predic-tionsforQGSJetII-04protonsandhelium.Theblackband aroundthedataiscalculatedsystematicuncertaintyofthe data. The colored bands aroundthe proton andhelium predictions areestimated uncertaintiesinthe QGSJet II-04model.
We can measure the compatibility of the data with Monte Carlo by performing a maximum likelihood fit be-tween theirXmaxdistributions. To do this we need to
ad-dress the potential of systematic uncertainties in our recon-struction and potentially in the models we are comparing against. We do this introducing a parameterλby which
we shift the dataXmaxdistribution and finding theλwhich
gives the best likelihood between the data and Monte Carlo for a given energy bin and chemical element. The un-certainties inXmax in hadronic models have been
esti-mated to range fromσ(Xmax)=±3 g/cm2at 1017.0eV to
σ(Xmax)=±18 g/cm2 at 1019.5eV [17]. Figure 2 shows
the estimated systematic uncertainty in QGSJet II-04 pro-tons and helium relative to TA Xmax and there is
sig-nificant overlap between them. These uncertainties arise mainly from the relatively large unknown contributions from cross section, multiplicity, and elasticity in hadronic models that must be extrapolated from current collider en-ergies up to the enen-ergies of UHECRs [18].
18.2 18.4 18.6 18.8 19 19.2 19.4 19.6 (E/eV) 10 log 3
− 10
2 − 10
1 − 10
1
p-value
60
−
40
−
20
−
0 20
QGSJet II-04 proton QGSJet II-04 helium QGSJet II-04 nitrogen QGSJet II-04 iron
Figure3:Unbinnedmaximumlikelihoodtestonobserved andsimulatedQGSJet II-04Xmax distributionsafter
sys-tematicshiftingofthedatatofindthebestloglikelihood. Eachpointrepresentstheprobabilityof measuringalog likelihoodmoreextremethanthatobservedinthedata af-teritisshiftedbythebest∆Xmax. Thecolorofthepoint indicates the ∆Xmax measured ing/cm2 required to find themaximumloglikelihoodvalue. Thedashedlineatp -value=0.05indicatesthethresholdbelowwhichthedata isdeemedincompatiblewiththeMonteCarloatthe95% confidencelevel.
We then calculate the chance probability of observing a likelihood at least as extreme as we find using the data. Using a critical value of 5%, we say that if the probabil-ity of observing a likelihood measured for the data and a given species is less than 5%, then the data is not com-patible with the model at the 95% confidence level. If, on the other hand, the probability is greater than 5% we say that we cannot rule out that species as being the same as that which we have observed. We note that this is a simple test against single chemical elements, and does not test for compatibility for mixtures of elements. Our results do not preclude the possibility for mixtures of elements given that they occur in the correct ratios that would allow their dis-tributions to mimic those we observe in our data. Figure 3 shows the results of these tests for QGSJet II-04 protons, helium, nitrogen, and iron. For all energies protons are found compatible with TA data. Helium does not become compatible with our data until E > 1019.2 eV. Nitrogen
becomes compatible forE>1019.2eV and iron is
compat-ible forE>1019.4. It may seem problematic that ourX max
data is simultaneously compatible withXmaxdistributions
whose shapes vary as widely as protons and iron at the highest energies. This reflects the lack of sufficient statis-tics to accurately measure the shapes of the distributions. In particular the tails of the distributions of the light ele-ments disappear in these energy bins potentially because the Xmax distribution is shifted deeper as it is
approach-ing the limit of TA’s reconstruction acceptance for such deeply penetrating events, even for simulated data. For iron though, figure 3 shows that the shift inXmaxrequired
Elow E Ehigh Ndata Xmax σ(Xmax)
18.20 18.25 18.30 801 715±2+17
−17 63±2+−34
18.30 18.35 18.40 758 720±2+17
−17 59±2+−44
18.40 18.45 18.50 572 734±2+17
−17 58±2+−44
18.50 18.55 18.60 395 742±3+17
−17 61±3+−44
18.60 18.65 18.70 289 743±3+17
−17 58±3+−44
18.70 18.75 18.80 170 749±5+17
−17 65±6+−34
18.80 18.85 18.90 132 750±5+17
−17 52±5+−44
18.90 18.95 19.00 80 758±7+17
−17 61±8+−44
19.00 19.09 19.20 87 769±5+17
−17 46±4+−55
19.20 19.29 19.40 27 761±7+17
−17 35±4+−67
19.40 19.57 19.90 19 777±7+17
−17 29±4+−79
Table1:Xmaxandσ(Xmax)observedfornearly9years of
data by Telescope Array in BR/LR hybrid collection mode. Energy is in units of log10(E/eV) andXmaxand
σ(Xmax) are in g/cm2.
(E/eV) 10 log 18.2 18.4 18.6 18.8 19 19.2 19.4 19.6 19.8
)
2
> (g/cm
max
<X
680 700 720 740 760 780 800 820
data QGSJet II-04 proton QGSJet II-04 helium data sys. QGSJet II-04 proton sys. QGSJet II-04 helium sys.
Figure 2:TA BR/LR observed hybrid Xmaxand predic-tionsforQGSJetII-04protonsandhelium.Theblackband aroundthedataiscalculatedsystematicuncertaintyofthe data. The colored bands aroundthe proton andhelium predictions areestimated uncertainties inthe QGSJet II-04model.
We can measure the compatibility of the data with Monte Carlo by performing a maximum likelihood fit be-tween theirXmaxdistributions. To do this we need to
ad-dress the potential of systematic uncertainties in our recon-struction and potentially in the models we are comparing against. We do this introducing a parameterλby which
we shift the dataXmaxdistribution and finding theλwhich
gives the best likelihood between the data and Monte Carlo for a given energy bin and chemical element. The un-certainties in Xmax in hadronic models have been
esti-mated to range fromσ(Xmax)=±3 g/cm2at 1017.0eV to
σ(Xmax)=±18 g/cm2at 1019.5eV [17]. Figure 2 shows
the estimated systematic uncertainty in QGSJet II-04 pro-tons and helium relative to TA Xmax and there is
sig-nificant overlap between them. These uncertainties arise mainly from the relatively large unknown contributions from cross section, multiplicity, and elasticity in hadronic models that must be extrapolated from current collider en-ergies up to the enen-ergies of UHECRs [18].
18.2 18.4 18.6 18.8 19 19.2 19.4 19.6 (E/eV) 10 log 3
− 10
2 − 10
1 − 10
1
p-value
60
−
40
−
20
−
0 20
QGSJet II-04 proton QGSJet II-04 helium QGSJet II-04 nitrogen QGSJet II-04 iron
Figure3:Unbinnedmaximumlikelihoodtestonobserved andsimulatedQGSJet II-04 Xmax distributionsafter
sys-tematicshiftingofthedatatofindthebestloglikelihood. Eachpointrepresentstheprobabilityof measuringalog likelihoodmoreextremethanthatobservedinthedata af-teritisshiftedbythebest∆Xmax. Thecolorofthepoint indicates the ∆Xmax measured ing/cm2 required to find themaximumloglikelihoodvalue. Thedashedlineatp -value=0.05indicatesthethresholdbelowwhichthedata isdeemedincompatiblewiththeMonteCarloatthe95% confidencelevel.
We then calculate the chance probability of observing a likelihood at least as extreme as we find using the data. Using a critical value of 5%, we say that if the probabil-ity of observing a likelihood measured for the data and a given species is less than 5%, then the data is not com-patible with the model at the 95% confidence level. If, on the other hand, the probability is greater than 5% we say that we cannot rule out that species as being the same as that which we have observed. We note that this is a simple test against single chemical elements, and does not test for compatibility for mixtures of elements. Our results do not preclude the possibility for mixtures of elements given that they occur in the correct ratios that would allow their dis-tributions to mimic those we observe in our data. Figure 3 shows the results of these tests for QGSJet II-04 protons, helium, nitrogen, and iron. For all energies protons are found compatible with TA data. Helium does not become compatible with our data until E > 1019.2 eV. Nitrogen
becomes compatible forE>1019.2eV and iron is
compat-ible forE>1019.4. It may seem problematic that ourX max
data is simultaneously compatible withXmaxdistributions
whose shapes vary as widely as protons and iron at the highest energies. This reflects the lack of sufficient statis-tics to accurately measure the shapes of the distributions. In particular the tails of the distributions of the light ele-ments disappear in these energy bins potentially because the Xmax distribution is shifted deeper as it is
approach-ing the limit of TA’s reconstruction acceptance for such deeply penetrating events, even for simulated data. For iron though, figure 3 shows that the shift inXmaxrequired
to find the maximum likelihood requires a very large shift, approximately 60 g/cm2, making it unlikely that iron is a truly reasonable match between the data and the Monte Carlo.
3 Comparison of Auger and Telescope
Array
X
maxIn the Southern Hemisphere, the Pierre Auger Observa-tory is the largest cosmic ray observaObserva-tory currently in op-eration. It is located near Malargüe, Argentina. It uses 1660 water Cherenkov detectors covering 3000 km2 and
24 fluorescence telescopes at four FD stations overlooking the SD array [19]. Auger also uses hybrid observation to measureXmax.
Comparison of Xmax results between Auger and TA
must account for the way each group analyzes their data. Auger reconstructs Xmax distributions as “seen in the
at-mosphere”, meaning they select events such that their final Xmaxdistributions for an energy bin are not biased by
ac-ceptance. This is done primarily through cuts on the field of view of the FD telescopes. For each energy bin, the upper and lower bound of the acceptable field of view is found by finding that range that does not allow trueXmax
to deviate by more than 5 g/cm2. All observed showers must fall within this range otherwise it is not accepted. Other cuts are applied as well to ensure all events are high quality events. The effect of such a procedure is that the observedXmaxdistributions will look like a distribution of
simulatedXmaxbefore it is distorted through acceptance of
the detector [20]. Model dependence is still an issue and data must be compared to thrown models if one wishes to understand the distribution of chemical elements in the primary spectrum. Telescope Array reconstructsXmax
dis-tributions as “seen by the detector”. TA imposes minimal cuts in an attempt to collect as many events as possible. In this approach, biases are incurred into a thrownXmax
dis-tribution, caused by loss of events, e.g., high energy small zenith angle events that achieve shower maximum outside the field of view of the detector. This can have the effect of truncating tails in the reconstructedXmax distributions
and shifting their means and widths. We can still compare our data to simulations because we utilize a very detailed Monte Carlo simulation that informs us of our biases and distorts thrown distributions accordingly.
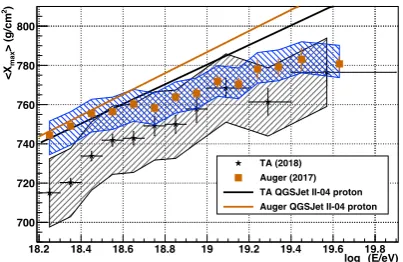
Even given this difference in approach to Xmax re-construction, the data of TA and Auger do not look par-ticularly different given each experiment’s uncertainties. Figure 4 shows the latestXmax data collected by TA and
Auger. Using nearly twelve years of data Auger has col-lected 10,570 events above E ≥ 1018.2 eV compared to
TA’s 3330 events [21]. Auger’sXmaxis unbiased by the
detector and TA’s Xmax is biased. Without addressing
this differenceXmaxcannot be compared in such a sim-ple matter. Figure 4 also shows as reference the prediction each experiment makes for QGSJet II-04 protons. Auger’s
Xmax is consistent with their unbiased prediction with
protons up to 1018.7 eV, after which the data appears to
signal an increase in primary mass. TA’sXmaxis
consis-tent with their prediction with protons within systematic uncertainties for E ≥ 1018.5 eV. These results are often
interpreted as Auger sees an evolution in composition to heavier primaries with energy, while TA sees composition compatible with light primaries such as protons.
(E/eV) 10 log 18.2 18.4 18.6 18.8 19 19.2 19.4 19.6 19.8
)
2
> (g/cm
max
<X
700 720 740 760 780 800
TA (2018) Auger (2017) TA QGSJet II-04 proton Auger QGSJet II-04 proton
Figure 4: Most recent Xmaxmeasurements from TA
(2018) [14] and Auger (2017) [21]. Systematic uncer-taintiesforeachmeasurementareindicatedbythebands aroundthe datapoints. Theorangesolid line andblack solid lineshoweach experiment’spredictiontocompare againsttheirdata. NotethatAuger’sprotonpredictionis unbiasedbyacceptanceandreconstruction effects, while TA’sisbiased.
(E/eV) 10 log 18.2 18.3 18.4 18.5 18.6 18.7 18.8 18.9 19
)
2
) (g/cm
max
(X
σ
40 45 50 55 60 65 70
TA (2018) Auger (2017) QGSJet II-04 proton QGSJet II-04 helium
Figure 5: Most recent σ(Xmax) measurements from TA
(2018) [14] and Auger (2017) [21]. Systematic uncer-taintiesforeach measurementareindicatedbythebands aroundthedatapoints. TheTApredictionforσ(Xmax)of
QGSJet II-04protonsandheliumarealsoshown. Auger observesanarrowingofσ(Xmax)forE ≥1018.5eV,while
TAdoesnot. Narrowingofσ(Xmax)issignatureof
com-positionincreasinginmass.
σ(Xmax) for each experiment also shows results
con-sistent with these interpretations. Figure 5 shows recent measurements of σ(Xmax) for both experiments. Below
1018.5eV Auger and TA observe the sameσ(Xmax). Above
this energy, Auger sees a narrowing of theXmax
distribu-tions, which may be a sign of increasing primary particle mass.
Compo-(E/eV) 10 log 18.2 18.4 18.6 18.8 19 19.2 19.4 19.6 19.8
)
2
> (g/cm
max
<X
680 700 720 740 760 780 800
TA BR/LR 7 year data (preliminary) TA BR/LR ⊗ Auger 2014
Figure 6: Comparison of Auger and TA Xmax
measure-ments.TAdataisthatobservedbythedetectorinthefield. TheAuger 2014⊗TABR/LRmixture isconstructedby fittingAugerdatatoamixtureoffourprimaryelements, throwingthatenergydependent mixtureinMonteCarlo, thenreconstructing themixture inthesamewayTAdata is reconstructed. Within systematic uncertainties Auger andTAXmaxareinagreement.
sition Working Group was formed in 2012 to allowXmax
analysis experts in each experiment to work together to determine the best way to make comparisons of each ex-periment’s data [22]. In the years following, a procedure was developed to allow the direct comparison of Auger and TA data. The procedure is as follows: Auger fits their data to an ad-hoc mixture of proton, helium, nitrogen, and iron, computing the fractions of each as a function of en-ergy, Auger provides these fractions to TA, TA performs a Monte Carlo simulation of the mixture, then compares the reconstructed mix to TA data. Because Auger’s data is unbiased, a fit to their data is a fit to distributions gener-ated by simulation without detector acceptance distorting them. By reconstructing that unbiased mixture through the TA analysis chain, and exposing the distributions to TA ac-ceptance and reconstruction bias, this distorts the thrown distributions in a way that is consistent with how true dis-tributions in nature are distorted.
The issue of which hadronic model best agrees with data must be addressed as well. Auger has fitted its data to a few different models and finds best agreement with EPOS-LHC [23, 24]. In 2016, Auger and TA presented results of seven years of TA BR/LR hybridXmaxdata and a simulated mixture fit to Auger data and reconstructed through TA’s analysis routines [25]. Figure 6 shows the result of employing the procedure previously described. Reconstruction of the mix that fits Auger data effectively biases it in the way the TA detector would see it. The figure shows that within systematic uncertainties Auger and TA are in good agreement in the measurement ofXmax.
This analysis was extended further in 2017 [26]. In that study, the Auger mix was simulated by TA and constructed through TA analysis software, then the re-constructedXmax distributions of the mixture were tested
against the TA Xmax data distributions using both the
Kolmogorov-Smirnov (KS) test and the Anderson-Darling
) 2 (g/cm TA max X 500 600 700 800 900 1000 1100 1200
N
0 20 40 60 80 100
120 Xmax Shift = -23 g/cm2
Probability (P2) KS = 0.35 AD = 0.65
(E/eV) < 18.3 10 18.2 < log
) 2 (g/cm TA max X 500 600 700 800 900 1000 1100 1200
N
0 20 40 60 80 100
120 Xmax Shift = -26 g/cm2
Probability (P2) KS = 0.61 AD = 0.95
(E/eV) < 18.4 10 18.3 < log
) 2 (g/cm TA max X 500 600 700 800 900 1000 1100 1200
N
0 10 20 30 40 50 60 70 80 90
2
Shift = -16 g/cm
max
X
Probability (P2) KS = 0.65 AD = 0.87
(E/eV) < 18.5 10 18.4 < log
) 2 (g/cm TA max X 500 600 700 800 900 1000 1100 1200
N
0 10 20 30 40 50
60 Xmax Shift = -12 g/cm2
Probability (P2) KS = 0.43 AD = 0.48
(E/eV) < 18.6 10 18.5 < log
) 2 (g/cm TA max X 500 600 700 800 900 1000 1100 1200
N
0 5 10 15 20 25 30 35 40 45
2
Shift = -12 g/cm
max
X
Probability (P2) KS = 0.97 AD = 0.98
(E/eV) < 18.7 10 18.6 < log
) 2 (g/cm TA max X 500 600 700 800 900 1000 1100 1200
N
0 5 10 15 20 25
30 Xmax Shift = -6.4 g/cm2
Probability (P2) KS = 0.39 AD = 0.49
(E/eV) < 18.8 10 18.7 < log
) 2 (g/cm TA max X 500 600 700 800 900 1000 1100 1200
N
0 2 4 6 8 10 12 14 16 18 20
22 Xmax Shift = -15 g/cm2
Probability (P2) KS = 0.37 AD = 0.47
(E/eV) < 18.9 10 18.8 < log
) 2 (g/cm TA max X 500 600 700 800 900 1000 1100 1200
N
0 2 4 6 8 10 12
2
Shift = -3.9 g/cm
max
X
Probability (P2) KS = 0.85 AD = 0.88
(E/eV) < 19.0 10 18.9 < log
Figure 7: TA data Xmax distributions (black line) and
AugermixXmaxdistributions(solidblue)usedtotest
com-patibilityofTAandAugerdata.TAdatawasallowedtobe systematicallyshiftedsothatthemeansoftheXmax
distri-butionsmatched.TheKSandADtestsmeasurethe prob-abilityofcompatibilitybasedupontheshapesofthe dis-tributions.
(AD) test. This procedure allowed us to test for com-patibility of entireXmaxdistributions, not justXmaxand
σ(Xmax), which is a more powerful and empirical measure.
In each case the tests allow one to calculate the probability that both distributions were sampled from the same parent distribution. The KS test is most sensitive near the peak of distributions under test, while the AD test is more sensitive to the tails of the distributions [27]. Sensitivity to the tails is important for skewed distributions such asXmax. To test
the compatibility of the distributions, in an energy bin the Auger mixXmaxdistribution reconstructed through the TA
analysis chain was sampled according to TA data statis-tics, and the KS and AD test statistics were computed for this sample and theXmaxdistribution of the mixture, called
P1MC. This was done 100,000 times and provides a
distri-bution of probabilities for compatibility of the Auger mix in that energy bin. The probability that TA data and the Auger mix were sampled from the same distribution was also calculated and called P1data. The compatibility
proba-bility of TA data and the Auger mix, P2, was then found by computing the probability to find P1MC larger than P1data.
Because the Auger mix is generated using the Auger data, this provides a path for a direct measure of compatibility of Auger and TAXmax.
Without systematic shifting of the TA data, only marginal compatibility was found between Auger and TA data. When TA Xmax distributions were allowed to vary
systematically in an energy bin so that the means of the distributions matched, between 20−30 g/cm2, the com-patibility probabilities indicated agreement for both two-sample tests. Figure 7 shows how the shapes of the TA and Auger mix distributions agree after shifting.
(E/eV) 10 log 18.2 18.4 18.6 18.8 19 19.2 19.4 19.6 19.8
) 2 > (g/cm max <X 680 700 720 740 760 780 800
TA BR/LR 7 year data (preliminary) TA BR/LR ⊗ Auger 2014
Figure 6: Comparison of Auger and TA Xmax
measure-ments.TAdataisthatobservedbythedetectorinthefield. TheAuger 2014⊗TABR/LR mixtureisconstructedby fittingAugerdatatoamixtureoffourprimaryelements, throwingthatenergydependent mixtureinMonteCarlo, thenreconstructingthemixtureinthesamewayTAdata is reconstructed. Within systematic uncertainties Auger andTAXmaxareinagreement.
sition Working Group was formed in 2012 to allowXmax
analysis experts in each experiment to work together to determine the best way to make comparisons of each ex-periment’s data [22]. In the years following, a procedure was developed to allow the direct comparison of Auger and TA data. The procedure is as follows: Auger fits their data to an ad-hoc mixture of proton, helium, nitrogen, and iron, computing the fractions of each as a function of en-ergy, Auger provides these fractions to TA, TA performs a Monte Carlo simulation of the mixture, then compares the reconstructed mix to TA data. Because Auger’s data is unbiased, a fit to their data is a fit to distributions gener-ated by simulation without detector acceptance distorting them. By reconstructing that unbiased mixture through the TA analysis chain, and exposing the distributions to TA ac-ceptance and reconstruction bias, this distorts the thrown distributions in a way that is consistent with how true dis-tributions in nature are distorted.
The issue of which hadronic model best agrees with data must be addressed as well. Auger has fitted its data to a few different models and finds best agreement with EPOS-LHC [23, 24]. In 2016, Auger and TA presented results of seven years of TA BR/LR hybridXmaxdata and a simulated mixture fit to Auger data and reconstructed through TA’s analysis routines [25]. Figure 6 shows the result of employing the procedure previously described. Reconstruction of the mix that fits Auger data effectively biases it in the way the TA detector would see it. The figure shows that within systematic uncertainties Auger and TA are in good agreement in the measurement ofXmax.
This analysis was extended further in 2017 [26]. In that study, the Auger mix was simulated by TA and constructed through TA analysis software, then the re-constructedXmax distributions of the mixture were tested
against the TA Xmax data distributions using both the
Kolmogorov-Smirnov (KS) test and the Anderson-Darling
) 2 (g/cm TA max X 500 600 700 800 900 1000 1100 1200
N 0 20 40 60 80 100
120 Xmax Shift = -23 g/cm2
Probability (P2) KS = 0.35 AD = 0.65
(E/eV) < 18.3 10 18.2 < log
) 2 (g/cm TA max X 500 600 700 800 900 1000 1100 1200
N 0 20 40 60 80 100
120 Xmax Shift = -26 g/cm2
Probability (P2) KS = 0.61 AD = 0.95
(E/eV) < 18.4 10 18.3 < log
) 2 (g/cm TA max X 500 600 700 800 900 1000 1100 1200
N 0 10 20 30 40 50 60 70 80 90 2
Shift = -16 g/cm
max
X
Probability (P2) KS = 0.65 AD = 0.87
(E/eV) < 18.5 10 18.4 < log
) 2 (g/cm TA max X 500 600 700 800 900 1000 1100 1200
N 0 10 20 30 40 50
60 Xmax Shift = -12 g/cm2
Probability (P2) KS = 0.43 AD = 0.48
(E/eV) < 18.6 10 18.5 < log
) 2 (g/cm TA max X 500 600 700 800 900 1000 1100 1200
N 0 5 10 15 20 25 30 35 40 45 2
Shift = -12 g/cm
max
X
Probability (P2) KS = 0.97 AD = 0.98
(E/eV) < 18.7 10 18.6 < log
) 2 (g/cm TA max X 500 600 700 800 900 1000 1100 1200
N 0 5 10 15 20 25
30 Xmax Shift = -6.4 g/cm2
Probability (P2) KS = 0.39 AD = 0.49
(E/eV) < 18.8 10 18.7 < log
) 2 (g/cm TA max X 500 600 700 800 900 1000 1100 1200
N 0 2 4 6 8 10 12 14 16 18 20
22 Xmax Shift = -15 g/cm2
Probability (P2) KS = 0.37 AD = 0.47
(E/eV) < 18.9 10 18.8 < log
) 2 (g/cm TA max X 500 600 700 800 900 1000 1100 1200
N 0 2 4 6 8 10 12 2
Shift = -3.9 g/cm
max
X
Probability (P2) KS = 0.85 AD = 0.88
(E/eV) < 19.0 10 18.9 < log
Figure 7: TA data Xmax distributions (black line) and
AugermixXmaxdistributions(solidblue)usedtotest
com-patibilityofTAandAugerdata.TAdatawasallowedtobe systematicallyshiftedsothatthemeansoftheXmax
distri-butionsmatched.TheKSandADtestsmeasurethe prob-abilityofcompatibilitybasedupontheshapesofthe dis-tributions.
(AD) test. This procedure allowed us to test for com-patibility of entireXmaxdistributions, not justXmaxand
σ(Xmax), which is a more powerful and empirical measure.
In each case the tests allow one to calculate the probability that both distributions were sampled from the same parent distribution. The KS test is most sensitive near the peak of distributions under test, while the AD test is more sensitive to the tails of the distributions [27]. Sensitivity to the tails is important for skewed distributions such asXmax. To test
the compatibility of the distributions, in an energy bin the Auger mixXmaxdistribution reconstructed through the TA
analysis chain was sampled according to TA data statis-tics, and the KS and AD test statistics were computed for this sample and theXmaxdistribution of the mixture, called
P1MC. This was done 100,000 times and provides a
distri-bution of probabilities for compatibility of the Auger mix in that energy bin. The probability that TA data and the Auger mix were sampled from the same distribution was also calculated and called P1data. The compatibility
proba-bility of TA data and the Auger mix, P2, was then found by computing the probability to find P1MClarger than P1data.
Because the Auger mix is generated using the Auger data, this provides a path for a direct measure of compatibility of Auger and TAXmax.
Without systematic shifting of the TA data, only marginal compatibility was found between Auger and TA data. When TA Xmax distributions were allowed to vary
systematically in an energy bin so that the means of the distributions matched, between 20−30 g/cm2, the com-patibility probabilities indicated agreement for both two-sample tests. Figure 7 shows how the shapes of the TA and Auger mix distributions agree after shifting.
In addition, TA data was tested for compatibility with pure QGSJet II-04 protons and a similar level of agreement was found. Probabilities greater than 0.01 were considered compatible. The conclusion of the study was that, within
( Energy/eV ) 10 log
18.1 18.2 18.3 18.4 18.5 18.6 18.7 18.8 18.9 19 19.1
P2 0 0.1 0.2 0.3 0.4 0.5 0.6 0.7 0.8 0.9 1 KS Test TA <-> AugerMix TA <-> Proton
( Energy/eV ) 10 log
18.1 18.2 18.3 18.4 18.5 18.6 18.7 18.8 18.9 19 19.1
P2 0 0.1 0.2 0.3 0.4 0.5 0.6 0.7 0.8 0.9 1 AD Test TA <-> AugerMix TA <-> Proton
Figure 8: Compatibility probabilities (P2) between TA dataandtheAugermixandQGSJetII-04protons,using theKolmogorov-Smirnovtest(top)andAnderson-Darling test (bottom). Probabilities > 0.01 indicate acceptable
agreementbetweenTAdataandthedistributionundertest.
Mix Proton
Elow Ehigh ∆ KS AD ∆ KS AD
18.20 18.30 -23 0.35 0.65 -31 0.14 0.21
18.30 18.40 -26 0.61 0.95 -33 0.99 0.99
18.40 18.50 -16 0.65 0.87 -22 0.57 0.62
18.50 18.60 -12 0.43 0.48 -21 0.41 0.53
18.60 18.70 -12 0.97 0.98 -24 0.92 0.95
18.70 18.80 -6 0.39 0.49 -20 0.67 0.88
18.80 18.90 -15 0.37 0.47 -31 0.55 0.26
18.90 19.00 -4 0.85 0.88 -20 0.98 0.98
Table 2:Compatibilityprobabilities (P2)between Auger andTAdata,andQGSJetII-04protonsandTAdatausing KSandADtwo-sampletests. ∆isshiftinXmaxing/cm2 appliedtotheTAdata.
systematic uncertainties, TA’s and Auger’s data are com-patible, and TA data is also comcom-patible, to about the same level, with a pure proton composition for E < 1019 eV.
Work is continuing with the Composition Working Group to continue comparing data as both groups collect more data. Figure 8 shows the computed probabilities for all tests; table 2 summarizes the results.
4 Summary
Telescope Array has recently published the first results of UHECRXmax measurements forE ≥ 1018.2 eV, using
the Black Rock and Long Ridge FD stations in conjunc-tion with the SD array. This nearly nine year hybrid data set is TA’s highest statistics measure ofXmax. Xmaxand
σ(Xmax) of the observed Xmax distributions agree with a
model consisting of light composition. Above 1019 eV,
statistics of TA’s hybrid reconstruction begin to fall to levels that make testing data and Monte Carlo difficult. TA performed a test of compatibility of observed Xmax
with four different primary chemical elements using the QGSJet II-04 hadronic model. For each energy bin TA’s
observedXmaxdistributions were allowed to shift
system-atically to find the shift which resulted in the largest maxi-mum likelihood calculated between data and Monte Carlo. The chance probability of observing a likelihood at least as extreme as that found in the shifted data was computed for all four elements. Using this procedure it was found that TA data is compatible with QGSJet II-04 protons for all energies tested, 1018.2 ≤ E < 1019.9 eV. Helium is
compatible for E ≥ 1019 eV, nitrogen is compatible for
E≥1019.2eV, and iron is compatible forE≥1019.4eV.
Auger and Telescope Array continue to work together through a Composition Working Group to allow the ex-change of data and ideas to resolve the apparent discrepan-cies in the interpretation of UHECR composition. Auger and TA data cannot be directly compared because of the different approaches to analysis each experiment takes. Auger producesXmaxdistributions that are unbiased
rela-tive to true Xmax distributions produced in UHECR
sim-ulations. TA produces Xmax distributions which are
bi-ased due to detector acceptance and resolution. Because of these differences in analysis procedures, direct com-parison ofXmaxandσ(Xmax) does not provide an
accu-rate picture of what the interpretation of UHECR compo-sition should be. Instead, Auger and TA have developed a method of indirect comparison of data. Auger produces an energy dependent ad-hoc mixture of protons, helium, nitrogen, and iron that best fits their Xmax distributions.
This mixture is then simulated by TA and reconstructed in the normal manner. This causes the same biases to be applied to the data observed by TA. Tests of the recon-structed mix can then be performed to compare it to TA data. Work was done recently to test the compatibility probability of Auger and TA data using this procedure. It was found that TA data and Auger data are compatible be-tween 1018.2 ≤E <1019.0eV and the same level of
com-patibility was also found, using the same tests, between TA data and a pure proton composition. The Composi-tion Working Group continues to work together to improve their understanding of each group’s analysis and finding ways to compare their data.
Acknowledgements
Ezekiel R. and Edna Wattis Dumke, Willard L. Eccles, and George S. and Dolores Doré Eccles all helped with gener-ous donations. The State of Utah supported the project through its Economic Development Board, and the Uni-versity of Utah through the Office of the Vice President for Research. The experimental site became available through the cooperation of the Utah School and Institu-tional Trust Lands Administration (SITLA), U.S. Bureau of Land Management (BLM), and the U.S. Air Force. We appreciate the assistance of the State of Utah and Fillmore offices of the BLM in crafting the Plan of Development for the site. Patrick Shea assisted the collaboration with valuable advice on a variety of topics. The people and the officials of Millard County, Utah have been a source of steadfast and warm support for our work which we greatly appreciate. We are indebted to the Millard County Road Department for their efforts to maintain and clear the roads which get us to our sites. We gratefully acknowledge the contribution from the technical staffs of our home institu-tions. An allocation of computer time from the Center for High Performance Computing at the University of Utah is gratefully acknowledged.
References
[1] J.F. Carlson, J.R. Oppenheimer, Phys. Rev.51, 220 (1937)
[2] J. Matthews, Astropart. Phys.22, 387 (2005) [3] R. Engel, D. Heck, T. Pierog, Ann. Rev. Nucl. Part.
Sci.61, 467 (2011)
[4] K.H. Kampert, M. Unger, Astropart. Phys.35, 660 (2012),1201.0018
[5] H. Wahlberg (Pierre Auger), Nucl. Phys. Proc. Suppl.
196, 195 (2009)
[6] R.U. Abbasi et al. (Telescope Array) (2018), 1808.03680
[7] A. Aab et al. (Pierre Auger), Phys. Rev. Lett.117, 192001 (2016),1610.08509
[8] R.U. Abbasi et al. (Telescope Array), Phys. Rev.
D98, 022002 (2018),1804.03877
[9] T. Abu-Zayyad et al. (Telescope Array), Nucl. In-strum. Meth.A689, 87 (2013),1201.4964
[10] T. Abu-Zayyad et al., Nucl. Instrum. Meth. A450, 253 (2000)
[11] Y. Tameda et al., Nucl. Instrum. Meth. A609, 227 (2009)
[12] H. Tokuno et al., Nucl. Instrum. Meth. A676, 54 (2012),1201.0002
[13] R.U. Abbasi et al., Astropart. Phys.64, 49 (2014), 1408.1726
[14] R.U. Abbasi et al. (Telescope Array), Astrophys. J.
858, 76 (2018),1801.09784
[15] S. Ostapchenko, Phys. Rev. D83, 014018 (2011), 1010.1869
[16] T. Abu-Zayyad et al. (Telescope Array), Astrophys. J.768, L1 (2013),1205.5067
[17] R.U. Abbasi, G.B. Thomson (2016),1605.05241 [18] R. Ulrich, R. Engel, M. Unger, Phys. Rev. D83,
054026 (2011),1010.4310
[19] A. Aab et al. (Pierre Auger), Nucl. Instrum. Meth.
A798, 172 (2015),1502.01323
[20] A. Aab et al. (Pierre Auger), Phys. Rev.D90, 122005 (2014),1409.4809
[21] J. Bellido (Pierre Auger), PoS ICRC2017, 506 (2018), [,40(2017)]
[22] E. Barcikowski, J. Bellido, J. Belz, Y. Egorov, S. Knurenko, V. de Souza, Y. Tameda, Y. Tsunesada, M. Unger (Yakutsk, Pierre Auger), EPJ Web Conf.
53, 01006 (2013),1306.4430
[23] A. Aab et al. (Pierre Auger), Phys. Rev.D90, 122006 (2014),1409.5083
[24] T. Pierog, I. Karpenko, J.M. Katzy, E. Yat-senko, K. Werner, Phys. Rev.C92, 034906 (2015), 1306.0121
[25] W. Hanlon, J. Bellido, J. Belz, S. Blaess, V. de Souza, D. Ikeda, P. Sokolsky, Y. Tsunesada, M. Unger, A. Yushkov, JPS Conf. Proc.19, 011013 (2018) [26] V. de Souza (Pierre Auger, Telescope Array), PoS
ICRC2017, 522 (2018)