P R O C E E D I N G S
Open Access
Incorporating ENCODE information into
association analysis of whole genome
sequencing data
Taebeom Kim and Peng Wei
*FromGenetic Analysis Workshop 19 Vienna, Austria. 24-26 August 2014
Abstract
With the rapidly decreasing cost of the next-generation sequencing technology, a large number of whole genome sequences have been generated, enabling researchers to survey rare variants in the protein-coding and regulatory regions of the genome. However, it remains a daunting task to identify functional variants associated with complex diseases from whole genome sequencing (WGS) data because of the millions of candidate variants and yet moderate sample size. We propose to incorporate the Encyclopedia of DNA Elements (ENCODE) information in the association analysis of WGS data to boost the statistical power. We use the RegulomeDB and PolyPhen2 scores as external weights in existing rare variants association tests. We demonstrate the proposed framework using the WGS data and blood pressure phenotype from the San Antonio Family Studies provided by the Genetic Analysis Workshop 19. We identified a genome-wide significant locus in geneSNUPNon chromosome 15 that harbors a rare nonsynonymous variant, which was not detected by benchmark methods that did not incorporate biological information, including the T5 burden test and sequence kernel association test.
Background
Genome-wide association studies (GWAS) have identi-fied thousands of genetic loci robustly associated with a wide range of complex diseases and traits. However, there is a big gap between the disease heritability ex-plained by GWAS-identified loci and that estimated from twin/family-based studies, leading to the so-called missing heritability [1]. To fill in this gap, recent genetic studies have shifted gear from GWAS investigating com-mon single-nucleotide polymorphisms with a minor al-lele frequency (MAF) larger than 5 % to low frequency (MAF between 1 and 5 %) and rare variants (RVs with MAFs <1 %) afforded by the next-generation sequencing (NGS) technology. As a result of the relatively low cost of the whole exome sequencing (WES), the first wave of NGS-based association studies of complex diseases, for
example, the Exome Sequencing Project (ESP), has pri-marily focused on the protein-coding regions of the human genome, that is, the exome, constituting approxi-mately 1 % of the total genome. Although the WES has been extremely useful in identifying causal variants for Mendelian disorders, the success with WES-based asso-ciation studies of complex diseases has been very limited thus far [2]. This is partly because of the limited statis-tical power afforded by the current sample size of WES studies, and partly because of the incomplete coverage of the human genome by the WES. To improve the power, many new statistical methods for analysis of RVs have been proposed in the past few years, including the T1/T5 burden tests (variant collapsing methods with a MAF threshold of 1 % or 5 %), sequence kernel associ-ation test (SKAT) [3], adaptive sum of powered score (aSPU) [4], among others; see Lee et al. [2] and Pan et al. [4] for recent reviews.
Thanks to the rapidly decreasing cost of whole gen-ome sequencing (WGS), thousands of whole gengen-ome
* Correspondence:[email protected]
Department of Biostatistics, The University of Texas MD Anderson Cancer Center, Houston, TX 77030, USA
sequences have been generated [5], enabling researchers to go beyond the exome and survey RVs in the regula-tory regions of the genome. However, with almost 100 times more variants and even smaller sample size in WGS than those in WES, it remains a significant chal-lenge to analyze WGS data. To boost the power, we and others have previously proposed statistical methods to leverage external biological information, such as compu-tational predictions of damaging effects of nonsynon-ymous variants based on PolyPhen2 [6], in association analysis of WES data [7–9]. On the other hand, genome-wide functional studies, such as the Encyclopedia of DNA Elements (ENCODE) project [10], have substan-tially advanced our knowledge about the functional DNA elements, especially noncoding regions, of the hu-man genome. In contrast to the current practice of using the ENCODE information to annotate GWAS findings and prioritize functional variants to follow up [11], we propose to incorporate the ENCODE information in the discovery stage of association analysis of WGS data to boost the statistical power. Specifically, we use the Regu-lomeDB [12] scores as weights in existing RV association tests. RegulomeDB is a database that integrates a large collection of regulatory information of the human ge-nomes, including multiple data sets such as ENCODE, ex-pression quantitative trait locus (eQTL), computational predictions, manual annotation, and other sources, to identify functional variants and putative regulatory poten-tial. The existing RV association tests we considered were the T5 burden test and SKAT, as a representative of uni-directional and omniuni-directional tests, respectively. Al-though unidirectional tests assume that all the variants in a test unit, for example, a gene, influence the trait in the same direction, either increasing or decreasing, omnidir-ectional tests allow the presence of variants in both direc-tions in a test unit [2]. We demonstrated the proposed framework using the WGS data and blood pressure phenotype from the San Antonio Family Studies (SAFS) provided by the Genetic Analysis Workshop (GAW) 19.
Methods
Genotype and phenotype data
We used the WGS data provided by GAW19 which in-cluded more than 8.3 million variants from odd-numbered chromosomes and 959 related individuals. The longitudinal phenotype data set had 1389 individ-uals including all samples with WGS data. Because there were many missing observations in the baseline meas-urement, we selected those subjects with at least 1 blood pressure measure among 5 visits and were able to obtain 789 related individuals. We used the earliest measure-ment among all completed visits for each person. We analyzed the systolic blood pressure (SBP) as a quantita-tive phenotype.
Functional annotation of variants
We employed a sliding window approach to group RVs with a window length of 4 kb and a step size of 2 kb, as in Morrison et al. [5], resulting in 658,631 windows in total. The median number of variants in a window was 19. RegulomeDB provides a scoring system that catego-rizes variants by the confidence that a variant lies in a functional location and likely results in a functional con-sequence. There are 6 categories. Variants in category 1, which are supported by evidence from eQTL, transcrip-tion factor (TF) binding, matched TF motif, matched DNase footprint, and DNase peak, are considered to be most likely to affect binding and linked to expression of a gene target. Among the 8.3 million variants annotated in RegulomeDB, 0.26, 2.71, 2.12, 7.56, 30.76, and 56.59 % variants were assigned to category 1, 2, 3, 4, 5, and 6, respectively. If a nonsynonymous variant was not annotated by RegulomeDB, we used its PolyPhen2 func-tional prediction to assign it to a category, that is,“ prob-ably damaging” to category 1, “possibly damaging” to category 3, and “benign” to category 5. If a variant was not found in either RegulomeDB or PolyPhen2, we assigned it to category 6.
Statistical methods
We used T5 and SKAT as the benchmark association tests of RVs with MAFs of less than 5 %. Given a quantitative traitY ¼ðY1;…;YnÞfornsubjects, SKAT assumes a
lin-ear mixed effects modelYi¼γ0þZiγþGiβþεi, where
γ0is an intercept;Ziis thei-th row vector of the covariate
matrix;γ¼ γ1;⋯;γp
′is a vector of fixed-effect coeffi-cients;Gi is thei-th row vector of the genotype matrixG coded as variant allele counts;β¼β1;⋯;βm′is a vector of random effects for RVs; andε¼ðε1;…;εnÞ′is a vector
of random errors. Moreover,β follows an arbitrary distri-bution with Eh iβj ¼0 and V arh iβj ¼ωj2τ, and ωj
¼Beta MAF j;1;25is a prespecified weight for variant j (j¼1; ::;m). Thus the null hypothesis of no
associ-ation between the phenotype and the m RVs is
re-duced to H0: τ¼0 . As in Wu et al. [3], the SKAT
test statistic under a linear kernel is TSKAT ¼Pmj¼1ω2j Pn
i¼1ðYiμ^iÞGij
2
, where μi is the predicted mean of Yi under H0: In addition to the default Betað1;25Þ
weights assuming that rarer variants tended to have larger effect sizes, we used two other versions of weights: equal weights with all ωj¼1 (called “uwSKAT”) and weights determined by RegulomeDB (called “regSKAT”) withω2j ¼f sj , where sj is variant j’s discrete functional category assigned by RegulomeDB. The function f trans-forms the RegulomeDB functional categories 1;ð 2;⋯;6Þ
“Transformation of functional categories” below. The T5 tests for the association between the phenotype and the mutation burden collapsed over the m RVs defined asPmj¼1ωjGij in the linear regression framework, where ωj¼1 if MAFj<0:05 and ωj¼0 otherwise [2]. We also applied 2 modified forms of the T5 test: the Mad-sen and Browning (MB) [2] weighting with ωj¼1=
MAFj1MAFj
and the RegulomeDB weighting withωj¼f sj , called“regT5.”
We included age at visit, sex, smoking status, and blood pressure medication use as covariates in all the as-sociation analyses. In addition, because we analyzed the family-based samples in GAW19, we applied the above described tests, including SKAT, uwSKAT, regSKAT, T5, MB, and regT5, in the family-based SKAT and T5 frame-works [13]. As implemented in the R package“seqMeta,” family relatedness among individuals was properly taken into account by introducing a subject-specific random effect δi, whose covariance matrix was proportional to twice the kinship matrix obtained from the pedigree in-formation [13]. Using the conservative Bonferroni pro-cedure for 658,631 sliding windows, we controlled the family-wise error rate (FWER) at 0.05 with a significance level α = 0.05/658631 = 7.59e-08, which corresponds to 7:12 on thelog10scale.
Transformation of functional categories
As mentioned above, in regSKAT and regT5 we trans-formed the RegulomeDB discrete functional categories
1;2;…;6
ð Þ to numerical weights. We employed a
quad-ratic function of the reverse order of categories f sð Þ ¼s2,
where s is the reverse order of a category; that is, s equals 6;5;…;1 for category 1, 2,…, 6, respectively. We chose the quadratic transformation because it puts much less weight on low-confident functional categories, for ex-ample, 5 and 6, in which the variants are more likely to be neutral/nonfunctional. Of note, as majority of the sliding windows only included variants in categories 5 and 6, this weighting scheme was moderately informative for those windows, largely letting the observed genotype and phenotype data determine the association strength.
Results
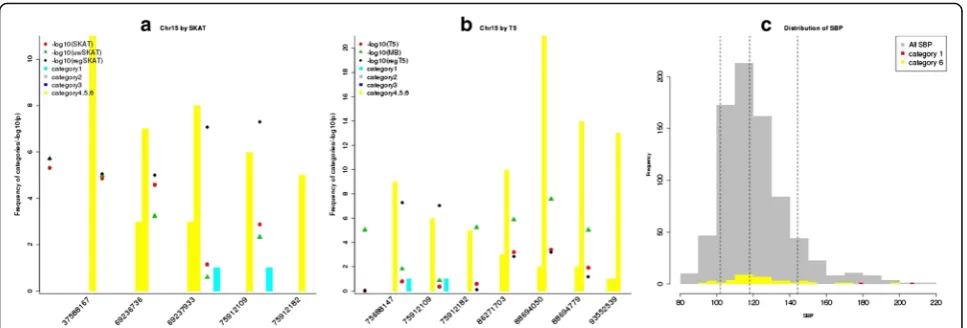
As shown in the Manhattan plots (Fig. 1), regSKAT and regT5 identified some sliding windows on chromosome 15 with p values lower than the genome-wide signifi-cance threshold, while thepvalues for these windows by other tests that did not incorporate the ENCODE/Poly-Phen2 information were far less significant. On the other hand, the MB T5 burden test also identified some genome-wide significant windows on chromosomes 13 and 15. We took a closer look at the significant sliding windows identified by regSKAT and regT5 on chromo-some 15. Figure 2 shows the distribution of the func-tional categories in sliding windows with at least 1 p value less than 105 among the 3 methods in each of the SKAT and T5 frameworks. In particular, we observed that the genome-wide significant sliding windows
centering at chr15:75912109 and chr15:75912182 in-cluded some variants in category 1, suggesting that the external biological information might have helped boost the signals. We further looked into the sliding window centering at chr15:75912109, which included a double-ton variant chr15:75913349 in category 1 and a few other variants in category 6. All the variants in this win-dow were annotated to geneSNUPN, standing for snur-portin 1, which has not been reported to be associated with blood pressure. It turned out that exonic variant chr15:75913349 was not annotated in RegulomeDB, but was annotated as a probably damaging nonsynonymous variant by PolyPhen2 with a confidence score of 99.2 %, resulting in category 1 in our weighting scheme. This variant was also predicted to be highly deleterious by several other functional prediction algorithms including sorting tolerant from intolerant (SIFT), likelihood ratio test (LRT), and MutationTaster [14]. As shown in the histogram in Fig. 2c, 2 individuals who were half-siblings and carriers of nonsynonymous variant chr15:75913349 had SBP of 179 and 208, respectively, with the latter close to the maximum observed SBP. Although the ef-fect sizes of the rest variants in this window were not as large as that of chr15:75913349, the carriers tended to have higher SBP. As all the variants increased the SBP, that is, in the same direction of effect size, regT5 was able to identify this sliding window as well. We noted that the MB T5 burden test also identified 2 significant sliding windows centering at chr13:96267813 (near gene
DZIP1) and chr15:88694779 (near gene NTRK3), re-spectively, although neither gene was reported to be as-sociated with blood pressure before. As all variants were assigned to low functional categories, that is, 5 and 6, in these windows, T5 and regT5 gave nonsignificant p
values of similar magnitudes (see Fig. 2b). A closer look revealed that these windows contained some rarer vari-ants, for example, doubletons, whose carriers tended to have higher SBP, favoring the assumption of the MB weighting scheme. This suggested that in the absence of informative external biological knowledge, the MAF might provide useful information.
To investigate if the proposed weighting scheme might increase the false-positive rate when there was no associ-ation, we used the simulated phenotypes provided by GAW19 to evaluate the type I error rate. We randomly selected 50 sliding windows on chromosome 15 that did not include any causal variants in the GAW19 simula-tion model. At the significance levelα= 0.05, the empir-ical type I error rates averaged over 50 sliding windows and 200 simulated phenotype sets were 0.0551, 0.0506, 0.0513, 0.0506, 0.0535, and 0.0467 for SKAT, uwSKAT, regSKAT, T5, MB, and regT5, respectively, suggesting that incorporating external biological information into existing RV association tests did not inflate the type I error.
Discussion
We have proposed a general framework to exploit exter-nal biological information in the aexter-nalysis of WGS data. We identified a genome-wide significant locus on chromosome 15 harboring a rare nonsynonymous vari-ant, while other methods without leveraging biological information did not identify it. This significant locus warrants following up and replication in future inde-pendent studies.
++ [16]. Given that these functional annotation systems are likely to be incomplete because of limited biological knowledge, they may provide complementary informa-tion and it would be of interest to integrate multiple functional scores simultaneously. In addition, alternative weighting schemes other than the one proposed here would be worth investigating regarding the power and Type I error rate.
In this study, we used the Bonferroni procedure to correct for multiple testing. Considering that the neigh-boring sliding windows overlapped with each other, the Bonferroni correction was very conservative, leading to reduced statistical power. Further research is warranted to estimate the effective number of tests in the sliding window framework. Finally, we adjusted the treatment effect on the SBP by simply including the medication use as a binary covariate in the regression framework; al-ternative adjustment methods as studied in Tobin et al. [17] are worth investigating.
Conclusions
In summary, we have proposed a general framework to incorporate the ENCODE and PolyPhen2 information into association tests of WGS data. We demonstrated the potential statistical power gains with the proposed method using the GAW19 WGS genotype and SBP phenotype data. Because it remains a challenge to analyze WGS data, it would be worth capitalizing on newly available biological knowledge in the proposed and alternative frameworks to maximize the power of genomic discovery.
Acknowledgements
This research was supported by the National Institutes of Health (NIH) grants R01HL116720. PW was also supported by NIH grants R01CA169122 and R21HL126032. The authors thank both reviewers for their constructive comments.
Declarations
This article has been published as part ofBMC ProceedingsVolume 10 Supplement 7, 2016: Genetic Analysis Workshop 19: Sequence, Blood Pressure and Expression Data. Summary articles. The full contents of the supplement are available online at http://bmcproc.biomedcentral.com/ articles/supplements/volume-10-supplement-7. Publication of the proceedings of Genetic Analysis Workshop 19 was supported by National Institutes of Health grant R01 GM031575.
Authors’contributions
PW conceived and designed the study. TK performed the analysis. PW and TK co-wrote the manuscript. Both authors read and approved the final manuscript.
Competing interests
The authors declare that they have no competing interests.
Published: 18 October 2016
References
1. Manolio TA, Collins FS, Cox NJ, Goldstein DB, Hindorff LA, Hunter DJ, McCarthy MI, Ramos EM, Cardon LR, Chakravarti A, et al. Finding the missing heritability of complex diseases. Nature. 2009;461(7265):747–53.
2. Lee S, Abecasis GR, Boehnke M, Lin X. Rare-variant association analysis: study designs and statistical tests. Am J Hum Genet. 2014;95(1):5–23. 3. Wu MC, Lee S, Cai T, Li Y, Boehnke M, Lin X. Rare-variant association testing
for sequencing data with the sequence kernel association test. Am J Hum Genet. 2011;89(1):82–93.
4. Pan W, Kim J, Zhang Y, Shen X, Wei P. A powerful and adaptive association test for rare variants. Genetics. 2014;197(4):1081–95.
5. Morrison AC, Voorman A, Johnson AD, Liu X, Yu J, Li A, Muzny D, Yu F, Rice K, Zhu C, et al. Whole-genome sequence-based analysis of high-density lipoprotein cholesterol. Nat Genet. 2013;45(8):899–901.
6. Adzhubei IA, Schmidt S, Peshkin L, Ramensky VE, Gerasimova A, Bork P, Kondrashov AS, Sunyaev SR. A method and server for predicting damaging missense mutations. Nat Methods. 2010;7(4):248–9.
7. Hu H, Huff CD, Moore B, Flygare S, Reese MG, Yandell M. VAAST 2.0: improved variant classification and disease-gene identification using a conservation-controlled amino acid substitution matrix. Genet Epidemiol. 2013;37(6):622–34.
8. Price AL, Kryukov GV, de Bakker PI, Purcell SM, Staples J, Wei LJ, Sunyaev SR. Pooled association tests for rare variants in exon-resequencing studies. Am J Hum Genet. 2010;86(6):832–8.
9. Wei P, Liu X, Fu YX. Incorporating predicted functions of nonsynonymous variants into gene-based analysis of exome sequencing data: a comparative study. BMC Proc. 2011;5(Suppl 9):S20.
10. Kellis M, Wold B, Snyder MP, Bernstein BE, Kundaje A, Marinov GK, Ward LD, Birney E, Crawford GE, Dekker J, et al. Defining functional DNA elements in the human genome. Proc Natl Acad Sci U S A. 2014;111(17):6131–8. 11. Maurano MT, Humbert R, Rynes E, Thurman RE, Haugen E, Wang H,
Reynolds AP, Sandstrom R, Qu H, Brody J, et al. Systematic localization of common disease-associated variation in regulatory DNA. Science. 2012; 337(6099):1190–5.
12. Boyle AP, Hong EL, Hariharan M, Cheng Y, Schaub MA, Kasowski M, Karczewski KJ, Park J, Hitz BC, Weng S, et al. Annotation of functional variation in personal genomes using RegulomeDB. Genome Res. 2012;22(9): 1790–7.
13. Chen H, Meigs JB, Dupuis J. Sequence kernel association test for quantitative traits in family samples. Genet Epidemiol. 2013;37(2):196–204. 14. Dong C, Wei P, Jian X, Gibbs R, Boerwinkle E, Wang K, Liu X. Comparison
and integration of deleteriousness prediction methods for nonsynonymous SNVs in whole exome sequencing studies. Hum Mol Genet. 2015;24(8): 2125–37.
15. Kircher M, Witten DM, Jain P, O’Roak BJ, Cooper GM, Shendure J. A general framework for estimating the relative pathogenicity of human genetic variants. Nat Genet. 2014;46(3):310–5.
16. Davydov EV, Goode DL, Sirota M, Cooper GM, Sidow A, Batzoglou S. Identifying a high fraction of the human genome to be under selective constraint using GERP++. PLoS Comput Biol. 2010;6(12):e1001025. 17. Tobin MD, Sheehan NA, Scurrah KJ, Burton PR. Adjusting for treatment
effects in studies of quantitative traits: antihypertensive therapy and systolic blood pressure. Stat Med. 2005;24(19):2911–35.
• We accept pre-submission inquiries
• Our selector tool helps you to find the most relevant journal
• We provide round the clock customer support
• Convenient online submission
• Thorough peer review
• Inclusion in PubMed and all major indexing services
• Maximum visibility for your research
Submit your manuscript at www.biomedcentral.com/submit