570 | P a g e
SOME STUDIES ON INVESTIGATING THE CONCEPT
OF PERFORMING EXPERIMENTALLY EDM PROCESS
PARAMETERS THROUGHOUT THE MACHINING OF
HIGH CARBON HIGH CHROMIUM D2 TOOL STEEL
THROUGH A TAGUCHI ORTHOGONAL ARRAY
APPROACH.
Shubham Sharma
1, Mandeep Singh
2, Shalab Sharma
31,2
PG Research Scholar, Mechanical Engineering, DAV University, ( India)
3
UG Research Scholar, CT Institute of Technology, ( India)
ABSTRACT
This study presents analysis of different parameters of EDM. In this work four parameters Current, Voltage, Pulse
Off time and Pulse On time are varied. L9 orthogonal array is used. MRR and surface roughness are calculated
after experiments. F test is applied and plots for MRR, TWR and SR are constructed. In this study the tool comes out
factor which has maximum effect on all three outputs. The current comes out to be second most important factor.
Value of current is directly proportional to MRR, TWR and SR. The work pieces are mainly significant in Surface
roughness.
Keywords: EDM, MRR, Surface Roughness & TWR
I INTRODUCTION
Electrical discharge machining (EDM) is a thermal process with a complex metal-removal mechanism, involving the
formation of a plasma channel between the tool and work piece [1]. It has proved especially valuable in the
machining of super-tough, electrically conductive materials such as the new space-age alloys that are difficult to
machine by conventional methods [2]. The word unconventional is used in sense that the metal like tungsten,
hardened stainless steel tantalum, some high strength steel alloys etc. are such that they can’t be machined by
conventional method but require some special technique . The conventional methods in spite of recent advancements
are inadequate to machine such materials from stand point of economic Production [3]. In EDM process there are
large number of parameters which affect MRR and TWR. A number of input process parameters can be varied in the
EDM process. Each parameter has its own impact on output parameters such as material.
Important Parameters of EDM are written as follows:
571 | P a g e
b. Spark off-time (Toff): The duration of time in between the sparks generated. During this time the moltenmaterial gets removed from the gap between the electrode and the workpiece.
c. Voltage (V): It is the potential difference applied between the electrode and the workpiece.
d. Discharge Current (Ip): It is the current flowing through the electrode and is measured in amp.
e. Duty cycle (τ): It is the ratio of Ton divided by total cycle time (Ton+Toff).
f. Tool: It is act as an electrode and produce mirror image on the workpiece.
II LITERATURE REVIEW
A. Adan. [4] Investigated both conventional and non-conventional machining process to machining the Al 6061
MMC. Result showed that the surface roughness quality and hardness of material is directly affected by the
machining process and it also overripe the microstructure of material, it was concluded that non-conventional
techniques are effectively used where no microstructure changed.
V. Balasubramanium et al. [1] conducted an experimental work on EDM at different parameters to determine the
optimization and performance of AL MMC (Aluminum metal matrix composite). Response surface methodology
was used to prepare the experiments sheet. They observed the responses (MRR, TWR, SR and CY) are directly
affected by varying the process parameters (peak current, T-on, flushing pressure & particles sizes) and notified that
the mathematical models give a better result for our responses parameters.
C. Velmurugan et al. [3] investigated the impact of process variables (T-on, Current, Voltage and flushing pressure)
of EDM in the appearance of responses such as MRR, TWR and SR during the machining of AL MMC which
reinforced by particles of silicon carbide (10%) and graphite(4%). They calculated the significant effect and
performances in the terms of responses with respect to process variable.
J.K Pushpendra et al. [5] reported the superior mechanical properties of AL MMC in comparison to other metals and
materials. They studied the effect of machining of AL MMC during conventional and non-conventional machining
process. They observed the irregular reinforcement make a material non-homogeneous and anisotropic in nature but
by genuine compositions we make it better both as technically and economically.
D.Shravani.et al. [6] analyzed Taguchi L9 orthogonal array technique. To examine the outcomes of process
parameters at their different levels the Taguchi experimental design was stipulated. They observed that Taguchi
engaged at least no of trails from the actual no of combinations, in trails the parameters are arranged at their
572 | P a g e
III MATERIAL AND METHOD
3.1 Material
In this experimental work a high carbon high chromium D2 Tool Steel material is used which consist of Carbon
varying from 1.55 to 1.75%, Manganese varying from .20 to 0.40%, Silicon varying from 0.25 to 0.40%,
Molybdenum varying from 0.50 to 0.70%, Chromium varying from 11 to 12%, Vanadium varying from 0.10 to
0.50% and Tungsten varying from 0.40 to 0.60%.These steels retain their hardness up to a temperature of 425 °C
(797 °F). Common applications for these tool steels include forging dies, die-casting die blocks, and drawing dies.
Due to their high chromium content, certain high carbon high chromium-type tool steels are often considered
stainless or semi-stainless, however their corrosion resistance is very limited due to the precipitation of the majority
of their chromium and carbon constituents as carbides. It is very wear resistant but not as tough as lower alloyed
steels. The mechanical properties of high carbon high chromium are very sensitive to heat treatment. It is widely
used for the production of shear blades, planer blades and industrial cutting tools; sometimes used for knife blades.
The physical and mechanical properties of high carbon high chromium steel is under:-
Physical properties Metric Imperial
Density 7.7 x 1000 kg/m3 0.278 lb/in3
Melting point 1421°C 2590°F
Mechanical Properties Metric Imperial
Hardness, Knoop (converted from Rockwell C hardness) 769 769
Hardness, Rockwell C 62 62
Hardness, Vickers 748 748
Izod impact unnotched 77.0 J 56.8 ft-lb
Poisson's ratio 0.27-0.30 0.27-0.30
Elastic modulus 190-210 GPa 27557-30457 ksi
3.2 Method
In this experimental study we suggest the four different factors (process parameters) up to their three levels.
Table.1shown the proposed machine process parameters and their levels .
Table.1: Machining parameters and their levels.
Parameters Units Level 1 Level 2 Level 3
Current A 8 10 12
Voltage V 6 8 10
Pulse-on time µs 10 20 30
573 | P a g e
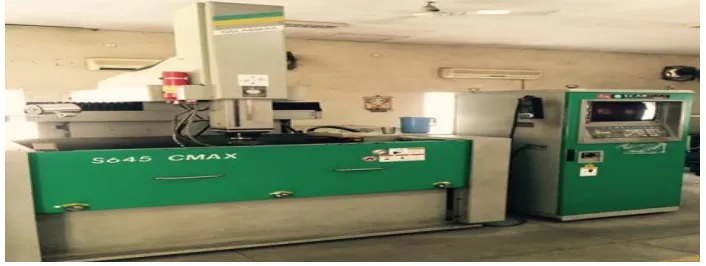
Figure.1: Electric Discharge Machine Setup
This experimental work was carried out on Oscar Max EDM machine (Taiwan made) shown in Figure.. The
specifications of EDM machine are shown in Table.2. In this experimental work the EDM oil is used as the
dielectric fluid (specific gravity – 0.763) in which both work piece and tool are immersed and it also sprinkled
between the gap of work piece and tool. A fabricated Aluminum based metal matrix composite (AL
6061+8%Sic+3%graphite) is used as a work piece and a copper rod of 12mm (Ø) is used as an electrode.
Table.2: Specification of EDM.
Pulse-on time 2-1800 µs
Pulse-off time 2-1000 µs
Current 0-120 amp
Voltage 1-16 V
Table size 1000 mm (L), 600 mm (W)
Tank size 1500 mm (L), 940 mm(w), 520 mm (H)
Outside dimensions 1720 mm (L), 1800 mm (W), 2610 mm (H)
Max. electrode weight 250 Kg
Max. work piece weight 2000 Kg
Response variables are the response parameters which give the performance of the machine and they are affected
with the input parameters. Design variables selected for the experimentation were:
(i) MRR (Material Removal Rate)
(ii) SR (Surface Roughness)
Evaluation of MRR
574 | P a g e
MRR (mg/sec) =Wbm = weight of work piece before machining (gm)
Wam = weight of work piece after machining (gm)
Mt = total time of machining of each trail (sec)
Figure.2: Weighing Machine Image
Evaluation of SR
The surface roughness of the work-piece was expressed in arithmetic average (Ra). Ra is the arithmetic average
roughness of the deviations of the roughness profile from the central line of the measurement. In this work, the
surface roughness was calculated by Precise surface roughness tester.
Figure.3: Surface Roughness tester image
The nine experiments which are performed they were designed into Taguchi orthogonal array L9 by using Design
expert 9.0.6 software. These nine experiments display the combinations between process parameters at where we
calculated our responses (MRR and SR) which are necessary to improve the productivity and quality.
IV TAGUCHI ORTHOGONAL ARRAY L9 (3˄4)
Taguchi is one of the types of factorial design. In this design different no of factors and their levels are available.
The taguchi make our design more flexible with less complexibility. In this paper we use orthogonal array L9 to
575 | P a g e
expression is constructed in design expert 9.0.6 by using the experimental data. The regression model is representedas Y = f (Pon,Poff,V,C)
This expression represents the relationship between the response (dependent) variable and parameters (independent)
variables. Here “Y” is represented our required response and “f” is represented the function of process parameters.
By using orthogonal array L9 (3˄4) the design sheet for experimental work shown in Table.4.2.
Table.3: Design sheet with responses.
RUN CURRENT(A) VOLTAGE T-ON (µs) T-OFF (µs) MRR SR
1 12 6 30 45 1.75 3.5
2 10 8 30 20 1.68 3.96
3 12 10 20 20 1.55 4.61
4 8 10 30 60 1.59 4.2
5 10 10 10 45 1.38 4.44
6 10 6 20 60 1.33 3.73
7 12 8 10 60 1.24 3.98
8 8 6 10 20 1.21 3.48
9 8 8 20 45 1.36 4.49
V MATHEMATICAL MODELS
The mathematical models disclose the effect of parameters on our desire response. At here it proves that the
pulse-on time give a significant effect pulse-on resppulse-onses (MRR and SR) as compared to other parameters.
5.1: Material Removal Rate
An empirical relationship between the response and the independent variables has been expressed by the following
quadratic model Adsorption:
MRR = +1.45 -0.18 * C [1] -0.041* C [2]
576 | P a g e
Analysis of variance has been calculated to analyze the accessibility of the model. The analysis of variance for theresponse has been encapsulated in Table.4.
Table.4: ANOVA-Analysis of Variance
ANOVA for selected factorial model
Analysis of variance table [Classical sum of squares - Type II]
Sum of Mean F p-value
Source Squares Df Square Value Prob > F
Model 0.24 2 0.12 12.64 0.0071 Significant
C-on 0.24 2 0.12 12.64 0.0071
Residual 0.058 6 9.633E-003
Cor Total 0.30 8
Std. Dev. 0.098 R-Squared 0.8082
Mean 1.45 AdjR-Squared 0.7443
C.V. % 6.75 PredR-Squared 0.5685
PRESS 0.13 Adeq Precision 7.000
Now again to confirm the credibility of developed sample, in “minitab17” we draw the following 3-D graphs to
577 | P a g e
122 .
1 10
1.4 1.6 0 . 6 .8 1 5 . 7 8
9 0. 5 . 0 1 R R M t n e r r u c e g a t l o v
urface Plot of MRR vs current, volta
S ge
2 1
2 .
1 10
1 4. 1.6 0 1 1.8 0 2 8 0 3 R R M t n e r r u c e m i t -n o
urface Plot o
S f MRR vs current, on-time
2 1
2 .
1 10
4 . 1 1.6 0 2 1.8 0 4 8 0 6 R R M t n e r r u c e m i t -f f o urface Plo
S t of MRR vs current, off-time
30 0 0 2 . 1 2
1 4. 1.6 2 1.8 0 4 10 0 6 R R M e m i t -n o e m i t -f f o
urface Plot of MRR s
S v on-time, off-time
30
2 .
1 20
1.4 1.6 0 . 6 1.8 5 . 7 10 9.0 0.5 1 R R M e m i t -n o e g a t l o v
urface Plot o
S f MRR vs on-time, voltage
60
.
1 2 40
1.4 .6 1 0 . 6 8 1. 5 . 7 20 9.0 0.5 1 R R M e m i t -f f o e g a t l o v
urface Plot of MR
S R s off-time, voltagev
From these 3-D model graphs it confirmed that the “Pulse-on time” and “Current” both has the main two parameters
578 | P a g e
5.1.1 Confirmatory Test
For further support of optimized data which is analyzed under optimum parametric values, the confirmatory test is
applied which results are shown as under. The both confirmatory test and calculated results are shown in Table.5.
Table.5: shows the confirmatory results and calculated results
Predicted solutions
Number on time off time voltage Current MRR Desirability
1 30 20 6 8 1.693 0.858 Selected
Experimental results
Number on time off time voltage Current MRR Desirability
1 30 20 8 10 1.68 0.808
5.2: Surface Roughness
An empirical relationship between the response and the independent variables has been expressed by the following
quadratic model Adsorption:
SR = +4.04 -0.47 * B[1] +0.10 * B[2]
R2 = 0.7866
Analysis of variance has been calculated to analyze the accessibility of the model. The analysis of variance for the
response has been encapsulated in Table.6.
Table.6: ANOVA-Analysis of Variance
ANOVA for selected factorial model
Analysis of variance table [Classical sum of squares - Type II]
Sum of Mean F p-value
Source Squares Df Square Value Prob > F
Model 1.12 2 0.56 11.06 0.0097 Significant
579 | P a g e
Residual 0.30 6 0.051
Cor Total 1.42 8
Std. Dev. 0.23 R-Squared 0.7866
Mean 4.04 Adj R-Squared 0.7155
C.V. % 5.57 Pred R-Squared 0.5198
PRESS 0.68 Adeq Precision 6.516
Now again to confirm the credibility of developed sample, in “minitab17” we draw the following 3-D graphs to
examine that which process parameter mostly affected our response variable (SR).
2 1 5 . 3 0 1 4 0.
0 . 6 5 . 4 5 . 7 8 0 . 9 5 . 0 1 R S t n e r r u c e g a t l o v
urface Plot of SR
S vs current, voltage
12 3.5 0 1 4.0 0 1 4.5 0 2 8 0 3 R S t n e r r u c e m i t -n o urfac
S e Plot of SR vs current, on-time
30 3.5 0 2 4.0 0 2 4.5 0
4 10
0 6 R S e m i t -n o e m i t -f f o
urface Plot of SR vs
S on-time, off-time
2 1 3.5 0 1 0 . 4 0 2 5 . 4 40 8 0 6 R S t n e r r u c e m i t -f f o urf
580 | P a g e
0 3 5 . 3 0 2 4.0 0 . 6 4.5 5 . 7 10 0 . 9 5 . 0 1 R S e m i t -n o e g a t l o vurface Plot of SR vs on-time, voltage S 60 5 . 3 40 4.0 0 . 6 4.5 5 .
7 20
9.0 .5 0 1 R S e m i t -f f o e g a t l o v
urface Plot of
S SR vs off-time, voltage
From these 3-D model graphs it confirmed that the “Pulse-on time” and “Current” both has the main two parameters
which affect our response SR directly.
5.2.1: Confirmatory Test
For further support of optimized data which is analyzed under optimum parametric values, the confirmatory test is
applied which results are shown as under. The both confirmatory test and calculated results are shown in Table.7.
Table.7: shows the confirmatory results and calculated results
Predicted solutions
Number on time off time voltage current SR Desirability
1
30
20
6
8
3.470
0.889
SelectedExperimental results
Number on time off time voltage Current SR Desirability
1 10 20 6 8 3.48 0.786
VI CONCLUSION
The objective of this study was to explore the optimum process conditions, using Taguchi L9 approach, the
581 | P a g e
1) Metal removal rate of the work piece increases with increase in current and pulse on time, the maximum MRRwas found out on pulse-on time 30µs, pulse-off time 45µs, voltage6V, current 12A.
2) Surface roughness during the electric discharge machining increases with increase in current and pulse on time,
the minimum SR was found out on pulse-on time 10µs, pulse-off time 20µs, voltage6V, current 8A.
3) It is found that all the four machining parameters have significant effect on the response variables considered in
the present study.
REFERENCES
[1] V.Balasubramanium, N.Barkes and C.S.Narayanan. “Effect of process parameters on the electrical discharge machining of Aluminium metal matrix composites through a response surface methodology apparoach.” Sci Eng
ComposMater 2014.
[2] M.K Das, K.Kumar, T.K Barman, P.Sahoo. “Optimization of surface roughness and MRR in EDM using WPCA.” procedia engineering Vol64, 2013, pp 446-455.
[3] C.Velmurgan, R.Subramaniam, S.Thiruganam, B.Ananadavel. “Experimental investigation on machining
characteristics of AL6061 hybrid metal matrix composite processed by electrical discharge machining.”
International journal of energy ,science and technology.Vol3, 2011, pp87-101.
[4] A.Adan. “The effect of cutting process on surface microstructure and hardness of pure and Al 6061 aluminium
alloy” Engineering source and technology, an international journal Vol18, 2015, pp303-308.
[5] J.K.Puspendra . “Review on machining of aluminium in metal matrix composite” material science research india,
vol11, 2014, pp114-120.
[6] D.Sharavani, P.K.Lakshmi. “Prepration and optimization of various parameters of entric coated pellels using the