9 | P a g e
RESPONSE OF R C FRAME STRUCTURES RESTING
ON RAFT FOUNDATION USING E-TABS
Prof. Mahadeva M
1, Sindhu P
2,Venkatadri E
31
Asst.Professor,
2,3U G Students
Department of Civil Engineering, Shri Pillappa College of Engineering, Bangalore (India)
ABSTRACT
ETABS stands for Extended hree dimensional Analysis of Building Systems. ETABS is commonly used to analyze: Skyscrapers, parking garages, steel & concrete structures, low and high rise buildings, and portal frame structures. ETABS was used to create the mathematical model of the Burj Khalifa, designed by Skidmore, Owings and Merrill LLP (SOM). The input, output and numerical solution techniques of ETABS are specifically designed to take advantage of the unique physical and numerical characteristics associated with building type structures. On ETABS we can analyse and design any shape of R.C.C buildings like rectangular. In this project, we mainly emphasizes on structural behaviour of multi-storey building for different plan configurations like T-shape and L-T-shape. Modelling of 10- storeys R.C.C. framed building is done on the ETABS Software for analysis. Post analysis of the structure, maximum shear forces, bending moments, and maximum storey displacement are computed and then compared for all the analyzed cases.
Keywords: Earthquake, Foundation, Soil Structure Interaction.
I. INTRODUCTION
Over the past 40 years, considerable progress has been made in understanding the nature of earthquakes and
how they damage structures, and in improving the seismic performance of the built environment. However,
much remains unknown regarding the prevention or mitigation of earthquake damage in worldwide, leaving
room for further studies. During past and recent earthquakes, it is realized that the soil-structure interaction
(SSI) effects play an important role in determining the behaviour of building structures. The experienced
seismic excitation can be considered as function of the fault rupture mechanism, travel path effects, local site
effects, and SSI effects. Irrespective of the structure, the local soil conditions can dramatically influence the
earthquake motion from the bedrock level to the ground surface, through their dynamic filtering effects. One
example is the 1985 Mexico City earthquake where deep soft soils amplified the ground motion and modified
the frequency of ground shaking. Similar behaviour was observed during the 1989 Loma Prieta earthquake, in
which the sections of the Cypress freeway in Oakland collapsed due to the soil-related motion amplification.
The seismic soil structure interaction of multi-story buildings becomes very important after the destruction of
recent major earthquakes. For the structure founded on the soil, the motion of the base of the structure will be
different from the case of fixed base, because of the coupling of the structure-soil system. It is true that taking
the soil into account when calculating the seismic response of the structure does complicate the analysis
considerably. It also makes it necessary to estimate additional key parameters, which are difficult to determine,
10 | P a g e
ETABS is a sophisticated, yet easy to use, special purpose analysis and design program developed specificallyfor building systems. ETABS features an intuitive and powerful graphical interface coupled with unmatched
modeling, analytical, design, and detailing procedures, all integrated using a common database. Although quick
and easy for simple structures, ETABS can also handle the largest and most complex building models, including
a wide range of nonlinear behaviors necessary for Performance based design, making it the tool of choice for
structural engineers in the building industry.
12 | P a g e
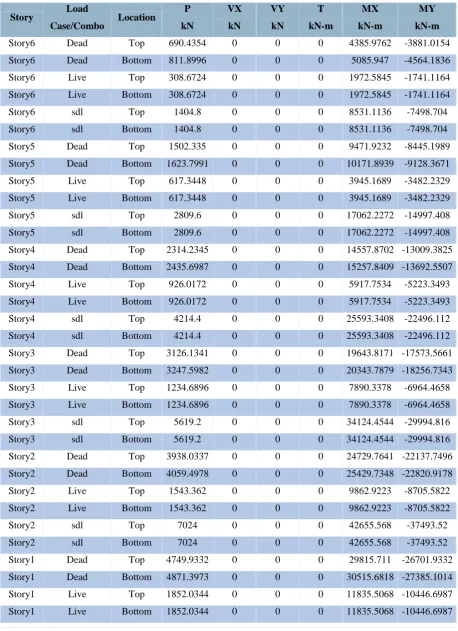
III. RESULTS
Table 5.3 - Story Forces
Story Load
Case/Combo Location
P
kN
VX
kN
VY
kN
T
kN-m
MX
kN-m
MY
kN-m
Story6 Dead Top 690.4354 0 0 0 4385.9762 -3881.0154
Story6 Dead Bottom 811.8996 0 0 0 5085.947 -4564.1836
Story6 Live Top 308.6724 0 0 0 1972.5845 -1741.1164
Story6 Live Bottom 308.6724 0 0 0 1972.5845 -1741.1164
Story6 sdl Top 1404.8 0 0 0 8531.1136 -7498.704
Story6 sdl Bottom 1404.8 0 0 0 8531.1136 -7498.704
Story5 Dead Top 1502.335 0 0 0 9471.9232 -8445.1989
Story5 Dead Bottom 1623.7991 0 0 0 10171.8939 -9128.3671
Story5 Live Top 617.3448 0 0 0 3945.1689 -3482.2329
Story5 Live Bottom 617.3448 0 0 0 3945.1689 -3482.2329
Story5 sdl Top 2809.6 0 0 0 17062.2272 -14997.408
Story5 sdl Bottom 2809.6 0 0 0 17062.2272 -14997.408
Story4 Dead Top 2314.2345 0 0 0 14557.8702 -13009.3825
Story4 Dead Bottom 2435.6987 0 0 0 15257.8409 -13692.5507
Story4 Live Top 926.0172 0 0 0 5917.7534 -5223.3493
Story4 Live Bottom 926.0172 0 0 0 5917.7534 -5223.3493
Story4 sdl Top 4214.4 0 0 0 25593.3408 -22496.112
Story4 sdl Bottom 4214.4 0 0 0 25593.3408 -22496.112
Story3 Dead Top 3126.1341 0 0 0 19643.8171 -17573.5661
Story3 Dead Bottom 3247.5982 0 0 0 20343.7879 -18256.7343
Story3 Live Top 1234.6896 0 0 0 7890.3378 -6964.4658
Story3 Live Bottom 1234.6896 0 0 0 7890.3378 -6964.4658
Story3 sdl Top 5619.2 0 0 0 34124.4544 -29994.816
Story3 sdl Bottom 5619.2 0 0 0 34124.4544 -29994.816
Story2 Dead Top 3938.0337 0 0 0 24729.7641 -22137.7496
Story2 Dead Bottom 4059.4978 0 0 0 25429.7348 -22820.9178
Story2 Live Top 1543.362 0 0 0 9862.9223 -8705.5822
Story2 Live Bottom 1543.362 0 0 0 9862.9223 -8705.5822
Story2 sdl Top 7024 0 0 0 42655.568 -37493.52
Story2 sdl Bottom 7024 0 0 0 42655.568 -37493.52
Story1 Dead Top 4749.9332 0 0 0 29815.711 -26701.9332
Story1 Dead Bottom 4871.3973 0 0 0 30515.6818 -27385.1014
Story1 Live Top 1852.0344 0 0 0 11835.5068 -10446.6987
13 | P a g e
Story LoadCase/Combo Location
P kN VX kN VY kN T kN-m MX kN-m MY kN-m
Story1 sdl Top 8428.8 0 0 0 51186.6816 -44992.224
Story1 sdl Bottom 8428.8 0 0 0 51186.6816 -44992.224
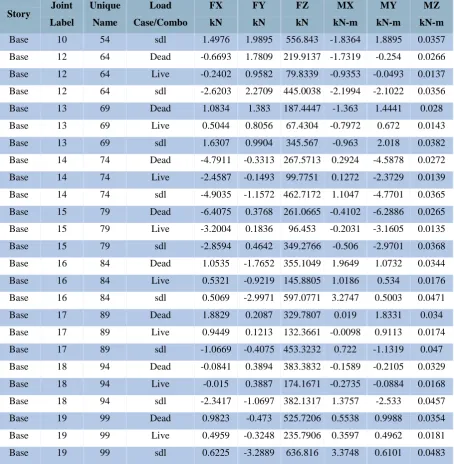
Point Results
Table 5.4 - Joint Reactions
Story Joint Label Unique Name Load Case/Combo FX kN FY kN FZ kN MX kN-m MY kN-m MZ kN-m
Base 1 9 Dead 6.108 -2.1275 266.9519 2.259 5.2993 0.0216
Base 1 9 Live 2.9392 -1.0493 97.1617 1.1146 2.5112 0.0113
Base 1 9 sdl 10.5674 -3.4441 562.1689 3.6263 9.2864 0.0274
Base 2 14 Dead -3.3546 -3.7054 259.6216 3.8846 -3.4606 0.0247
Base 2 14 Live -1.6329 -1.8023 93.7205 1.8847 -1.6915 0.0127
Base 2 14 sdl -5.8134 -6.2118 538.9002 6.4422 -5.9743 0.0349
Base 3 19 Dead 0.4446 0.1352 430.4639 0.1469 0.3831 0.0253
Base 3 19 Live 0.0803 -0.1692 182.4556 0.2943 0.046 0.0129
Base 3 19 sdl 2.6006 5.4183 550.9258 -4.8495 2.4835 0.0355
Base 4 24 Dead -2.4429 -1.4604 196.5145 1.2386 -2.4908 0.027
Base 4 24 Live -1.0794 -0.6964 61.7661 0.5727 -1.1084 0.0137
Base 4 24 sdl -4.826 -1.4448 407.277 1.1723 -4.904 0.0404
Base 5 29 Dead -0.4957 2.5894 155.6266 -2.7049 -0.4142 0.029
Base 5 29 Live -0.2504 1.2184 45.3185 -1.2923 -0.2124 0.0147
Base 5 29 sdl -0.8741 5.1511 355.7823 -5.239 -0.7809 0.0413
Base 6 34 Dead 0.7031 1.617 154.3588 -0.8319 0.7771 0.0257
Base 6 34 Live 0.3213 0.6784 42.3658 -0.2923 0.3557 0.0133
Base 6 34 sdl 1.3613 4.0924 375.2358 -2.9386 1.4397 0.0335
Base 7 39 Dead 2.1911 0.7214 270.4104 -0.5718 1.8408 0.0248
Base 7 39 Live 1.2249 0.3624 100.0989 -0.2882 1.024 0.0128
Base 7 39 sdl 1.6718 1.1267 557.3542 -0.9153 1.1177 0.0338
Base 8 44 Dead 1.1321 -0.1637 162.0195 0.3088 1.0485 0.0258
Base 8 44 Live 0.5335 -0.0966 46.1719 0.1684 0.4734 0.0132
Base 8 44 sdl 2.2846 -0.0435 396.7359 0.249 2.0382 0.0356
Base 9 49 Dead 1.6908 -0.7331 192.1974 0.8746 1.7197 0.0262
Base 9 49 Live 0.8373 -0.3345 60.0591 0.4049 0.8342 0.0134
Base 9 49 sdl 2.562 -1.439 455.6642 1.6357 2.4882 0.0363
Base 10 54 Dead 0.9734 1.5578 253.2471 -1.4492 1.3387 0.0262
14 | P a g e
Story JointLabel Unique Name Load Case/Combo FX kN FY kN FZ kN MX kN-m MY kN-m MZ kN-m
Base 10 54 sdl 1.4976 1.9895 556.843 -1.8364 1.8895 0.0357
Base 12 64 Dead -0.6693 1.7809 219.9137 -1.7319 -0.254 0.0266
Base 12 64 Live -0.2402 0.9582 79.8339 -0.9353 -0.0493 0.0137
Base 12 64 sdl -2.6203 2.2709 445.0038 -2.1994 -2.1022 0.0356
Base 13 69 Dead 1.0834 1.383 187.4447 -1.363 1.4441 0.028
Base 13 69 Live 0.5044 0.8056 67.4304 -0.7972 0.672 0.0143
Base 13 69 sdl 1.6307 0.9904 345.567 -0.963 2.018 0.0382
Base 14 74 Dead -4.7911 -0.3313 267.5713 0.2924 -4.5878 0.0272
Base 14 74 Live -2.4587 -0.1493 99.7751 0.1272 -2.3729 0.0139
Base 14 74 sdl -4.9035 -1.1572 462.7172 1.1047 -4.7701 0.0365
Base 15 79 Dead -6.4075 0.3768 261.0665 -0.4102 -6.2886 0.0265
Base 15 79 Live -3.2004 0.1836 96.453 -0.2031 -3.1605 0.0135
Base 15 79 sdl -2.8594 0.4642 349.2766 -0.506 -2.9701 0.0368
Base 16 84 Dead 1.0535 -1.7652 355.1049 1.9649 1.0732 0.0344
Base 16 84 Live 0.5321 -0.9219 145.8805 1.0186 0.534 0.0176
Base 16 84 sdl 0.5069 -2.9971 597.0771 3.2747 0.5003 0.0471
Base 17 89 Dead 1.8829 0.2087 329.7807 0.019 1.8331 0.034
Base 17 89 Live 0.9449 0.1213 132.3661 -0.0098 0.9113 0.0174
Base 17 89 sdl -1.0669 -0.4075 453.3232 0.722 -1.1319 0.047
Base 18 94 Dead -0.0841 0.3894 383.3832 -0.1589 -0.2105 0.0329
Base 18 94 Live -0.015 0.3887 174.1671 -0.2735 -0.0884 0.0168
Base 18 94 sdl -2.3417 -1.0697 382.1317 1.3757 -2.533 0.0457
Base 19 99 Dead 0.9823 -0.473 525.7206 0.5538 0.9988 0.0354
Base 19 99 Live 0.4959 -0.3248 235.7906 0.3597 0.4962 0.0181
Base 19 99 sdl 0.6225 -3.2889 636.816 3.3748 0.6101 0.0483
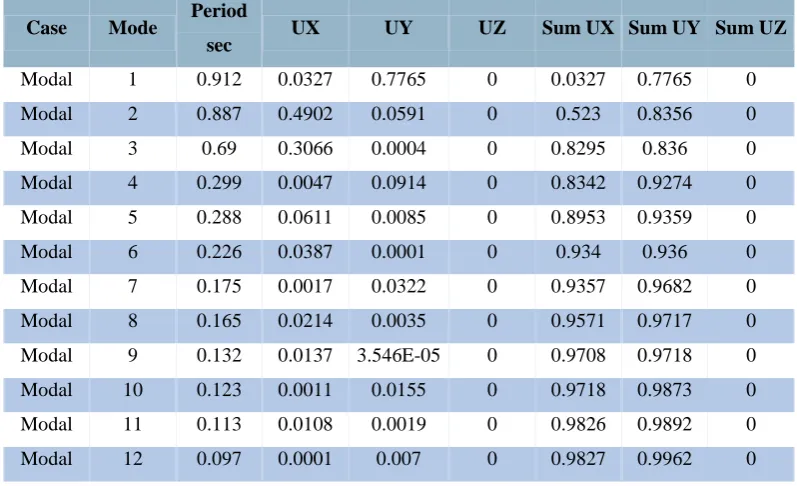
IV. MODAL RESULTS
Table 5.5 - Modal Periods and Frequencies
Case Mode Period sec Frequency cyc/sec Circular Frequency rad/sec Eigenvalue rad²/sec²
Modal 1 0.912 1.097 6.8916 47.4947
Modal 2 0.887 1.127 7.0806 50.1349
Modal 3 0.69 1.449 9.1026 82.8567
Modal 4 0.299 3.342 20.9985 440.9372
15 | P a g e
Case Mode Periodsec
Frequency
cyc/sec
Circular
Frequency
rad/sec
Eigenvalue
rad²/sec²
Modal 6 0.226 4.422 27.7855 772.0314
Modal 7 0.175 5.72 35.9388 1291.5954
Modal 8 0.165 6.075 38.1723 1457.1212
Modal 9 0.132 7.592 47.7043 2275.7018
Modal 10 0.123 8.12 51.0202 2603.0563
Modal 11 0.113 8.834 55.506 3080.9128
Modal 12 0.097 10.348 65.0159 4227.0681
Table 5.6 - Modal Participating Mass Ratios (Part 1 of 2)
Case Mode Period
sec UX UY UZ Sum UX Sum UY Sum UZ
Modal 1 0.912 0.0327 0.7765 0 0.0327 0.7765 0
Modal 2 0.887 0.4902 0.0591 0 0.523 0.8356 0
Modal 3 0.69 0.3066 0.0004 0 0.8295 0.836 0
Modal 4 0.299 0.0047 0.0914 0 0.8342 0.9274 0
Modal 5 0.288 0.0611 0.0085 0 0.8953 0.9359 0
Modal 6 0.226 0.0387 0.0001 0 0.934 0.936 0
Modal 7 0.175 0.0017 0.0322 0 0.9357 0.9682 0
Modal 8 0.165 0.0214 0.0035 0 0.9571 0.9717 0
Modal 9 0.132 0.0137 3.546E-05 0 0.9708 0.9718 0
Modal 10 0.123 0.0011 0.0155 0 0.9718 0.9873 0
Modal 11 0.113 0.0108 0.0019 0 0.9826 0.9892 0
Modal 12 0.097 0.0001 0.007 0 0.9827 0.9962 0
V. CONCLUSION
From our results obtained from the analyses outputs, the elements are in accordance to our objectives of the
study which are:
1. The dead, live and floor finish loads obtained by the ETABS are similar to the manually calculated values
2. Analysis of the structural integrity of these buildings in withstanding the design earthquake loadings was
conducted and was judged to be safe.
3. The way forward will be to conduct studies on different shapes and geometrical configurations and to see the
variations as the study we conducted only included irregular L shape, and T shape configurations.
4. Various important results like bending moments, shear force, and deflection results are compared for the
irregular configurations.
5. In this project along with the analysis results, the design values are included for both the unsymmetrical
16 | P a g e
REFERANCE:
Soil structure interaction effects on seismic response on multi-storied buildings on raft foundation.
By, SHEHATA .E ABDEL RAHEEM.
Studies on soil structure interaction of multi-storeyed buildings with rigid and flexible foundation.
By, R.M.JENIFER PRIYANKA.
Effects of soil structure interaction in seismic response of building resting on elevated surface.
By,PROF. L.R. WANKHADE.
Soil structure interaction effect on dynamic behaviour of 3D building frames with raft footing.
By, KULADEEPU .M.
Analysis and Design of a G+10 Residential Building using ETABS
By, GOLAKOTI SURYA KARTEEK
BIOGRAPHAICAL DATA
Prof. Mahadeva M is working as assistant professor in civil engineering department form last 2 years and he also worked as assistant professor in k s institute of technology. He is national advisory board member for international conference and he secured a “Active Young
Researcher Award” from AR Research Publication and Conference World for your continuous
contribution in the research field for shaping up the new era and He received is B E in civil engineering and M.Tech with specialization in CAD structures from visvesvaraya technological university. His research interest is in the field of soil structure interaction, structural engineering, earth quake engineering.
UG STUDENT
SHRI PILLAPPA COLLEGE OF ENGINEERING
UG STUDENT