CH4
IPDA
L
IDAR MISSION DATA SIMULATOR AND PROCESSOR FORMERLIN:
PROTOTYPE DEVELOPMENT AT
LMD/CNRS/E
COLEP
OLYTECHNIQUEChomette Olivier1*, Raymond Armante1, Cyril Crevoisier1, Thibault Delahaye1, Dimitri Edouart1, Fabien Gibert1, Frédéric Nahan2, Yoann Tellier1
1
Laboratoire de Météorologie Dynamique (LMD), Ecole Polytechnique, 91128 Palaiseau, FRANCE, *[email protected]
2
Magellium Paris, 92400 Courbevoie, FRANCE
ABSTRACT
The MEthane Remote sensing Lidar missioN (MERLIN), currently in phase C, is a joint cooperation between France and Germany on the development of a spatial Integrated Path Differential Absorption (IPDA) LIDAR (LIght Detecting And Ranging) to conduct global observations of atmospheric methane. This presentation will focus on the status of a LIDAR mission data simulator and processor developed at LMD (Laboratoire de Météorologie Dynamique), Ecole Polytechnique, France, for MERLIN to assess the performances in realistic observational situations.
1 INTRODUCTION
The major anthropogenic sources of CH4 are the
emissions from energy production, landfills, waste treatment, cattle, rice fields and incomplete biomass burning. In addition there are significant natural CH4 sources from wetlands. Due to human
activities, its concentration has been multiplied by more than 2 since the pre-industrial period (1750s) and currently reaches approximately 1800 ppb [1].
After carbon dioxide (CO2), methane (CH4) is the
second anthropogenic greenhouse gas responsible for global warming. Although its global emissions (estimated at around 550 TgCH4 yr-1 [2]) are only
4% of the global CO2 anthropogenic emissions in
units of carbon mass flux, CH4 has a warming
potential that is about 28 times higher than CO2.
Today, surface methane emissions contribute approximately to 30% of the total radiative forcing either directly (20%) [1] or indirectly (10%) via contribution to tropospheric O3 and
H2O production [1].
Understanding and monitoring the evolution of the mechanisms of sources and sinks of this gas in the atmosphere represents a major challenge to better anticipate the future climate. The goal of MERLIN is to obtain global measurements of the spatial and temporal gradients of atmospheric CH4
with a precision and accuracy sufficient to constrain methane fluxes significantly better than with the current observations made by passive optical radiometry techniques and limited in precision as well as in spatial and temporal coverage (cloud cover, aerosol interference, nighttime). The main driver for MERLIN are the specification on the CH4 column-weighted dry-air
mixing ratio (XCH4) split as precision (random
error), maximum bias (systematic error) and horizontal sampling as given in Table 1.
Table 1 MERLIN mission requirement for XCH4
Threshold Breakthrough Target XCH4
random error
36 ppb (2%)
18 ppb (1%)
8 ppb (0.5%) XCH4
systematic error (bias)
3 ppb 2 ppb 1 ppb
Resolution : 50 km horizontal ; total column vertical
The very low level of systematic error aims at avoiding geographical biases in the XCH4 fields
that could lead to uncertainties in fluxes.
In order to reduce the relative random error due mostly to the signal to noise ratio of the instrument, the data are going to be horizontally averaged over 50km along track.
2 THE MERLIN MISSION
planned to be launch at the end of 2020. The IPDA technique relies on DIAL (Differential Absorption LIDAR) measurements using a pulsed laser emitting at two wavelengths, one wavelength accurately locked on a spectral feature of the methane absorption line, and the other wavelength free from absorption to be used as reference. More details about the instruments can be found in [3]. The MERLIN mission will provide the following data products:
Table 2 MERLIN products
Level 0
For each individual laser shot the range-gated backscatter signal data together with auxiliary data such as laser pulse energy, ranging information, wavelength in a chronological data sequence.
Level 1a
Level 0 data with all calibrations computed and appended.
Level 1b
Integrated signal at echo for off and on wavelengths, range, SNR, slant-path DAOD, geo-location and time.
Level 2
Column-weighted dry-air mixing ratios of methane (XCH4) shot-by-shot and
averaged. Level
3
Visualizations of level 2 data such as XCH4
maps.
Level 1 is the responsibility of DLR, Level 2 and 3 are the responsibility of CNES.
We present here the MERLIN measurement principles and the work developed within the MERLIN team at LMD in regards to the LIDAR signals simulation with LIDSIM (LIDar SIMulator) to be able to simulate the Level 0/1a data (see Table 2) and the inversion of this signal done with PROLID (PROcessor LIDar) to obtain the Level 1b and Level 2 product (see Table 2), the column-weighted dry-air mixing ratios of CH4,
referred to as XCH4, over the satellite sub-track.
3 MEASUREMENT PRINCIPLE
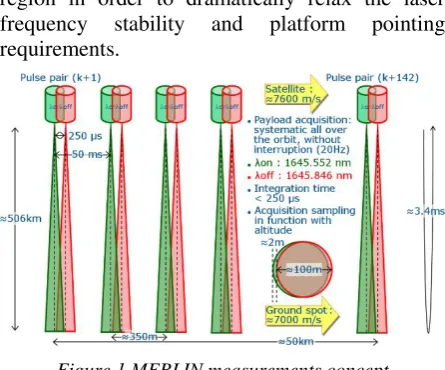
The core element of the MERLIN mission is the nadir-viewing CH4 IPDA LIDAR system. This instrument measures the light back-scattered from the Earth’s surface and cloud tops which are illuminated by laser pulses having slightly different wavelengths denoted as λon and λoff (Fig.
1).
The online wavelength λon is accurately positioned
in the trough of one of the CH4 absorption line
multiplets in the 1.64 µm near-infrared spectral region in order to dramatically relax the laser frequency stability and platform pointing requirements.
Figure 1 MERLIN measurements concept
The measurement at λoff serves as the reference measurement with negligible absorption by the CH4 molecules in the path. The on and off
wavelengths are spectrally close enough to consider the atmospheric and surface properties to be identical with the exception of CH4 absorption
(and H2O and CO2 absorption in a second order).
The MERLIN measurement concept is described in Fig. 1.
4 LIDSIM & PROLID
4.1 LIDSIM
The objective of LIDSIM and PROLID is to be used to assess the performance of MERLIN in realistic observational situations (i.e. terrain characteristics, atmospheric conditions).
The inputs of LIDSIM are composed of three modules (Fig. 2)
- The geometry module provides a simulated MERLIN orbit with latitude/longitude of each shot with respect to LIDAR line of sight pointing, satellite altitude, solar zenith angle and time of the shots.
- The scene generation module provides information on the atmospheric conditions and the surface characteristics from different data sources: o Atmospheric profiles (T, P, H2O ,O3), P and
T at surface from ECMWF.
planned to be launch at the end of 2020. The IPDA technique relies on DIAL (Differential Absorption LIDAR) measurements using a pulsed laser emitting at two wavelengths, one wavelength accurately locked on a spectral feature of the methane absorption line, and the other wavelength free from absorption to be used as reference. More details about the instruments can be found in [3]. The MERLIN mission will provide the following data products:
Table 2 MERLIN products
Level 0
For each individual laser shot the range-gated backscatter signal data together with auxiliary data such as laser pulse energy, ranging information, wavelength in a chronological data sequence.
Level 1a
Level 0 data with all calibrations computed and appended.
Level 1b
Integrated signal at echo for off and on wavelengths, range, SNR, slant-path DAOD, geo-location and time.
Level 2
Column-weighted dry-air mixing ratios of methane (XCH4) shot-by-shot and
averaged. Level
3
Visualizations of level 2 data such as XCH4
maps.
Level 1 is the responsibility of DLR, Level 2 and 3 are the responsibility of CNES.
We present here the MERLIN measurement principles and the work developed within the MERLIN team at LMD in regards to the LIDAR signals simulation with LIDSIM (LIDar SIMulator) to be able to simulate the Level 0/1a data (see Table 2) and the inversion of this signal done with PROLID (PROcessor LIDar) to obtain the Level 1b and Level 2 product (see Table 2), the column-weighted dry-air mixing ratios of CH4,
referred to as XCH4, over the satellite sub-track.
3 MEASUREMENT PRINCIPLE
The core element of the MERLIN mission is the nadir-viewing CH4 IPDA LIDAR system. This instrument measures the light back-scattered from the Earth’s surface and cloud tops which are illuminated by laser pulses having slightly different wavelengths denoted as λon and λoff (Fig.
1).
The online wavelength λon is accurately positioned
in the trough of one of the CH4 absorption line
multiplets in the 1.64 µm near-infrared spectral region in order to dramatically relax the laser frequency stability and platform pointing requirements.
Figure 1 MERLIN measurements concept
The measurement at λoff serves as the reference measurement with negligible absorption by the CH4 molecules in the path. The on and off
wavelengths are spectrally close enough to consider the atmospheric and surface properties to be identical with the exception of CH4 absorption
(and H2O and CO2 absorption in a second order).
The MERLIN measurement concept is described in Fig. 1.
4 LIDSIM & PROLID
4.1 LIDSIM
The objective of LIDSIM and PROLID is to be used to assess the performance of MERLIN in realistic observational situations (i.e. terrain characteristics, atmospheric conditions).
The inputs of LIDSIM are composed of three modules (Fig. 2)
- The geometry module provides a simulated MERLIN orbit with latitude/longitude of each shot with respect to LIDAR line of sight pointing, satellite altitude, solar zenith angle and time of the shots.
- The scene generation module provides information on the atmospheric conditions and the surface characteristics from different data sources: o Atmospheric profiles (T, P, H2O ,O3), P and
T at surface from ECMWF.
o Some information from a Data Elevation Model (DEM) to derive the altitude of each
shot but also the terrain’s slope and its roughness. We currently use GMTED2010. o A global land cover product (GlobCover) to have information about land cover for each shot. This information helps us to create different surface echo linked to land cover classes (all our surface echoes are Gaussian, only the width is modified).
o A database produced from MODIS data to derive the surface reflectivity.
o An inundation climatology to take into account the modifications of surface characteristics brought by inundations.
- The instrument module provides all the instrument characteristics needed to simulate the LIDAR signal in LIDSIM (laser emission, telescope receiver, optics unit, detection and digitalization units).
Figure 2 Schematic description and flow diagram of the LIDSIM/PROLID chains
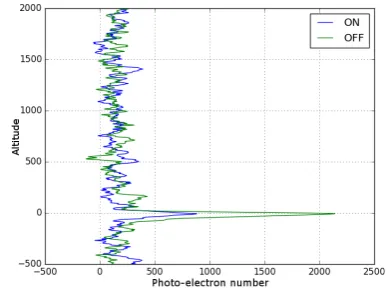
The core of LIDSIM determines the electrons number from the signal (i.e. the photo-electrons detected after being reflected by the ground or a cloud taking into account the absorption and extinction due to the atmosphere) but also from the background (i.e. the photo-electrons generated by the sky background). This step needs a great accuracy on spectroscopic information for the CH4 multiplet but also for the
H2O and CO2 in the vicinity of the two MERLIN
wavelengths, two gases whose effects must be taken into account in the radiative transfer calculations. For the spectroscopy, GEISA database is used [4] and the Automatized Atmospheric Absorption Atlas (4A) [5] a fast and accurate line-by-line radiative transfer model particularly efficient in the infrared region of the spectrum is used for the radiative computation. Noise is then added on the signal (laser and background shot noise, laser and background
speckle, noise from the detector and from the detection chain). The detection impulse response is also taken into account. The Fig. 3 shows an example of a signal output from LIDSIM.
Figure 3 LIDSIM output example. Lidar signal (with noise) for the MERLIN ON and OFF wavelengths
4.2 PROLID
The LIDSIM outputs are directly processed by PROLID. This processor works in two steps. The first one, PROLID-L1, creates MERLIN-L1b like data. Then we obtain the MERLIN-L2 like data (XCH4) with PROLID-L2. The LIDSIM inputs
(Fig. 2) are also needed for PROLID.
PROLID-L1 is still under development at LMD. It is based on the algorithm proposed by DLR. As the impulse response of the detection chain is asymmetrical, the ground echo signal is altered (cf. the asymmetry of the ground echo in Fig. 3). Using a deconvolution process, the asymmetry of the impulse response is rectified and then, the range bias estimation is reduced. PROLID-L1 will also retrieve the scattered energy from the ground echoes and the related SNR for each simulated laser shots.
From the ratio of the LIDAR echoes Pon/Poff, the
Differential Absorption Optical Depth (DAOD) and thus the main data product XCH4 (defined as
a vertical column averaged by a weighting function WF) can be calculated using the following set of equations
Psurf Psurf
where
off on
P P DAOD ln
2 1
(2)
and
) (
) , , ( ) , , (
2 2O H O H
dry
off on
m m g
T P T
P WF
(3)
With P, T the vertical profile of pressure and temperature, σ the methane absorption cross -section (in m²), m is the molecular mass of a species and χH2O is the vertical profile of the
volume mixing ratio of water vapor with respect to dry air.
To calculate the WF (eq. 3) we need to know the effective absorption cross sections of at least the three atmospheric species CH4, CO2 and H2O.
These cross sections depend on atmospheric temperature, pressure and composition and are calculated using 4A. The SSE (Scattering Surface Elevation) needs to be determined in PROLID-L1 in order to know more precisely the surface pressure as the WF is integrated between the top of the atmosphere and the surface.
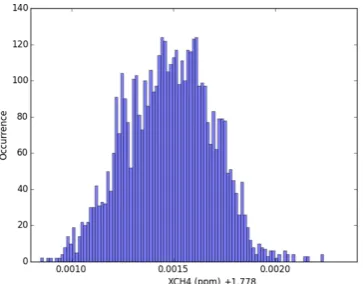
Once XCH4 (Eq. 1) is obtained shot by shot, a last
module in PROLID-L2 performs the averaging over 50km. The method used is described in [6]. Currently the LIDSIM/PROLID-L2 chain is functional and validated. To validate it, we choose to work with TIGR (Thermodynamic Initial Guess Retrieval) dataset instead of an orbit as input. TIGR is a climatological library of 2311 representative atmospheric situations selected by statistical methods from 80,000 radiosonde reports [7]. Each situation is described, from the surface to the top of the atmosphere, by the values of T, H2O, O3 on a given pressure grid.
Figure 4 PROLID-L2 output XCH4 example without noise and over the TIGR database
With this database, all atmospheric conditions are taken into account while optimizing time calculation compared to use the orbit data. We also studied the impact of surface reflectivity by adding random value on TIGR. We validate our chain by comparing the XCH4 calculated by
PROLID with the one put as input in LIDSIM without adding noise on the signal. We’ve found 1.7795±0.0002 ppm (Fig. 4) out of PROLID over the all TIGR database with an amount of CH4 of
1.78 ppm as input of LIDSIM.
5 PERSPECTIVES
In the future, in addition to complete PROLID-L1, several improvements are planned to be developed in our LIDSIM/PROLID chain such as a better vertical discretization, a more representative surface echo, taking into account the Doppler effect, the aerosols and the clouds.
References
[1] IPCC, 2013: Climate Change 2013: The Physical Science Basis. Contribution of WG I to the Fifth Assessment Report of the Intergovernmental Panel on Climate Change. Cambridge University Press, Cambridge, United Kingdom and New York, NY, USA, 1535 pp.
[2] Kirschke, S. et al..: Three decades of global methane sources and sinks, Nat. Geosci., 6, 813–823, doi:10.1038/ngeo1955, 2013.
[3] Stephan, C. et al.: 2011: MERLIN: a Space-based Methane Monitor, Proceedings of the SPIE, Volume 8159, 815908-15.
[4] Jacquinet-Husson, N.et al.:The 2009 edition of the GEISA spectroscopic database. Journal of Quantitative Spectroscopy & Radiative transfer, 2011, 112, pp.2395-2445.
[5] Cheruy,F. et al.: Contribution to the development of radiative transfer models for high spectral resolution observations in the infrared. Journal of Quantitative Spectroscopy and Radiative Transfer, Volume 53, Issue 6, June 1995, Pages 597-611.
[6] Tellier.Y. et al.: Averaging Bias Correction for Future IPDA Lidar Mission MERLIN, ILRC28 Proceeding (submitted)
where
off on
P P DAOD ln
2 1
(2)
and
) (
) , , ( ) , , (
2 2O H O H
dry
off on
m m g
T P T
P WF
(3)
With P, T the vertical profile of pressure and temperature, σ the methane absorption cross -section (in m²), m is the molecular mass of a species and χH2O is the vertical profile of the
volume mixing ratio of water vapor with respect to dry air.
To calculate the WF (eq. 3) we need to know the effective absorption cross sections of at least the three atmospheric species CH4, CO2 and H2O.
These cross sections depend on atmospheric temperature, pressure and composition and are calculated using 4A. The SSE (Scattering Surface Elevation) needs to be determined in PROLID-L1 in order to know more precisely the surface pressure as the WF is integrated between the top of the atmosphere and the surface.
Once XCH4 (Eq. 1) is obtained shot by shot, a last
module in PROLID-L2 performs the averaging over 50km. The method used is described in [6]. Currently the LIDSIM/PROLID-L2 chain is functional and validated. To validate it, we choose to work with TIGR (Thermodynamic Initial Guess Retrieval) dataset instead of an orbit as input. TIGR is a climatological library of 2311 representative atmospheric situations selected by statistical methods from 80,000 radiosonde reports [7]. Each situation is described, from the surface to the top of the atmosphere, by the values of T, H2O, O3 on a given pressure grid.
Figure 4 PROLID-L2 output XCH4 example without noise and over the TIGR database
With this database, all atmospheric conditions are taken into account while optimizing time calculation compared to use the orbit data. We also studied the impact of surface reflectivity by adding random value on TIGR. We validate our chain by comparing the XCH4 calculated by
PROLID with the one put as input in LIDSIM without adding noise on the signal. We’ve found 1.7795±0.0002 ppm (Fig. 4) out of PROLID over the all TIGR database with an amount of CH4 of
1.78 ppm as input of LIDSIM.
5 PERSPECTIVES
In the future, in addition to complete PROLID-L1, several improvements are planned to be developed in our LIDSIM/PROLID chain such as a better vertical discretization, a more representative surface echo, taking into account the Doppler effect, the aerosols and the clouds.
References
[1] IPCC, 2013: Climate Change 2013: The Physical Science Basis. Contribution of WG I to the Fifth Assessment Report of the Intergovernmental Panel on Climate Change. Cambridge University Press, Cambridge, United Kingdom and New York, NY, USA, 1535 pp.
[2] Kirschke, S. et al..: Three decades of global methane sources and sinks, Nat. Geosci., 6, 813–823, doi:10.1038/ngeo1955, 2013.
[3] Stephan, C. et al.: 2011: MERLIN: a Space-based Methane Monitor, Proceedings of the SPIE, Volume 8159, 815908-15.
[4] Jacquinet-Husson, N.et al.:The 2009 edition of the GEISA spectroscopic database. Journal of Quantitative Spectroscopy & Radiative transfer, 2011, 112, pp.2395-2445.
[5] Cheruy,F. et al.: Contribution to the development of radiative transfer models for high spectral resolution observations in the infrared. Journal of Quantitative Spectroscopy and Radiative Transfer, Volume 53, Issue 6, June 1995, Pages 597-611.
[6] Tellier.Y. et al.: Averaging Bias Correction for Future IPDA Lidar Mission MERLIN, ILRC28 Proceeding (submitted)
[7] Chevallier,F. et al.: TIGR-like atmospheric-profile databases for accurate radiative-flux