a
Corresponding author: [email protected]
Solar Panel System for Street Light Using Maximum Power Point Tracking
(MPPT) Technique
A.Wiedjaja a, S.Harta, L.Josses, Winardi and H.Rinda
Computer Engineering Department, Bina Nusantara University, 9 K.H. Syahdan, Jakarta
Abstract.Solar energy is one form of the renewable energy which is very abundant in regions close to the equator. One application of solar energy is for street light. This research focuses on using the maximumpower point tracking technique (MPPT), particularly the perturb and observe (P&O) algorithm, to charge battery for street light system. The proposed charger circuit can achieve 20.73% higher power efficiency compared to that of non-MPPT charger. We also develop the LED driver circuit for the system which can achieve power efficiency up to 91.9% at a current of 1.06 A. The proposed street lightning system can be implemented with a relatively low cost for public areas.
1 Introduction
The power source for street light in Indonesia are mainly still provided from the grids which are supplied mostly by non-renewable energy sources such as fossil fuels. There are several alternatives of renewable energy source [1-5] that can be used for street light in public areas. One promising source of renewable energy in Indonesia is the sun which is available throughout the year. However the price of the sun energy is still high compared to the power from fossil fuels [6]. This high price is driven largely by the cost of the solar panels, the batteries, and the charging controller circuits. In this research we focus on the charging controller circuit for street light system using solar panels, in an attempt to develop a good performance charging controller with relatively low cost.
Solar panel systems still have two problems, the conversion efficiency from the solar panel itself is still small (smaller than 17% when the irradiation condition is low) and the power supplies from the solar panel keep on changing which depends on the weather condition (sun irradiation and temperature). The relation between voltage, current, and power supplied by the solar panel can be depicted in V-I curve (Voltage-Current) and V-P curve (Voltage-Power) which is a non-linier curve depending on irradiation and temperature. Both curves have a maximum peak which is often called as Maximum Power Point (MPP) [7]. The position of the MPP point is varied over time depending on the sun irradiation and temperature condition. This MPP point can be found by using Maximum Power Point Tracking technique (MPPT) [8].
The goal of this research is to make a system that can be used to charge a battery during noon day through solar panel and use the battery to turn on the street light in the night, so this system will independent from the non-renewable energy and completely detach from the main power grid (off grid). In this research, we use solar panel model type SPU-50P with maximum output power 50W that available in the market. Moreover, the system that is offered should be less expensive compared to the ones that are available widely in the market.
2 Experimental Setup
The methodology used in this research is depicted in Figure 1. The components were selected based on the performance and the price. The circuit was designed and simulated using the MultiSim simulation software [9] based on the selected components. The components selection and circuit design were done in multiple iterations where the simulation results at each iteration were tested with the desired performance. The resulting circuit design is then assembled and evaluated also iteratively in order to obtain the expected function and performance.
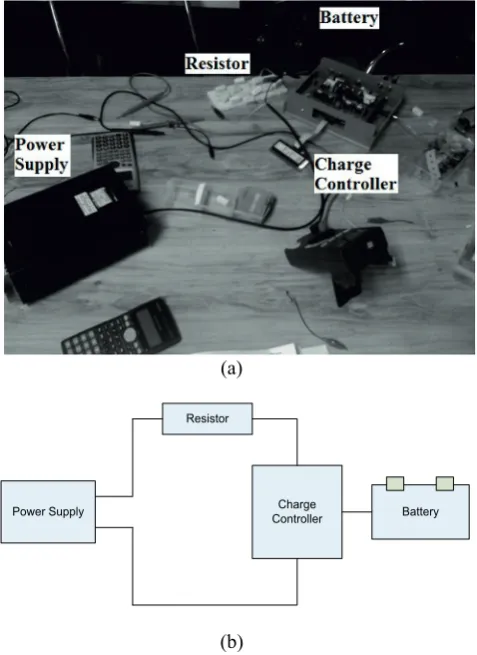
The photograph and the diagram block of the experiment setup for maximum power transfer evaluation are depicted in Figure 2. This experiment was intended to evaluate the power transfer of the charge controller, that is, whether the controller can maintain maximum power transfer or not. The maximum power transfer occurred when the resistor in series with the power supply has the same resistance as the input impedance of the charge controller. The maximum power transfer condition occurs C
Owned by the authors, published by EDP Sciences, 2014
when the charger input voltage is half the power supply output voltage. The MPPT algorithm that was being used in this experiment is the Perturb and Observe (P&O) algorithm [10-13] implemented in the charge controller.
Design Simulation
Assembly expected?Is it as Do all
components function properly? Start
Yes Yes
No
Components Selection
End
No
Figure 1. Method of the research.
(a)
Resistor
Charge
Controller Battery Power Supply
(b)
Figure 2. (a) Photo and (b) System wiring used in experiment.
Experiments were caried out to measured characteristics of the charge controller which are the maximum power transfer versus the solar panel rating, the efficiency comparison between MPPT and non-MPPT charge controller. The experiment also measured the stability of the voltage and current output of the boost converter for LED driver with varying input voltage, and measured the efficiency of the LED driver.
3
Results and Discussion
3.1. Maximum Power Transfer Experiment
To measure the power transfer, a series resistor was used as the output
internal resistance
of the power supply. According to Floyd [14], maximum power transfer could be calculated theoretically by using this equation:= (1)
where Pmax is the maximum power, VR is the voltage across the resistor, and R is the resistor value which was 40 Ohm. VR can be calculated when maximum power occurred happened, that is when VR is half of the power supply voltage VPSU.
In order to measure power transfer
performance of the charging controller, first we
use variable power supply to as power source to
measure circuit performance on several voltage
range, then we replace it by solar panel. In
figure 3 show power transfer performance
across input voltage ranging from 14V
–
32V,
this condition from dark cloud to sunny shine
shines.
We compared the Pexp.result with the power calculated from the equation Pequation which is the power dissipated by the series resistor. We found that the power on the charge controller Pexp result closely follows the power on the resistor Pequation.Figure 3.Graphic of maximum power transfer with power source from the power supply.
The result of the experiment above showed that
Pexp.result is almost as same as the Pequation. When Pequation is
increased, the Pexp.result is increased as well following
Pequation. The average accuracy of the system is 96.54%
due to the tolerance of the resistor that being used. The change in resistor temperature affects change the resistance which influence to the measurement.
This experiment is intended to compare the power that the charge controller received with the power that the solar panel supplied. As in the first experiment, the power received by the system is displayed on the LCD. The power produced by the solar panel was obtained from Fill Factor (FF) rating of the solar panel. According to California Scientific Inc. [15], we can use the following equation to find the value of maximum power:
FF =(
)() (2)
where Pmax is the maximum power which can be
produced by the solar panel (in watt), Voc is the open
circuit voltage from the solar panel (in volt), Isc is the
short circuit current from the solar panel (in ampere), and FF is the constant obtained from the solar panel datasheet (in percentage), which is 75.11%.
Parameters of Voc and Isc is measured directly from the
solar panel and FF was obtained from the datasheet. Therefore the maximum power transfer produced by the solar panel could be calculated. This theoretical maximum power value is compared to the power received by the charge controller (not the battery). The difference between the power produced by the solar panel and power received by the charge controller is depicted in the graphic as seen in figure 4. The power loss and the power dissipated by charge control circuit is 1,100 mW.
Figure 4 shows the differences between theoretical maximum power transfer obtained from the calculation and the power obtained from the charge controller for various values of
sun
light luminance on the solar panel.Figure 4. Graphic of the differences between maximum power transfer obtained from the calculation, and the power obtained from the charge controller against sun light luminance.
The abscissa in figure 4 shows the sun light luminance in hundreds of lux, measured using lux meter. The ordinate of the figure shows the power difference (in percentage) between the theoretical maximum solar panel output power and the power received by the charge controller, showed on the LCD.
The power loss is from 5.23% to 9.74%, it is mean that maximum power transfer efficiency from MPPT system compare to maximum solar panel rating is 94.77%. This variation of power difference can be due to the assumption that the FF value is unaffected by change in temperature. From the measurement the FF value
should decrease in low temperature condition and increased in high temperature condition.
3.3. Experiment between MPPT Technique and non-MPPT Technique on Charge Controller with the Supply from Solar Panel
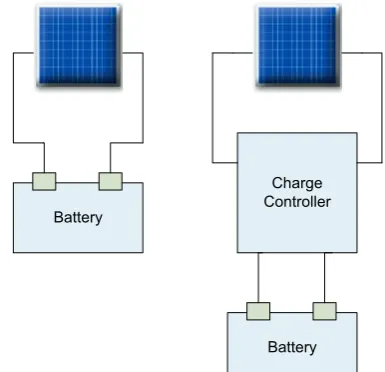
This experiment objective is to compare the output power from the solar panel by using MPPT technique and non-MPPT technique. Non-non-MPPT means that the solar panel is directly connected to the battery without charge controller. The experiment set for this experiment is depicted in Figure 5.
The charge controller will maximize the power transfer from the solar panel and use it to charge the battery. The technique used to look for the maximum power from the solar panel is MPPT which was used in the previous two experiments. The output power from the solar panel or the input power of the charge controller was measured and displayed on the LCD.
The output power from the solar panel was measured using a multi-meter. The power differences (in percentage) versus
luminances
are depicted in Figure 6.The minimum power difference between MPPT technique and non-MPPT is 15.649%, and the maximum power difference is 24.678% with an average of 20.73%. The data obtained was better than the previous research [16] where average power difference was only 15.04%. This is because the previous research only applied buck converter, while in this research we used buck-boost converter. This result is good, for common MPPT controller give result 10% - 15% higher than PWM controller[17]. This converter works even when the voltage of the solar panel is lower or higher than the battery voltage.
Battery
Battery Charge Controller
Figure 5. Diagram block of the system using MPPT technique (left) and directly technique (right).
3.4. Evalution of Boost Converter with Varying
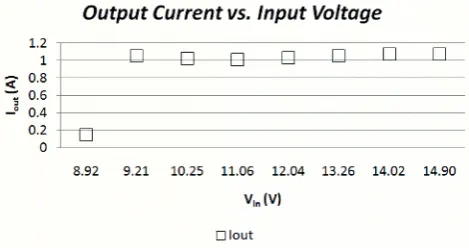
This experiment objective is to evaluate the output current of the LED driver with varying input voltage. In this experiment and the various input voltages are generated by a variable power supply. The three string LED was driven with a current of 350 mA and the total output current is 1.05 A. The result of the experiment can be seen in Figure 7.
The ordinate shows the total output current (Iout) flows
through the three string LEDs, while the abscissa shows the input voltage from the power supply. The minimum input voltage is 9.21 V so that the boost converter can produce the desired output current.
Figure 6.The power difference (in percentage) towards luminance
3.5.LED Driver EfficiencyMeasurement
This experiment objective was to show the efficiency of the LED driver. The efficiency is found by dividing the measured output power by the measured input power. The output power is the power consumed by the three string LEDs, while
the
input power is the power that was consumed by the LED driverfrom
battery, the LED
driver efficiency result shows
in Figure 8.Figure 7.Output current vs.input voltage.
The minimum efficiency of the LED driver is 89.7% and its maximum efficiency is 91.9%. There were 10 measurements taken within 1 hour. The efficiency can only reach 91.9% because there was a power loss due to power taken by the LED driver circuit.
Figure 8.Efficiency of the LED driver.
4
Conclusions
This research has developed a street light system for public area using solar panel and dried battery/cell as the energy storage. Energy efficiency to this system obtained by utilize solar panel to battery charging circuit using MPPT, and using LED and high efficiency LED driver circuit. The implementation of the MPPT technique in the solar panel to battery charging controller has power transfer efficiency up to 94.77%, we measure this from the maximum power that can be produced by the solar panel to energy for charging battery. Using white warm high power LED give us high efficiency energy transfer from electric to light, and LED driver circuit give efficiency up to 91.9% from input power to power LED. To achieve more efficiency we must change LED driver circuit with synchronous buck-boost, some research says it may give up to 98% efficiency. This low cost system is beneficial for the government to build green energy renewable-power street light for public areas.
References
1. M.S. Dresselhaus, and I.L. Thomas, “Alternative Energy Technology”, Nature, 414, p.332-337, Nov 2001.
2. J.P. Hartnett, Alternative Energy Source, Academic Press, Inc., New York, 1976.
3. Renewable Energy – Sources for Fuels and Electricity, Island Press, Washington, 1993.
4. Farret F, and Simoes M, Integration of Alternative Sources of Energy, Wiley-IEEE Press, 2006.
5. Markvart T., Solar Electricity, 2nd edition, John Wiley & Sons, 2000.
6. H. Price, and D. Kearney, “Reducing the Cost of
Energy from Parabolic Trough Solar Power Plants”,
in International Solar Energy Conference (ISES 2003), Hawaii, 2003, p.1-9.
7. Ghaffari A., Seshagiri S., and Krstic M., “Power
Optimization for Photovoltaic Micro-Converters Using Multivariable Gradient-Based
8. Gules R., De Pellegrin Pacheco J., Hey H.L., and
Imhoff J.,“A Maximum Power Point Tracking
System with Parallel Connection for PV Stand-Alone
Applications”, IEEE Transactions on Industrial Electronics, 55 7 (2008), p. 2674-2683.
9. McKinley P.K., and Trefftz C., “MultiSim:A
Simulation Tool for the Study of Large-Scale
Multiprocessors”, in Proceedings of the 1993 International Workshop on Modeling, Analysis, and Simulation of Computer and Telecommunications Networks (MASCOTS), 1993, p. 57-62.
10. Joe Air Jiang, Tsong Liang Huang, Ying Tung
Hsiao, and Chia Hong Chen, “Maximum Power Tracking for Photovoltaic Power Systems”, Tamkang Journal of Science and Engineering, 8 2 (2005), p. 147-153.
11. Kim Tae Yeop, Ahn Ho Gyun, Park SeungKyu, and
Lee YounKyu, “A Novel Maximum Power Point
Tracking Control for Photovoltaic Power System
Under Rapidly Changing Solar Radiation”, in
Proceedings of IEEE International Symposium on Industrial Electronics, vol. 2, 2001, p. 1011-1014. 12. Hsiao Ying Tung T, and Chen China Hong,
“Maximum Power Tracking for Photovoltaic Power System”, in 37th IAS Annual Meeting.Conference Record of the Industry Applications Conference, vol. 2, 2002, p. 1035-1040.
13. Fermia N., Petrone G., Spagnuolo G., and Vitelli M.,
“Optimizing Duty Cycle Perturbation of P&O MPPT
Technique”, in IEEE 35th Annual Power Electronics Specialists Conference (PESC 04), vol. 3, 2004, p. 1939-1944.
14. Floyd T.L.,Electronic Devices Conventional Current Version, 7th edition, Pearson Education International, New Jersey, 2005.
15. Anonim, “Solar Cell Voltage – Current
Characterization,” California Scientific (California Scientific Inc.), (2009), p. 1-4.
16. S. Aryuanto, U.K. Awan, I.N. Yusuf, S.D. Endra,
“Implementation of MPPT Controller for PV System based on AVR Microcontroller,” in Makassar International Conference on Electrical Engineering and Informatics, vol. 3, (Nov 2012) p. 251-254.
17. Morningstar Corp, “Traditional PWM vs Morningstar’s TrakStar ™ MPPT Technology”,