Recent results from BESIII experiment
Hai-Bo Li1,a(On Behalf of the BESIII Collaboration)
1Institute of High Energy Physics, Chinese Academy of Sciences, Beijing 100049, China
Abstract. In this talk, we present recent results from BESIII experiment. This talk covers the studies of charmonium(-like) states, light hadron spectroscopy and charm physics at the BESIII.
1 Introduction
The Beijing Electron Collider has been upgraded to a double ring collider with a design luminosity of 1 × 1033cm−2s−1 at a center-of-mass energy of 3.78 GeV/c2.
It is operating between 2.0 and 4.6 GeV/c2 in the center
of mass energy. The BESIII experiment is used to study the charm andτ physics. The BESIII experiment at the BEPCII collider started data taking since 2008, and data samples were accumulated at the peak of the narrow vec-tor charmonium resonances as well as above 4.0 GeV/c2.
Samples of 13 billion J/ψ decay events and 0.5 billion ψ(2S) decay events have been collected for the study of charmonium decays and light hadron spectroscopy in the charmonium decays. For the study of charm meson de-cays, the BESIII experiment acquired about 2.9 fb−1 on
theψ(3770) peak. Between December of 2012 and June of 2013, the BESIII detector collected a total integrated lu-minosity of 2.9fb−1of data samples, especially, the largest
samples collected at ECM = 4.23 GeV/c2 (1054 pb−1), 4.26 GeV/c2 (806 pb−1), and 4.36 GeV/c2 (523 pb−1),
these data samples have provided powerful study of the
XYZstates.
In this talk, we present the most recent results on the studies of the charged charmonium-like states, charmo-nium decays, light hadron spectroscopy and charm physics at the BESIII experiment.
2 Observations of the charmonium-like
states
Many charmonium-like states, "XYZ" particles, have been observed in the initial state radiation (ISR) process andB
meson decays. All these states populate the charmonium mass region above open charm threshold. Many strange properties measured from these states make them more like exotic states rather than conventional mesons. The BESIII experiment is unique to usee+e− collision tuned to center of mass energies to directly produce the vector
ae-mail: [email protected]
charmonium-like states, such asY(4260) orY(4360), re-spectively. These data samples can be used not only to study theY(4260) orY(4360) states, but also to search for the "charged charmonium-like states",Zc(3900),Zc(4020) andZc(4025).
2.1 The chargedZc(3900)ine+e−→π+π−J/ψ
The BESIII experiment studied the process e+e− →
π+π−J/ψat a center-of-mass (CM) energy of 4.26 GeV/c2
using 525 pb−1data sample [1]. A structure at around 3.9
GeV/c2is observed in theπ±J/ψmass spectrum, which is
referred to as theZc(2900). This structure couples to char-monium and has an electric charge, which is suggestive of a state containing more quarks than just a charm and anti-charm. A fit to the π±J/ψ invariant mass spectrum as shown in Fig. 1 (Top), neglecting interference, results in a mass of (3899.0±3.6±4.9) MeV/c2 and a width of
(46±10±20) MeV [1]. This structure, was also observed at the same time by the Belle collaboration [2] and was confirmed by the authors of Ref. [3] using CLEO-c data. The cross section ofe+e− → π+π−J/ψis measured to be (62.9±1.9±3.7) pb at the CM energy of 4.26 GeV/c2,
which agrees with the existing results from the BaBar, Belle, and CLEO experiments. TheZc(3900) production ratio is also measured to be R = σ(e+e−→π±Zc(3900)∓)
σ(e+e−→π+π−J/ψ) =
(21.5±3.3±7.5)% [1].
2.2 Structure in chargedD∗D¯+c.c.
One possible clue for the interpretation of the Zc(3900) is that it has a mass very close to D∗D¯ threshold. To investigate, the BESIII experiment studied the processes
e+e− → π−D+D¯∗0 +c.c. and e+e− → π−DD¯ ∗+ +c.c.
at the CM of 4.26 GeV/c2 [4]. Clear structure in the
mass spectrum of both D+D¯∗0 +c.c. and ¯DD∗+ +c.c.
was found as shown in Fig. 1 (Bottom). The measured mass and width were (3883.9±1.5±4.2) MeV/c2 and
(24.8±3.3±11.0) MeV/c2, respectively. The structure
was named asZc(3885), and its mass and width are both slightly lower than the ones ofZc(3900) in theπ±J/ψ, but DOI: 10.1051/
C
Owned by the authors, published by EDP Sciences, 2014 /2 01
epjconf 4 7200011
This is an Open Access article distributed under the terms of the Creative Commons Attribution License .0, which permits unrestricted use, distribution, and reproduction in any medium, provided the original work is properly cited.
) 2 ) (GeV/c ψ
J/
± π ( max M
3.7 3.8 3.9 4.0
2
Events / 0.01 GeV/c
0 20 40 60 80 100
) 2 ) (GeV/c ψ
J/
± π ( max M
3.7 3.8 3.9 4.0
2
Events / 0.01 GeV/c
0 20 40 60 80 100
) 2 ) (GeV/c ψ
J/
± π ( max M
3.7 3.8 3.9 4.0
2
Events / 0.01 GeV/c
0 20 40 60 80
100 Data
Total fit Background fit PHSP MC Sideband
)
2) (GeV/
c
0*
D
+M(D
3.85 3.90 3.95 4.00 4.05 4.10 4.15
2
Events / 4 MeV/
c
0 20 40 60 80 100
Figure 1. Top: TheZc(3900) produced in thee+e− → π±J/ψ
at CM of 4.26 GeV/c2 and decaying through Zc(3900)± →
π±J/ψ[1]. Bottom: Structure inD+D¯∗0+c.c.from the reaction
e+e−→π−D+D¯∗0+c.c.at CM of 4.26 GeV/c2[4].
both structures are likely related. The angular distribution of theπZc(3885) system favors aJP=1+quantum number assignment for the structure and disfavors 1− or 0−. The Born cross section times the DD¯∗ branching fraction of theZc(3885) is measured to beσ(e+e−→π±Zc(3885)∓)×
B(Zc(3885)∓ → (DD¯∗)∓) =(83.5±6.6 ±22.0) pb. As-suming theZc(3885)→ DD¯∗signal reported here and the
Zc(3900) → πJ/ψ signal are from the same source, the partial width ratio Γ(Zc(3885)→DD¯∗)
Γ(Zc(3900)→πJ/ψ) =6.2±1.1 ±2.7 is de-termined [4].
2.3 Charge structures in(D∗D¯∗)±andπ±hc
BESIII studied the process e+e− → (D∗D¯∗)±π∓ at a CM energy of 4.26 GeV /c2using a 827 pb−1 data sam-ple [5]. Based on a partial reconstruction technique, the Born cross section is measured to be (137±9±15) pb. A structure near the (D∗D¯∗)± threshold in theπ∓ recoil mass spectrum is observed (see Fig. 2 (Top)), which is denoted as the Zc±(4025) [5]. The measured mass and width of the structure are (4026.3±2.6±3.7) MeV/c2
and (24.8±5.6±7.7) MeV/c2, respectively. Its
produc-tion ratio σ(e+e−→Zc±(4025)π∓→(D∗D¯∗)±π∓)
σ(e+e−→(D∗D¯∗)±π∓) is determined to be 0.65±0.09±0.06. Since this structure couples to (D∗D¯∗)± and has electric charge, the observation suggests that the
Zc(4025) may be a loosely bound (D∗D¯∗)±system [6]. The BESIII experiment also studied e+e− → π+π−hc at CM energies from 3.90 GeV/c2to 4.42 GeV/c2[7]. The
)
2
) (GeV/c
›
π
RM(
4.02 4.04 4.06 4.08
)
2
Events / ( 2.5 MeV/c
10 20 30 40 50 60 7080 data
total fit
4 25
c
comb. B P SP signal
WS
2
e c
c
±
π
3.95 4.00 4.05 4.10 4.15 4.20 4.25
2
e
ts
0.005
e
c
0 20 40 60 80 100 120
2
e c
c
π 3.8 3.9 4.0 4.1
2
e
ts
0.005
e
c
0 10 20 30 40 50
Figure 2. Top: Structure in the (D∗D¯∗)± from the reaction
e+e− → π∓(D∗D¯∗)± at CM energy of 4.26 GeV/c2 [5].
Bot-tom: theZc(4020) produced in thee+e−→π∓Zc(4020)±at CM
energies of 4.23, 4.26 and 4.36 GeV/c2 and decaying through
Zc(4020)→π±hc[7].
Born cross sections are measured at 13 energies, and are found to be of the same order of magnitude as those of
e+e− → π+π−J/ψbut with a different line shape. In the π±h
c mass spectrum, a distinct structure, referred to as
Zc(4020), is observed at 4.02 GeV/c2. TheZc(4020) car-ries an electric charge and couples to charmonium, which is suggestive of a state containing more quarks than just a charm and an anti-charm quark, as theZc(3900) observed in theπ±J/ψsystem. A fit to theπ±hcinvariant mass spec-trum (see Fig. 2 (Bottom)), neglecting possible interfer-ences, results in a mass of (4022.9±0.8±2.7) MeV/c2
and a width of (7.9±2.7±2.6) MeV/c2for theZ
) 2 ) (GeV/c ψ J/ › π + π M(
3.8 3.85 3.9 3
2
Events / 3 MeV/c
0 5 10 15
Data Total fit Background
(GeV)
cm
E
4 4.1 4.2 4.3 4.4 4.5
) (pb)
ψ
J/
› π
+
πγ
→
X(3872)
γ
(
B
σ 0 0.1 0.2 0.3 0.4 0.5 0.6
data Y(4260) Phase Space Linear
Figure 3. Top: the X(3872) produced ine+e− → γX(3872)
atECM = 4.23, 4.26, and 4.36 GeV/c2 and decaying through
X(3872) → π+π−J/ψ. Bottom: The cross section for e+e− →
γX(3872). The cross section is more consistent with aY(4260)
shape than phase space or a linear lineshape.
2.4 Observation of theX(3872)
TheX(3872) was observed by Belle inB±→K±π+π−J/ψ
decays ten years ago [8]. It was confirmed subsequently by several other experiments [9–11]. Since its discovery, it triggered many speculations about its nature, including a hadronic molecule or teraquark state. The CDF and LHCb experiments determined the spin-parity of theX(3872) be-ing JP = 1+ [12, 13], and CDF experiment also found that the π+π− system was dominated by a ρ(770) reso-nance [14]. Using data samples at center-of-mass ener-gies from 4.009 to 4.420 GeV/c2, the e+e− → γX(3872)
was observed for the first time [15]. The X(3872) is clearly seen in theM(π+π−J/ψ) (summed over all energy
points) displayed in Fig. 3 (Top) . The measured mass,
M=3871.9±0.7±0.2 MeV/c2, is consistent with
previ-ous measurements. As shown in Fig. 3 (Bottom), the cross section of this process as a function of center of mass en-ergy, while not conclusive, suggests this observation could arise from the processY(4260)→γX(3872) [15].
3 Charmonium states:
ηc(1
S
)
,
ηc(2
S
)
and
h
cin the
ψ(2
S
)
decays
The mass and width of the lowest lying charmonium state, theηc(1S), continue to have large uncertainties when com-pared to those of other charmonium states [16]. The most recent study by the CLEO-c experiment, using both
ψ(2S)→ γηcandJ/ψ→γηc, pointed out a distortion of theηcline shape inψ(2S) decays [17]. CLEO-c attributed the ηc line-shape distortion to the energy dependence of the "hindered" M1 transition matrix element.
Based on the data sample of 106 M ψ(2S) decay events, the ηc mass and width are measured from the radiative transition ψ(2S) → γηc [18]. The ηc candi-dates are reconstructed from six exclusive decay modes:
KSKπ,K+K−π0,ηπ+π−,KSK+π−π+π−,K+K−π+π−π0, and 3(π+π−), where K
S is reconstructed in π+π− mode, η and π0 from γγ final states. For a hindered M1 tran-sition the matrix element acquires terms proportional to
E2
γ, which, when combined with the usual Eγ3 term for the allowed transitions, lead to contributions in the ra-diative width proportional to E7
γ [19]. Thus, theηc line-shape is described by a BW modified by E7
γ convoluted with a resolution function. It is important to point out that the interference betweenηcand non-resonance in the signal region is also considered. The statistical signif-icance of the interference is 15 σ. This affects the ηc resonant parameters significantly. Assuming an univer-sal relative phase between the two amplitudes, we obtain ηcmass and width,M = 2984.2±0.6±0.5 MeV/c2and Γ =31.4±1.2±0.6 MeV/c2, respectively. Figure 4 shows
the fit results in the sixηcdecay modes. With precise mea-surement of theηcmass, one can obtain the hyperfine split-ting,ΔMh f(1S)cc¯ ≡M(J/ψ)−M(ηc)=112.5±0.8 MeV/c2, which agrees with the quark model prediction and lattice computations [20, 21], and will be helpful for understand-ing the spin-dependent interactions in hidden quarkonium states.
Using 106 millionψ(2S) events, BESIII searches for ηc(2S) in the decayψ(2S) → γηc(2S) with ηc(2S) →
KK¯π[22]. Figure 5 shows the invariant-mass distributions of KSK+π− (top) and K+K−π0 (bottom), where a three-constraints kinematic fit has been applied (in which the en-ergy of the photon is allowed to float). The solid curve in Fig. 5 shows fitting results of an unbinned maximum like-lihood fit with four components: signal,χc1,χc2and other
background (coming fromψ(2S) decays toπ0KK¯π,KK¯π
and ISR/FSR production ofKK¯πγIS R/γFS R). The fit yields 81±14 signal events for theKSK+π−channel and 46±11 for theK+K−π0channel, and gives the massM(η
c(2S))= 3637.6±2.9±1.6 MeV/c2and widthΓ(η
c(2S))=16.9± 6.4±4.8 MeV/c2. The statistical significance of the
sig-nal is more than 11σ. The product branching fraction (B(ψ(2S) → γηc(2S))× B(ηc(2S) → KK¯π) is equal to 1.30±0.20stat±0.30sys)×10−5. Combining our result
with the BaBar measurement ofB(ηc(2S)→ KK¯π) [23], we find the branching fraction of the M1 transition to be
B(ψ(2S)→γηc(2S))=(6.8±1.1stat±4.5sys)×10−4. This
result is consistent with CLEO-c upper limit [24] and pre-dictions of potential models [25].
2 ) GeV/c
π
M(KsK
2.7 2.75 2.8 2.85 2.9 2.95 3 3.05 3.1
2
Events / 10 MeV/c
0 50 100 150 200 250 2 ) GeV/c π M(KsK
2.7 2.75 2.8 2.85 2.9 2.95 3 3.05 3.1
2
Events / 10 MeV/c
0 50 100 150 200 250 2 ) GeV/c π M(KsK
2.7 2.75 2.8 2.85 2.9 2.95 3 3.05 3.1
2
Events / 10 MeV/c
0 50 100 150 200 250 2 ) GeV/c π M(KsK
2.7 2.75 2.8 2.85 2.9 2.95 3 3.05 3.1
2
Events / 10 MeV/c
0 50 100 150 200 250 data decays ψ other i π cont sig non-reso int 2 ) GeV/c 0 π M(KK
2.7 2.75 2.8 2.85 2.9 2.95 3 3.05 3.1
2
Events / 10 MeV/c
0 50 100 150 200 250 2 ) GeV/c 0 π M(KK
2.7 2.75 2.8 2.85 2.9 2.95 3 3.05 3.1
2
Events / 10 MeV/c
0 50 100 150 200 250 2 ) GeV/c 0 π M(KK
2.7 2.75 2.8 2.85 2.9 2.95 3 3.05 3.1
2
Events / 10 MeV/c
0 50 100 150 200 250 2 ) GeV/c 0 π M(KK
2.7 2.75 2.8 2.85 2.9 2.95 3 3.05 3.1
2
Events / 10 MeV/c
0 50 100 150 200 250 data decays ψ other i π cont sig non-reso int 2 ) GeV/c η π π M(
2.7 2.75 2.8 2.85 2.9 2.95 3 3.05 3.1
2
Events / 10 MeV/c
›20 0 20 40 60 80 100 120 140 160 2 ) GeV/c η π π M(
2.7 2.75 2.8 2.85 2.9 2.95 3 3.05 3.1
2
Events / 10 MeV/c
›20 0 20 40 60 80 100 120 140 160 2 ) GeV/c η π π M(
2.7 2.75 2.8 2.85 2.9 2.95 3 3.05 3.1
2
Events / 10 MeV/c
›20 0 20 40 60 80 100 120 140 160 2 ) GeV/c η π π M(
2.7 2.75 2.8 2.85 2.9 2.95 3 3.05 3.1
2
Events / 10 MeV/c
›20 0 20 40 60 80 100 120 140 160 data decays ψ other i π cont sig non-reso int 2 ) GeV/c π M(KsK3
2.7 2.75 2.8 2.85 2.9 2.95 3 3.05 3.1
2
Events / 10 MeV/c
0 20 40 60 80 100 120 140 2 ) GeV/c π M(KsK3
2.7 2.75 2.8 2.85 2.9 2.95 3 3.05 3.1
2
Events / 10 MeV/c
0 20 40 60 80 100 120 140 2 ) GeV/c π M(KsK3
2.7 2.75 2.8 2.85 2.9 2.95 3 3.05 3.1
2
Events / 10 MeV/c
0 20 40 60 80 100 120 140 2 ) GeV/c π M(KsK3
2.7 2.75 2.8 2.85 2.9 2.95 3 3.05 3.1
2
Events / 10 MeV/c
0 20 40 60 80 100 120 140 data decays ψ other i π cont sig non-reso int 2 ) GeV/c 0 π π M(2K2
2.7 2.75 2.8 2.85 2.9 2.95 3 3.05 3.1
2
Events / 10 MeVc
0 50 100 150 200 250 300 2 ) GeV/c 0 π π M(2K2
2.7 2.75 2.8 2.85 2.9 2.95 3 3.05 3.1
2
Events / 10 MeVc
0 50 100 150 200 250 300 2 ) GeV/c 0 π π M(2K2
2.7 2.75 2.8 2.85 2.9 2.95 3 3.05 3.1
2
Events / 10 MeVc
0 50 100 150 200 250
300 dataotherψdecays
i π cont sig non-reso int 2 ) GeV/c π M(6
2.7 2.75 2.8 2.85 2.9 2.95 3 3.05 3.1
2
Events / 10 MeV/c
0 50 100 150 200 250 2 ) GeV/c π M(6
2.7 2.75 2.8 2.85 2.9 2.95 3 3.05 3.1
2
Events / 10 MeV/c
0 50 100 150 200 250 2 ) GeV/c π M(6
2.7 2.75 2.8 2.85 2.9 2.95 3 3.05 3.1
2
Events / 10 MeV/c
0 50 100 150 200 250 data decays ψ other i π cont sig non-reso int
Figure 4.TheM(Xi) invariant mass distributions for the decaysKSK+π−,K+K−π0,ηπ+π−,KSK+π+π−π−,K+K−π+π−π0and 3(π+π−),
respectively, with the fit results superimposed. Points are data and the solid lines are the total fit results [18].
) 2 (GeV c ± π ± K 0 S K m
3.5 3.55 3.6 3.65 3.7
) 2 Events ( 0.005 GeV c 1 10 2 10 3 10 ) 2 (GeV c π ± K 0 S K m
3.5 3.55 3.6 3.65 3.7
) 2 Events ( 0.005 GeV c 1 10 2 10 3 10 ) ± π ± K 0 S data (K fitting results cJ χ (2S) c η background ) 2 (GeV c 0 π -K K m
3.5 3.55 3.6 3.65 3.7
) 2 Events ( 0.005 GeV c 1 10 2 10 3 10 ) 2 (GeV c 0 π -K K m
3.5 3.55 3.6 3.65 3.7
) 2 Events ( 0.005 GeV c 1 10 2 10 3
10 data (K K-π0)
fitting results cJ χ (2S) c η background
Figure 5.The invariant-mass spectrum forKsK+π−(top panel),
K+K−π0 (bottom panel), and the simultaneous likelihood fit to
the three resonances and combined background sources [22].
andΓ =9.9±4.8(stat)±2.9(syst) MeV/c2, which are
con-sistent with the previous BESIII measurements [22]. The BESIII experiment reported the results on the pro-duction and decay of the hc using 106 M ofψ(2S) de-cay events in 2010 [27], where we studied the distribu-tions of mass recoiling against a detected π0 to measure ψ → π0h
cboth inclusively (E1-untagged) and in events tagged as hc → γηc(E1-tagged) by detection of the E1 transition photon. In 2011, 16 specific decay modes of ηc were used to reconstructηc candidates in the decay mode of hc → γηc [28]. Figure 6 shows the π0 re-coiling mass for the sum of the 16 ηc decay modes in the decay chain of ψ → π0h
c, hc → γηc. We fit the 16 π0 recoil-mass spectra simultaneously that yields M(hc) =3525.31±0.11(stat.)±0.14(syst.) MeV/c2and Γ(hc) = 0.70±0.28(stat.)±0.22(syst.) MeV/c2. These results are consistent with the previous BESIII inclusive results and CLEO-c exclusive results.
The centroid of the3P
J states (χc0,χc1,χc2) is known
to be M(3PJ) = [5M(3P2) +3M(3P1)+ M(3P0)] =
3525.30±0.04 MeV/c2 [16]. If the3P
J states centroid mass M(3PJ) is identified as the mass of M(3P), then BESIII observes the hyperfine splitting as ΔMh f(1P)cc =
−0.01±0.11(stat.)±0.15(syst.) MeV/c2which agrees with
zero.
4 Light hadron physics
The BESIII is an idea Lab to study the light hadron spec-troscopy in the radiative or hadronic J/ψ/ψ(2S) decays since both J/ψ and ψ(2S) decays are OZI suppressed. With hugeJ/ψandψ(2S) samples, we presented recent re-sults, including the partial wave analyses (PWA) ofJ/ψ→
γpp¯,γηη,γωφ, andψ(2S)→ pp¯π0. We have to mention
here that bothη andηmesons can be probed in the J/ψ
3.48 3.50 3.52 3.54 3.56 0
20 40 60 80 100 120 140 160 180 200
3.48 3.50 3.52 3.54 3.56
0 20 40 60 80 100 120 140 160 180 200
π0recoil mass (GeV/c2)
Events / (1 MeV/c
2)
Figure 6. Theπ0 recoiling mass for the sum of the 16η
cdecay
modes [28].
precision measurements and to search for rare decays ofη andηdecays [29].
4.1 PWA ofJ/ψ→γpp¯,γηη,γωφ, andψ(2S)→ pp¯π0
For J/ψ → γpp¯ decay, the pp¯ invariant mass distribu-tion is shown in Fig. 7, where strong pp¯ mass thresh-old enhancement, which denotes asX(pp¯), is clearly ob-served [30]. To determine its spin, parity, mass, width and production rate with high precision, a full PWA with
Mpp¯ < 2.2 GeV/c2 was performed after taking into
ac-count the final state interactions using the Julich for-mulation [31]. In the PWA fit the pp¯ threshold en-hancement,f2(1910) and f0(2100) are described by
Breit-Wigner propagators, and the parameters of the f2(1910)
and f0(2100) are fixed at PDG values. Figure 7 shows comparisons of the mass and angular distributions be-tween the data and the PWA fit projections. The mass, width and product BR for theX(pp¯) are measured to be:
M = 1832+−195 (stat.)−+1817(syst.)±19(model) MeV/c2,Γ = 13±39(stat.)+−1013(syst.)±4(model) MeV/c2(a total width of
Γ<76 MeV/c2at the 90% C.L) andB(J/ψ→γX)B(X→ pp¯) = (9.0+0.4
−1.1(stat.)+ 1.5
−5.0(syst.)±2.3(model))×10−5,
re-spectively. For the spin-parity determination of theX(pp¯), the 0−+assignment fit is better than that for 0++ or other
JPCassignments with statistical significance that are larger than 6.8σ[30].
Using 225 million J/ψevents, a PWA ofJ/ψ → γηη
has been performed [32], and the results are summarized in Table 1. The scalar contributions are mainly from
f0(1500), f0(1710) and f0(2100), while no evident
contri-butions fromf0(1370) andf0(1790) are seen. Recently, the
production rate of the pure gauge scalar glueball inJ/ψ ra-diative decays predicted by the lattice QCD [33] was found to be compatible with the production rate ofJ/ψradiative decays tof0(1710); this suggests that f0(1710) has a larger
overlap with the glueball compared to other glueball can-didates (eg. f0(1500)). In this analysis, the production
rate of f0(1710) and f0(2100) are both about one order of
)
2
(GeV c
p
-2m
p p
M
0.0 0.1 0.2 0.3
)
2
Events
(0.005GeV
c
0 100 200 300 400 500 600
700 (a)
γ θ
cos -1.0 -0.5 0.0 0.5 1.0
Events
0 50 100 150 200 250 300 350 400
(b)
p
θ
cos -1.0 -0.5 0.0 0.5 1.0
Events
0 50 100 150 200 250
300 (c)
)
°
(
p
φ
-100 0 100
Events
0 50 100 150 200 250 300 350
(d)
Figure 7.Comparisons between data and PWA fit projection: (a)
the pp¯invariant mass; (b)-(d) the polar angleθγof the radiative
photon in theJ/ψcenter of mass system, the polar angleθpand
the azimuthal angle φp of the proton in the pp¯ center of mass
system withMpp¯−2mp < 50 MeV/c2, respectively. Here, the
black dots with error bars are data, the solid histograms show the PWA total projection, and the dashed, dotted, dash-dotted and
dash-dot-dotted lines show the contributions of theX(pp¯), 0++
phase space, f0(2100) andf2(1910), respectively [30].
magnitude larger than that of the f0(1500) and no clear evidence is found for f0(1370), which are both consistent with, at least not contrary to, lattice QCD predictions.
The tensor components, which are dominantly from
f2(1525), f2(1810) and f2(2340), also have a large
con-tribution in J/ψ→ γηηdecays. The significant contribu-tion from f2(1525) is shown as a clear peak in theηηmass spectrum; a tensor component exists in the mass region from 1.8 GeV/c2to 2 GeV/c2, although we cannot
distin-guish f2(1810) from f2(1910) or f2(1950); and the PWA
requires a strong contribution from f2(2340), although the possibility of f2(2300) cannot be ruled out. For the nar-row fJ(2220), no evident peak is observed in theηηmass spectrum.
A study of the doubly OZI suppressed decays of
J/ψ → γωφ is performed [34], and a strong deviation (> 30σ) from three-body J/ψ → γωφ phase space is observed near the ωφ mass threshold, which is consis-tent with the previous observation reported by the BE-SII experiment. A PWA with a tensor covariant am-plitude that assumes that the enhancement is due to the presence of a resonance, the X(1810), is performed, and confirms that the spin-parity of the X(1810) is 0++. The mass and width of the X(1810) are determined to be M = 1795±7(stat)+13
−5 (syst)±19(mod) MeV/c 2 and
Γ = 95 ±10(stat)+21
−34(syst)±75(mod) MeV/c2,
Table 1.Summary of the PWA results for theJ/ψ→γηη[32].
Resonance Mass(MeV/c2) Width(MeV/c2) B(J/ψ→γX→γηη) Significance f0(1500) 1468+14+23
−15−74 136+ 41+28
−26−100 (1.65+ 0.26+0.51
−0.31−1.40)×10−5 8.2σ f0(1710) 1759±6+14
−25 172±10+−3216 (2.35+−00..1311+−10..2474)×10−4 25.0σ f0(2100) 2081±13+−2436 273−+2724+−7023 (1.13+−00..1009+−00..6428)×10−4 13.9σ f2(1525) 1513±5+4
−10 75+−1210+−168 (3.42+ 0.43+1.37 −0.51−1.30)×10−
5 11.0σ
f2(1810) 1822+29+66
−24−57 229−+5242−+88155 (5.40+−00..6067−+32..4235)×10−5 6.4σ f2(2340) 2362+−3130−+63140 334+−6254+−165100 (5.60−+00..6265−+22..3707)×10−5 7.6σ
beB(J/ψ → γX(1810))× B(X(1810)→ ωφ) = (2.00± 0.08(stat)+0.45
−1.00(syst)±1.30(mod))×10−4.
To study the baryon spectroscopy, a PWA ofψ(2S)→
pp¯π0 is performed [35]. The branching fraction of this
channel has been determined to beB(ψ(2S)→ pp¯π0) =
(1.65±0.03±0.15)×10−4. In this decay, 7N∗(excited baryons) intermediate resonances are observed. Among theseN∗resonances, two new resonances are significant, one (1/2)+resonance with a mass of 2300+40+109
−30−0 MeV/c 2
and width of 340+−3030+−11058 MeV/c2, and one (5/2)−resonance with a mass of 2570+19+34
−10−10MeV/c2and width of 250+−1424+−6921
MeV/c2. For the remaining 5N∗intermediate resonances,
the analysis yields mass and width values which are con-sistent with those from established resonances.
4.2 Observation ofX(1840)inJ/ψ→3(π+π−) decays
We studied the decayJ/ψ→ γ3(π+π−) with a 225.3 mil-lionJ/ψevent sample [36]. A structure at 1.84 GeV/c2is
observed in the 3(π+π−) mass spectrum with a statistical
significance of 7.6σ. As shown in Fig. 8 (Top), fitting the structureX(1840) with a modified Breit-Wigner function yieldsM=1842.2±4.2+7.1
−2.6MeV/c
2andΓ =83±14±11
MeV/c2. The product branching fraction is determined
to beB(J/ψ → γX(1840))× B(X(1840) → 3(π+π−)) = (2.44 ± 0.36+0.60
−0.74) ×10−
5. The comparison to the
BE-SIII results of the masses and widths of the X(pp¯) [30],
X(1810) [34], X(1835) [37] and X(1870) [38] are dis-played in Fig. 8 (Bottom), where the mass ofX(1840) is in agreement with those ofX(1835) andX(pp¯), while its width is significantly different from any of them. There-fore, based on these data, one cannot determine whether
X(1840) is a new state or the signal of a 3(π+π−) decay mode of an existing state. Further study, including an am-plitude analysis to determine the spin and parity of the
X(1840), is needed to establish the relationship between different experimental observations in this mass region and determine the nature of the underlying resonance or reso-nances.
4.3 ηandηphysics
Based on the 225.3 million J/ψevents, we also present the recent results onηandηdecays in this talk. First, we made an attempt to search for their invisible and weak de-cays viaJ/ψ→φηandφη[39, 40]. These two-body
de-2
e c
-π
+
π
3
1.6 1.7 1.8 1.9 2 2.1
2
E
E
T
S1
ec
0 50 100 150 200 250 300
2
e c
-π
+
π
3
1.6 1.7 1.8 1.9 2 2.1
2
E
E
T
S1
ec
0 50 100 150 200 250 300
2
ass e c
1800 1850 1900 1950
Wid
th
e
0 50 100 150 200 250
X(1840);JPunknown(Ref. [36])
X(1870);JPunknown(Ref. [38])
X(1835);JP=0−(Ref. [37]) X(pp¯);JP=0−(Ref. [30]) X(1810);JP=0+(Ref. [34])
Figure 8. Top: The fit of mass spectrum of 3(π+π−). The dots with error bars are data; the solid line is the fit result [36]. Bot-tom: comparisons of observations at BESIII. The error bars in-clude statistical, systematic, and, where applicable, model uncer-tainties.
cays provide a simple event topology, in which theφ me-son can be reconstructed easily and cleanly with its domi-nant decay ofφ→K+K−. Since theφandη(η) are given with strong boosts in theJ/ψdecays, the invisible decays of theηandηwere investigated with the mass spectra re-coiling againstφ. We find no signal above background for the invisible decays ofηandη. To reduce the systematic uncertainty, the upper limits of the ratios, B(ηB→(ηinvisible)→γγ) < 2.6×10⁻⁴andB(η→invisible)
B(η→γγ) <2.4×10−
2, were obtained at
frac-tion values ofηandη → γγfrom the PDG [16], we de-termine the invisible decay rates to beB(η→invisible)< 1.0 ×10⁻⁴ andB(η → invisible) < 5.3×10⁻⁴ at the 90% confidence level. For the first time a search for the semileptonic weak decay modesη(η)→π+e−ν¯ewas per-formed and no signal was observed. The upper limits at the 90% C.L. are 7.3×10⁻⁴and 5.0×10⁻⁴for the ratios
of semileptonic over hadronic decay modesB(Bη→(ηπ→+πe+−πνe¯−+π0c).c.)
and B(ηB→(ηπ→+eπ−+νe¯π−+ηc).c.) [40], respectively. Using the hadronic branching fraction values ofη→π+π−π0andη→π+π−η as listed by PDG [16], we determine the semileptonic de-cay rates to beB(η → π+e−ν¯e+c.c.) < 1.7×10⁻⁴ and
B(η → π+e−ν¯e +c.c.) < 2.2×10⁻⁴ at the 90% C.L.. The decays ofηπ+π−e+e−andη→π+π−μ+μ−were also studied viaJ/ψ → γη[41]. A clearηpeak is observed in the Mπ+π−e+e− mass spectrum, and the branching frac-tion is measured to be B(ηπ+π−e+e−) = (2.11±0.12± 0.14)×10−3, and noη → π+π−μ+μ− signal is found in
the Mπ+π−μ+μ− mass spectrum, and the upper limit is de-termined to beB(η → π+π−μ+μ−) < 2.9×10⁻⁵ at the
90% confidence level. With huge data set at the BESIII, we expect more results onηandηdecays to appear soon.
5 Potential of charm physics at BESIII
Many of the measurements related to charm decays have been done by other experiments such as BESII and CLEO-c, and many are also accessible to the B-factory experi-ments. What are BESIII’s advantages to running at the open charm threshold [42, 43]?
BESIII will not be able to compete with both BABAR and Belle in statistics on charm physics, especially on the rare and forbidden decays of charm mesons. However, data taken at charm threshold still have powerful advan-tages over the data atΥ(4S), which we list here [44]: 1) Charm events produced at threshold are extremely clean; 2) The measurements of absolute branching fraction can be made by using double tag events; 3) Signal/Background is optimal at threshold; 4) Neutrino reconstruction is clean; 5) Quantum coherence allow simple [45] and com-plex [46] methods to measure the neutralDmeson mixing parameters and strong phase difference [47], and to check for directCPviolation.
For charm physics at BESIII, the first physics results will be the measurements of the leptonic and semileptonic decays of charm mesons. Measurements of the leptonic decays at BESIII will benefit from the fully taggedD+and
D+S decays available at the ψ(3770) and at √s ∼ 4170 MeV/c2or∼4017 MeV/c2[48]. The leptonic decay rates
forD+andD+S has been measured with a precision of 4.3% and 2.0 % with the final data from CLEOc. It should be noted that the D+ → τ+ν decay is reported by CLEOc with an upper limit of 1.2×10⁻³ at 90% C.L. [49]. At
BESIII, with 4 times (about 3.0 fb−1 ) of the CLEO-c’s
luminosity, significant gains on these measurements will be made if the systematic errors remain the same. This will allow the validation of theoretical calculations of the decay constants at the 1-2% level. The neutral D mixing andCP
violation in charm sector using quantum correlation are all
statistics-starved at CLEO-c, improvement will be made at BESIII experiment.
1.82 1.84 1.86 1.88
20000 40000
1.82 1.84 1.86 1.88
20000 40000
1.82 1.84 1.86 1.88
20000
40000 (a)
MBC[GeV/c2]
1.82 1.84 1.86 1.88
2000 4000 6000
1.82 1.84 1.86 1.88
2000 4000 6000
1.82 1.84 1.86 1.88
2000 4000 6000
(b)
MBC[GeV/c2]
1.82 1.84 1.86 1.88
500 1000
1.82 1.84 1.86 1.88
500 1000
1.82 1.84 1.86 1.88
500
1000 (c)
MBC[GeV/c2]
1.82 1.84 1.86 1.88
2000 4000
1.82 1.84 1.86 1.88
2000 4000
1.82 1.84 1.86 1.88
2000
4000 (d)
MBC[GeV/c2]
1.82 1.84 1.86 1.88
5000 10000 15000
1.82 1.84 1.86 1.88
5000 10000 15000
1.82 1.84 1.86 1.88
5000 10000 15000
(e)
MBC[GeV/c2]
1.82 1.84 1.86 1.88
2000 4000
1.82 1.84 1.86 1.88
2000 4000
1.82 1.84 1.86 1.88
2000
4000 (f)
MBC[GeV/c2]
1.82 1.84 1.86 1.88
5000 10000
1.82 1.84 1.86 1.88
5000 10000
1.82 1.84 1.86 1.88
5000
10000 (g)
MBC[GeV/c2]
1.82 1.84 1.86 1.88
1000 2000
1.82 1.84 1.86 1.88
1000 2000
1.82 1.84 1.86 1.88
1000
2000 (h)
MBC[GeV/c2]
1.82 1.84 1.86 1.88
5000 10000
1.82 1.84 1.86 1.88
5000 10000
1.82 1.84 1.86 1.88
5000 10000
(i)
MBC[GeV/c2]
Figure 9. The beam-energy-constrained mass distributions for
the different tagged mode combinations, where (a), (b), (c), (d),
(e), (f), (g), (h) and (i) are for the modes ofD−→K+π−π−,K0
Sπ−, K0
SK−,K+K−π−,K+π−π−π
0,π+π−π−,K0
Sπ−π
0,K+π−π−π−π+, and
K0
Sπ−π−π+, respectively; the two vertical dashed red lines show
the taggedD−mass region [50].
5.1 Purely leptonicDdecay
With a sample of 2.9 fb−1taken at open-charm threshold, BESIII experiment measures the decay branching fraction forD+→μ+νμand extracts decay constant fD+[50]. De-cay constant characterizes the strong-interaction physics at the quark-annihilation vertex. In a fully leptonic de-cay, it parameterizes all of our essential theoretical limi-tations. Decay constant for Bmeson also appears in the evaluation of box diagrams, and limits theoretical preci-sion in calculating the neutralBmeson mixing. Thus, lack of knowledge of theB0andB
usefulness of precise measurements ofB0−B¯0andB
s−B¯s oscillations. These mixing data are our best source of in-formation on the CKM matrix elementsVtdandVts, which are difficult to measure directly in top decay. The leptonic decay of charm meson presents an opportunity to check LQCD results for decay constants against precision mea-surements.
We call an event a tagged one if it has a fully-reconstructed D hadronic decay. A sample of tagged events has a greatly reduced background and constrained kinematics, both of which aid studies of how the otherD
in the event decays. One can infer neutrinos from energy and momentum conservation, allowing "full" reconstruc-tion of (semi)leptonic D decays. The typical tag rates per D (not per pair) are roughly 15% and 10% for D0
andD+, respectively. For pure leptonic decay, the single tagged D− meson events are reconstructed in nine non-leptonic decay modes of D− → K+π−π−, Ksπ−, KsK−,
K+K−π−,K+π−π−π0,π+π−π−,K
sπ−π0,K+π−π−π−π+, and
Ksπ−π−π+. Mass peaks for the nine hadronic tag modes are shown in Fig. 9. A maximum likelihood fit to the mass spectrum yields the number of the single taggedD−events for each of the nine modes. The total number of tagged
D−events are 170305±3405 [50].
The chosen signal variable for theμ+νdecay is the cal-culated square of the missing-mass of any undetected de-cay products, shown in Fig. 10; this should of course peak at M2
ν = 0 for signal events. The power ofD-tagging is evident in the clean, isolated signal peak. The events that peak nearM2
miss0.25 GeV2/c4are primarily fromD+→ K0
Lπ+decays, where theKL0is undetected. The numbers of the background events fromD+→K0
Lπ+andD+→π+π
0,
as well asD+→ τ+ντ, are estimated by analyzing Monte Carlo samples that are 10 times larger than the data. The backgrounds from other D decays are corrected consid-ering the difference in the numbers of events from the data and simulated events in the range from 0.15 to 0.60 GeV2/c4. These studies show that there are 42.0±2.3
back-ground events among the 451D+ → μ+νμ candidates in the signal region indicated in Fig. 10. After subtracting the number of background events, 409.0±21.2±2.3 sig-nal events (Nnet
sig) forD+ → μ+νμremain, where the first
error is statistical and the second is the systematic associ-ated with the uncertainty of the background estimate. The weighted overall efficiency for detectingD+→μ+νμ de-cays is determined to be =0.6403±0.0012 by analyz-ing Monte Carlo simulated events forD+→μ+νμin each taggedD−mode. We obtain the branching fraction to be
B(D+→μ+νμ)=(3.71±0.19±0.06)×10−4,
where the first error is statistical and the second system-atic. The measured branching fraction is consistent within error with world average ofB(D+→μ+ν)=(3.82±0.33)×
10−4[16], but has better precision. The decay constantf
D+ is then obtained by using 1040±7 fs as theD+lifetime and 0.2252 asVcd[16]. Our result is
fD+=(203.2±5.3±1.8)
MeV/c2, where the first errors are statistical and the
sec-ond systematic [50].
-0.2 0.0 0.2 0.4
50 100 150
-0.2 -0.1 0.0 0.1 0.2 0.3
-1 10
1 10 2 10
M
2miss
[GeV
2/
c
4]
N
u
m
b
er
of
ev
en
ts (c)
Figure 10. BESIII missing-mass-squared plot for D+ → μ+ν. The insert shows the signal region on a vertical log scale, where dots with error bars are for the data, histograms are sum for the
simulated backgrounds fromD+ →KLπ+,D+ →π+π0,D+ →
τ+νand other decays ofDmesons as well as frome+e−→
non-DD¯ decays.
5.2 SemileptonicDdecays:D0→K−e+νandπ−e+ν
One of the best ways to measure magnitudes of CKM el-ements is to use semileptonic decays since they are far simpler to understand than hadronic decays and the decay width is∼ |Vcq|2. On the other hand, measurements using other techniques have obtained useful values forVcs and
Vcd[53], and thus semileptonicDdecay measurements are a good laboratory for testing theories of QCD. For aD me-son decaying into a single hadron (h), the decay rate can be written exactly in terms of the four-momentum transfer defined as:
q2=(pμD−pμh)2=m2D+m2h−2EhmD. (1)
For decays to pseudoscalar mesons and "virtually mass-less" leptons, the decay width is given by:
dΓ(D→Pe+ν)
dq2 =
G2
F|Vcq|
2p3
P 24π3 |f+(q
2)|2, (2)
where pP is the three-momentum of pseudoscalar meson in the Drest frame, and f+(q2) is a "form-factor" whose
normalization must be calculated theoretically, although its shape can be measured.
The BESIII experiment has taken about 2.9 fb−1 data
at open-charm threshold during the 2010 and 2011 data runs. Using one-third of the data, a partially-blind anal-ysis has been done with the D0 → KeνandD0 → πeν
decays. Using the double tag technique, several hadronic
Ddecays are fully reconstructed at first. The following four hadronicDdecays are used: D0 → K−π+,K−π+π0, K−π+π0π0 and K−π+π−π+. After hadronic D0 tags are
found, we reconstruct signal decay for the other ¯D0. The
Figure 11.Udistributions of ¯D0→K+e−ν(left) and ¯D0→π+e−ν(right).
ΓΔ
π
π π
π
π
π
ΓΔ
π
π π
π
π
π
Figure 12.Partial decay rates measurement using individual tag modes (points) and all tag modes combined (histogram) for decay of ¯
D0→K+e−ν(left) and ¯D0→π+e−ν(right).
Given the signal yields obtained from fittingU distri-butions and signal efficiencies obtained from signal Monte Carlo, the absolute branching fractions are obtained. Pre-liminary results of branching fractions are listed in Ta-ble 2, and comparisons with results from PDG2012 [16] and CLEO-c results [54] are also made. In order to mea-sure form factor, partial decay rates are meamea-sured in differ-entq2bins. ¯D0→ K+e−νcandidates are divided into nine q2 bins, while ¯D0 → π+e−ν candidates are divided into
sevenq2bins. Signal yields in eachq2bin are obtained by
fittingUdistributions in thatq2range. Using an efficiency
matrixversus q2, obtained from Monte-Carlo simulation,
and combining with tag yields and tag efficiencies, the par-tial decay rates are obtained, as shown in Fig. 12.
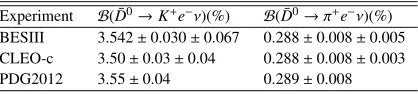
Table 2.Branching fraction measurement using 923 pb−1of
ψ(3770) data from BESIII experiment, and comparisons with
results from CLEO-c and PDG2012.
Experiment B( ¯D0→K+e−ν)(%) B( ¯D0→π+e−ν)(%)
BESIII 3.542±0.030±0.067 0.288±0.008±0.005
CLEO-c 3.50±0.03±0.04 0.288±0.008±0.003
PDG2012 3.55±0.04 0.289±0.008
The values ofq2-dependent form factors in eachq2bin
can be extracted from the measured partial decay rates. These data can be fitted with different parameterizations of
the form factors, and the fit can distinguish between form factor parameterizations. In general, one may express the form factors in terms of a dispersion relation, an approach that has been well established in the literature (see, for ex-ample, Ref. [55] and references therein):
f+(q2) = f+(0) 1−α
1 (1−q2/m2
pole) +
1 π
∞
(mD+mP)2
Im(f+(t))
t−q2−idt, (3)
wherempole is the mass of the lowest lying (qiq¯f) meson with the appropriate quantum numbers: for D → Keνit isD∗s+and forD → πeνit isD∗+, the parameterαgives the relative contribution from the vector pole at q2 = 0, mDis the mass of theDmeson, andmPis the mass of the final state pseudoscalar meson. The integral term can be expressed in terms of an infinite series [55]. Typically it takes only a few terms to describe the data. Three differ-ent parameterizations of the form factor f+(q2) are
consid-ered. The first parameterization, known as the simple pole model, is dominated by a single pole [56]; the second pa-rameterization is known as the modified pole model [56]; the third parameterization is known as the series expan-sion [55]. Thus minimizedχ2fits are employed to extract
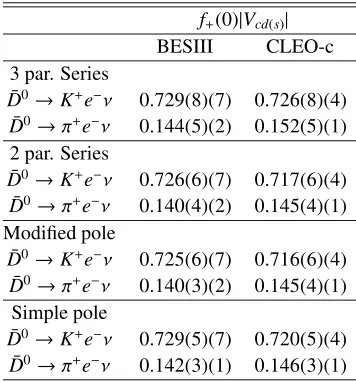
Table 3.Results of f+(0)|Vcd(s)|from individual form factor fits;
statistical and systematic uncertainties on the least significant digits are shown in parentheses. Results from CLEO-c are
compared.
f+(0)|Vcd(s)| BESIII CLEO-c 3 par. Series
¯
D0→K+e−ν 0.729(8)(7) 0.726(8)(4)
¯
D0→π+e−ν 0.144(5)(2) 0.152(5)(1)
2 par. Series ¯
D0→K+e−ν 0.726(6)(7) 0.717(6)(4)
¯
D0→π+e−ν 0.140(4)(2) 0.145(4)(1)
Modified pole ¯
D0→K+e−ν 0.725(6)(7) 0.716(6)(4)
¯
D0→π+e−ν 0.140(3)(2) 0.145(4)(1)
Simple pole ¯
D0→K+e−ν 0.729(5)(7) 0.720(5)(4)
¯
D0→π+e−ν 0.142(3)(1) 0.146(3)(1)
In summary for charm physics, the results for the (semi-)leptonic D decays have appeared. However, the BESIII experiment can also measure the strong phase dif-ference between between the doubly Cabibbo-suppressed and and Cabibbo-favored processes, the first preliminary results for D0 → Kπ were reported [58] recently. We
also reported the result on the D+ → KSπ+π0 based on a full amplitude analysis [59]. More analyses on theD→ h1h2h3Dalitz decays andD→h1h2h3h4four-body decays
are under going at the BESIII, from which one will extract amplitudes from qusi-two-body contributions. Therefore the strong phase difference, neutralDmixing parameters andCPviolation asymmetries can be studied. For the rare charm decays, many decay modes including photons and π0in the final states can be probed with high sensitivities
(with relative smaller integrated luminosity than that at the
Bfactories), for example, theD0→γγdecay was reported
recently [60].
6 Summary
Based on the data samples taken at the BESIII detector from 2008 to 2012, the the recent results on the study of XYZ particles, light hadron spectroscopy, charmonium decays and charm decays are presented, which illustrate the rich physics in the t-charm region. More promising results are expected soon.
References
[1] M. Ablikimet al.(BESIII Collaboration), Phys. Rev. Lett.110, 252001 (2013).
[2] Z. Q. Liuet al.(Belle Collaboration), Phys. Rev. Lett. 110, 252002 (2013).
[3] T. Xiao, S. Dobbs, A. Tomaradze and K. K. Seth, arXiv:1304.3036 [hep-ex].
[4] M. Ablikim et al. (BESIII Collaboration), arXiv:1310:4101.
[5] M. Ablikim et al. (BESIII Collaboration), arXiv:1308.2760.
[6] Z. -C. Yang, Z. -F. Sun, J. He, X. Liu and S. -L. Zhu, Chin. Phys. C36, 6 (2012);
[7] M. Ablikim et al. (BESIII Collaboration), arXiv:1309:1896.
[8] S. K. Choi et al. (Belle Collaboration), Phys. Rev. Lett.91, 262001 (2003).
[9] D. Acostaet al.(CDF Collaboration), Phys. Rev. Lett. 93, 072001 (2004).
[10] V. M. Abazovet al.(D0 Collaboration), Phys. Rev. Lett.93, 162002 (2004).
[11] B. Aubertet al.(BaBar Collaboration), Phys. Rev. D 71, 071103 (2005).
[12] A. Abulenciaet al.(CDF Collaboration), Phys. Rev. Lett.98, 132002 (2007).
[13] R. Aaijet al.(LHCb Collaboration), Eur. Phys. J. C 72, 1972 (2012).
[14] A. Abulenciaet al.(CDF Collaboration), Phys. Rev. Lett.96, 102002 (2006).
[15] M. Ablikim et al. (BESIII Collaboration), arXiv:1310:4101.
[16] J. Beringeret al.(Particle Data Group), Phys. Rev. D 86, 010001 (2012).
[17] R. E. Mitchell et al. (CLEO Collaboration), Phys. Rev. Lett.102, 011801 (2009).
[18] M. Ablikimet al.(BESIII Collaboration), Phys. Rev. Lett.108, 222002 (2012).
[19] N. Brambilla, Y. Jia and A. Vairo, Phys. Rev. D73, 054005 (2006).
[20] E. Eichten, K. Gottfried, T. Kinoshita, K. D. Lane and T.-M. Yan, Phys. Rev.D17, 3090 (1978).
[21] Carleton DeTaret al., arXiv:1211.2253 (2012). [22] M. Ablikimet al.(BESIII Collaboration), Phys. Rev.
Lett.109, 042003 (2012).
[23] B. Aubertet al.(BaBar Collaboration), Phys. Rev. D 78, 012006 (2008).
[24] D. Cronin-Hennessy et al. (CLEO Collaboration), Phys. Rev. D81, 052002 (2010).
[25] E. J. Eichten, K. Lane and C. Quigg, Phys. Rev. Lett. 89, 162002 (2002).
[26] M. Ablikimet al.(BESIII Collaboration), Phys. Rev. D87, 052005 (2013).
[27] M. Ablikimet al.(BESIII Collaboration), Phys. Rev. Lett.104, 132002 (2010).
[28] M. Ablikimet al.(BESIII Collaboration), Phys. Rev. D86, 092009 (2012).
[29] H. B. Li, J. Phys. G: Nucl. Part. Phys. 36, 085009 (2009).
[30] M. Ablikimet al.(BESIII Collaboration), Phys. Rev. Lett.108,112003 (2012).
[31] A. Sirbirtsenet al., Phys. Rev. D71,054010 (2005). [32] M. Ablikimet al.(BESIII Collaboration), Phys. Rev.
D87, 092009 (2013).
[34] M. Ablikimet al.(BESIII Collaboration), Phys.Rev. D87, 032008 (2013).
[35] M. Ablikimet al.(BESIII Collaboration), Phys. Rev. Lett.110, 022001 (2013).
[36] M. Ablikimet al.(BESIII Collaboration), Phys. Rev. D88, 091502 (2013).
[37] M. Ablikimet al.(BESIII Collaboration), Phys. Rev. Lett.106, 072002 (2011).
[38] M. Ablikimet al.(BESIII Collaboration), Phys. Rev. Lett.107, 182001 (2011).
[39] M. Ablikimet al.(BESIII Collaboration), Phys. Rev. D87, 012009 (2013).
[40] M. Ablikimet al.(BESIII Collaboration), Phys. Rev. D87, 032006 (2013).
[41] M. Ablikimet al.(BESIII Collaboration), Phys. Rev. D87, 092011 (2013).
[42] H. B. Li, Nucl. Phys. B (Proc. Suppl.) 162, 312 (2006).
[43] H. B. Li, Nucl. Phys. B (Proc. Suppl.) 233,185 (2012).
[44] L. Gibbons, hep-ex/0107079.
[45] M. Gronau, Y. Grossman, and J. L. Rosner, Phys. Lett.B 508,37 (2001).
[46] D. M. Asner and W. M. Sun, Phys. Rev.D73,034024 (2006).
[47] X. D. Cheng, K. L. He, H. B. Li, Y. F. Wang and M. Z. Yang, Phys. Rev.D75, 094019 (2007).
[48] D. Cronin-Hennessy et al. (CLEO Collab.), Phys. Rev.D 80, 072001 (2009).
[49] B. I. Eisenstein et al. (CLEO Collab.),Phys. Rev. D78,052003(2008).
[50] M. Ablikim et al. (BESIII Collaboration), arXiv:1312.0374 [hep-ex].
[51] B. I. Eisensteinet al. (CLEO Collaboration), Phys. Rev. D78, 052003 (2008).
[52] E. Follana et al.(HPQCD and UKQCD Collabora-tions), Phys. Rev. Lett.100,062002 (2008).
[53] M. Artuso, "Status and future perspectives on Vcs
and Vcd, Experimental," presented at 4th Int. Workshop on the CKM Unitarity Triangle, Dec., 2006, Nagoya, Japan.
[54] D. Besson et al.(CLEO Collaboration), Phys. Rev. D 80, 032005 (2009)
[55] T. Becher and R. J. Hill, Phys. Lett. B633, 61 (2006). [56] D. Becirevic and A. B. Kaidalov, Phys. Lett. B478,
417 (2000).
[57] C. L. Liu (For BESIII Collaboration), Re-view of semileptonic charm decays, talk given at CHARM2012.
[58] X. .R. Lu (For BESIII Collaboration),Measurements of strong phase in D0 → Kπdecay andy
CPat BESIII, arXiv:1311.3411 [hep-ex].
[59] M. Ablikim et al. (BESIII Collaboration), arXiv:1401.3083 [hep-ex].
![Figure 1. Top: Theat CM of 4.26 GeV Zc(3900) produced in the e+e− → π±J/ψ/c2 and decaying through Zc(3900)±→π±J/ψ [1]](https://thumb-us.123doks.com/thumbv2/123dok_us/8197456.1369225/2.595.78.267.85.358/figure-theat-cm-gev-zc-produced-decaying-zc.webp)


![Figure 6. The π0 recoiling mass for the sum of the 16 ηc decaymodes [28].](https://thumb-us.123doks.com/thumbv2/123dok_us/8197456.1369225/5.595.307.547.83.314/figure-p-recoiling-mass-sum-hc-decaymodes.webp)
![Table 1. Summary of the PWA results for the J/ψ → γηη [32].](https://thumb-us.123doks.com/thumbv2/123dok_us/8197456.1369225/6.595.309.526.229.563/table-summary-pwa-results-j-ps-ghh.webp)
![Figure 9. The beam-energy-constrained mass distributions forthe different tagged mode combinations, where (a), (b), (c), (d),(e), (f), (g), (h) and (i) are for the modes of D− → K+π−π−, K0S π−,K0S K−,K+K−π−, K+π−π−π0, π+π−π−, K0S π−π0, K+π−π−π−π+, andK0S π−π−π+, respectively; the two vertical dashed red lines showthe tagged D− mass region [50].](https://thumb-us.123doks.com/thumbv2/123dok_us/8197456.1369225/7.595.324.519.117.539/figure-constrained-distributions-dierent-combinations-respectively-vertical-showthe.webp)