© 2014, IJCSMC All Rights Reserved 722 Available Online at www.ijcsmc.com
International Journal of Computer Science and Mobile Computing
A Monthly Journal of Computer Science and Information Technology
ISSN 2320–088X
IJCSMC, Vol. 3, Issue. 6, June 2014, pg.722 – 729
RESEARCH ARTICLE
Evaluation and Efficient Initial
Centroid Selection of New Algorithm
for High Dimensional Data
Saranya.S
1Assistant Professor, Department of Computer Science
Sri Ramakrishna College of Arts & Science for Women, Bharathiyar University, Coimbatore, India
[email protected]
.
Abstract:
Clustering is a division of data into groups of similar objects. Each group called cluster, consist of objects that are similar between themselves and dissimilar compared to the object of other groups. Dimensionality reduction is the transformation of high-dimensional data into meaningful representation of reduced dimensionality that corresponds to the intrinsic dimensionality of the data. This paper proposed a new algorithm of data partitioning based k-means will perform the data axis with highest variance will be chosen as the principal axis for data partitioning. The data partitioning tries to divide data space into small cells or clusters where inter cluster distance are large and intra cluster distance are small as possible. The experimental results show that the proposed algorithm mainly focuses on reducing the Sum of the Squared Error and increasing the clustering accuracy than the existing algorithm of k-means algorithm and Pam algorithm.
Keyword: Clusters, Cluster Analysis, k-means algorithm, Data partitioning, new algorithm
I. INTRODUCTION
Data mining is the process of extracting potentially useful information from a data set [1]. Clustering is a popular but challenging data mining technique, which intended user to discover and understand the structure or grouping of the data in the set according to a certain similarity measure [2]. Clustering is an important step in all data mining algorithms in which the data objects are classified into number of different subclasses. The purpose is to generate clusters such that it contains high intra-class similarity and low inter-class similarity. The algorithm classifies raw data into K number of group on the basis of defined attributes. This grouping is performed by minimizing the sum of squares of distances between data and the corresponding cluster centroid. Conceptually, the center point is considered as the centroid of a cluster
© 2014, IJCSMC All Rights Reserved 723
algorithm from suitable initial positions. The propose method will reduce the computational load without significantly affecting solution quality. The proposed clustering methods are tested on well-known data sets and they compare favorably to the k-means algorithm with random restarts.
A. P. Reynolds, G. Richards, and V. J. Rayward-Smith the research has resulted in the production of an `all- rules' algorithm for data-mining that produces all conjunctive rules of above given condense and coverage thresholds. While this is a useful tool, it may produce a large number of rules. This paper describes the application of two clustering algorithms to these rules, in order to identify sets of similar rules and to better understand the data.
Fahim A.M, Salem A. M, Torkey A and Ramadan M. A, “An Efficient enhanced k-means clustering algorithm” has proposed idea that makes k-means more efficient since, in each iteration, the k-means algorithm computes the distances between data point and all centers; this is computationally very expensive especially for huge datasets. For each data point, it keeps the distance to the nearest cluster. At the next iteration, we compute the distance to the previous nearest cluster. If the new distance is less than or equal to the previous distance, the point stays in its cluster, and there is no need to compute its distances to the other cluster centers. This saves the time required to compute distances to k−1 cluster center.
II. EXISTING APPROACH
A. THE K-MEANS CLUSTERING ALGORITHM:
K-means is one of the simplest unsupervised learning algorithms that solve the well known clustering problem K-Means is one of the simplest unsupervised learning algorithms that solve the well-known clustering problem. The main idea is to define k centroids, one for each cluster. The better choice is to place the Centroids as much as possible far away from each other. Euclidean distance is generally considered to determine the distance between data points and the centroid once we find k new centroids a new binding is to created between the same Data points and the nearest new centroid as a results, the k- centroid may change their position in a step by step manner. This process will continue until convergence criteria for clustering.
Algorthim1: The Standard K-means clustering algorithm
Input
D= {d1, d2, d3………dn} // set of elements
K // number of desired cluster Output:
K // set of clusters Steps:
1. Place K points into the space represented by the objects that are being clustered. These points represent initial group centroids.
2. Assign each object to the group that has the closest centroid.
3. When all objects have been assigned, recalculate the positions of the K centroids. 4. Repeat Steps 2 and 3 until the centroids no longer move.
This produces a separation of the objects into groups from which the metric to be minimized can be calculated.
B. PAM ALGORITHM:
The k-means algorithm is sensitive to outliers since an object with an extremely large value may substantially distort the distribution of data. Instead of taking the mean value of the objects in a cluster as a reference point, the medoid can be used, which is the most centrally located object in a cluster. K-Medoids method uses representative objects as reference points instead of taking the mean value of the objects in each cluster.
Algorithm 2: Pam Algorithm
Input
The number of clusters k and a database containing n objects
Output
© 2014, IJCSMC All Rights Reserved 724
Method
1. Initialize: randomly select k of the n data points as the medoids
2. Associate each data point to the closest medoid. ("Closest" here is defined using Euclidean distance 3. for each medoid m
(i) For each non-medoid data point o
(ii) Swap m and o and compute the total cost of the configuration 4. Select the configuration with the lowest cost.
Repeat steps 2 to 4 until there is no change in the medoid.
C. CALCULATING THE INITIAL CENTROID ALGORITHM K-MEANS.
Algorithm 3: Modified k-means Algorithm(Abdul Nazeer and Sebastian)
Input
D= {d1, d2, d3………dn} // set of elements
K // number of desired cluster Output:
K // set of clusters Steps:
Phase 1: Determine the initial centroids of the clusters by using algorithm 4 Phase 2: Assign each data point to the appropriate clusters by algorithm 5
From the above algorithm the phase 1 has indicates that the initial centroids systematically so as to produce clusters with better accuracy and the phase 2 has determine the use of a variant of the clustering method.
Algorithm 4: Finding the initial centroids
Input
D={ d1,d2,d3………dn} // set of elements
K // number of desired cluster Output: A set of k initial centroids Steps:
1. Set m = 1;
2. Compute the distance between each data point and all other data- points in the set D;
3. Find the closest pair of data points from the set D and form a data-point set Am (1<= m <= k) which contains these two data- points, Delete these two data points from the set D;
4. Find the data point in D that is closest to the data point set Am, add it to Am and delete it from D; 5. Repeat step 4 until the number of data points in Am reaches 0.75*(n/k);
6. If m<k, then m = m+1, find another pair of data points from D between which the distance is the shortest, form another data-point set Am and delete them from D, Go to Step 4;
7. for each data-point set Am (1<=m<=k) find the arithmetic mean of the vectors of data points in Am, these means will be the initial centroids.
Algorithm 3 has describes about the method for finding initial centroids of the clusters. Initially, calculate the distances between each data point and all other data points in the set of data Points. Then find out the closest pair of data points and form a set S1 consisting of these two data points, and delete them from the data point set D. Then determine the data point which is closest to the set S1, add it to S1 and delete it from D. Repeat this procedure until the number of elements in the set S1 reaches a threshold. At that point go back to the second step and form another data-point set S2. Repeat this till ’k’ such sets of data points are obtained. Finally the initial centroids are obtained by averaging all the vectors in each data-point set. The Euclidean distance is used for calculate the closeness of each data point to the cluster centroids. The distance between one vector X = (x1,
x2 ...xn) and another vector Y = (y1, y2, .yn) is obtained as The distance
© 2014, IJCSMC All Rights Reserved 725
Algorithm 5: Assigning data-points to clusters
Input:
D = {d1, d2…, dn} // set of n data-points.
C = {c1, c2... ck} // set of k centroids
Output:
A set of k clusters Steps:
1. Compute the distance of each data-point di (1<=i<=n) to all the centroids cj(1<=j<=k) as d (di, cj); 2. For each data-point di, find the closest centroid cjand assign dito cluster j.
3. Set ClusterId[i] =j; // j: Id of the closest cluster 4. Set Nearest_Dist[i] = d(di, cj);
5. For each cluster j (1<=j<=k), recalculate the centroids; 6. Repeat
7. For each data-point di,
7.1 Compute its distance from the centroid of the Present nearest cluster;
7.2 If this distance is less than or equal to the present nearest distance, the data-point stays in the cluster; Else
7.2.1 For every centroid cj(1<=j<=k) Compute the distance d (di, cj); End for;
7.2.2 Assign the data-point dito the cluster with the nearest centroid cj
7.2.3 Set ClusterId[i] =j;
7.2.4 Set Nearest_Dist[i] = d (di, cj); End for;
8. For each cluster j (1<=j<=k), recalculate the centroids; Untilthe convergence criteria is met.
III. PROPOSED APPROACH
A. New algorithm:
Algorithm 6: Cluster using new algorithm for data partitioning based k-Means
Input
D= {d1, d2, d3………dn} // set of elements
K // number of desired cluster Output:
K // set of clusters Steps:
Phase 1: Determine the cluster using new algorithm data partitioning based on k-means by algorthim7
Phase 2: Assign each data point to the appropriate clusters by algorithm 5
The proposed new algorithm data partitioning based on k-means will find the cluster centre initialization based on considering values for each attributes of the given dataset and this provides some information leading to a good initial cluster centre.
Algorithm 7: Finding initial centroid using new algorithm data partitioning based k-means
Input:
D = { d1, d2, d3………dn } // set of n data-points. C = { c1,c2,c3….cn } // set of k centroids
Output: 1. Set m = 1;
2. Sort all data in the cell c in ascending order on each attribute value and links data by a linked list for each attribute.
3. Compute variance of each attribute of cell c.
Choose an attribute axis with the highest variance as the principal axis for partitioning
© 2014, IJCSMC All Rights Reserved 726
i dsumi = ∑ Dj
j=1
5. Compute centroid distance of cell c:
CentroidDist = ∑ni=1dsumi
N
Where dsumiis the summation of distances between the adjacent data.
6. Divide cell c into two smaller cells. The partition boundary is the plane perpendicular to the principal axis and passes through a point m whose dsumi approximately equals to CentroidDist. The sorted linked lists of cell c are scanned and divided into two for the two smaller cells accordingly
7. Compute Delta clustering error for c as the total clustering error before partition minus total clustering error of its two sub cells and insert the cell into an empty Max heap with Delta clustering error as a key.
8. for each data-point set Am (1<=m<=k) find the arithmetic mean of the vectors of data points in Am, these means will be the initial centroids.
The proposed new algorithm will partitioning the data based k-means for performing data partitioning along the data axis with the highest variance to improve the accuracy. The data Partitioning tries to divide data space into small cells or clusters where inter cluster distance are large and intra cluster distance are small as possible. To partition the given data into k cells, we start with a cell containing all given data and partition the cell into two cells. Later on we select the next cell to be partitioned that yields the largest reduction of total clustering errors (or Delta clustering error). This can be determined as Total clustering error of the original cell – the sum of Total clustering errors of the two sub cells of the original cell. This is done for every time while partition on a cell, so the partition will help reduce the sum of total clustering errors for all cells, as much as possible. We can now use the partitioning algorithm to partition a given set of data into k cells. The centers of the cells can then be used as good initial cluster centers for the K-means
IV. EXPERIMENTAL AND RESULTS
We evaluated the proposed algorithm on Vehicle, gene-colon dataset and the performance of the new proposed clustering algorithm is evaluated using Euclidean distance between adjacent data along the data axis with the highest variance to improve the accuracy and reduce the square error is the sum of distance for all objects in the data set with respect to the centroid of belonging to that object’s cluster.
Sum of the Squared Error (SSE):
The next parameter used for evaluating the proposed clustering algorithm is Sum of the Squared Error. This measure will decide how well the data are separated from each other among different clusters. Sum of the squared error is given by
Where is the set of instances in cluster k; is the vector mean of cluster k. The components of are calculated as:
© 2014, IJCSMC All Rights Reserved 727
Accuracy
The accuracy of clusters will decide how accurate the data are separated into different groups based on the similarity. The accuracy can be determined by using the following formula,
Gene-colon Dataset:
The Colon dataset is a collection of gene expression measurements from 62 Colon biopsy samples from colon-cancer patients reported by Alon. Among them, 40 tumor biopsies are from tumors (labeled as “negative”) and 22 normal (labeled as “positive”) biopsies are from healthy parts of the colons of the same patients. Two thousand out of around 6500 genes were selected.
Vehicle Silhouettes Dataset:
For the vehicle dataset, the purpose is to classify a given silhouette as one of four types of vehicle, using a set of features extracted from the silhouette. Each vehicle may be viewed from one of many different angles. The original purpose was to find a method of distinguishing 3D objects within a 2D image by application of an ensemble of shape for the vehicle dataset, the purpose is to classify a given silhouette as one of four types of vehicle, using a set of features extracted from the silhouette. Each vehicle may be viewed from one of many different angles. The original purpose was to find a method of distinguishing 3D objects within a 2D image by application of an ensemble of shape
Comparison with Results:
The clustering accuracy resulted for using various clustering algorithm is compared. Table 1 represents the comparison of resulted cluster accuracy for various techniques with different dataset
Table 1: Comparison of Accuracy Resulted for the Proposed and Existing Technique for Various Datasets
DATASET
ACCURACY (%)
K-MEANS
PAM MODIFIED
K-MEANS (ABDUL NAZEER AND SEBASTIAN)
PROPOSED
Gene-colon
53.22 54.84 58.12 61.23
Vehicle Silhouettes
73.96 80.21 82.34 85.07
From the table 1, for Gene-colon dataset, it can be observed that the accuracy resulted by standard K-Means algorithm is 53.22% and Pam algorithm is 54.84% and by Modified K-Means (Abdul Nazeer and Sebastian) algorithm is 58.12%; whereas the higher accuracy of 61.23% is resulted for the proposed new clustering algorithm.
© 2014, IJCSMC All Rights Reserved 728 Figure 1: Resulted Clustering Accuracy for various Dataset
The Figure 1 represents the resulted clustering accuracy in Gene-colon & Vehicle silhouettes dataset. From the table 1, it can be observed that the proposed clustering result is better clustering accuracy when compared to K-Means and Pam and modified K-K-Means techniques (Abdul Nazeer and Sebastian).
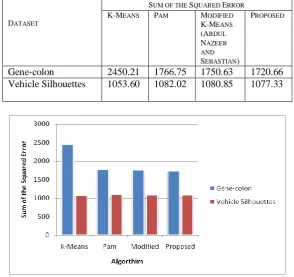
Next, the Sum of the Squared Error resulted for various techniques are compared. Table 2 represents the comparison of resulted Sum of the Squared Error for various techniques with different dataset.
From the table 2, for Gene-colon dataset, it can be observed that the Sum of the Squared Error resulted by standard K-Means algorithm is 2450.21 and Pam algorithm is 17.66.75 and by Modified K-Means (Abdul Nazeer and Sebastian) algorithm is 1750.63; whereas only 1720.66 is resulted for the proposed clustering algorithm.
For Vehicle Silhouettes dataset, it can be observed that the Sum of the Squared Error resulted by standard k-means algorithm is 1053.60 and Pam algorithm is 1082.02 and the Sum of the Squared Error resulted by Modified K-Means (Abdul Nazeer and Sebastian) algorithm is 1080.85; whereas only the value of only 1077.33 is resulted by the proposed clustering algorithm.
Table 2: Comparison of SSE Resulted for the Proposed and Existing Technique for Various Datasets
DATASET
SUM OF THE SQUARED ERROR K-MEANS PAM MODIFIED
K-MEANS (ABDUL NAZEER AND SEBASTIAN)
PROPOSED
Gene-colon 2450.21 1766.75 1750.63 1720.66
Vehicle Silhouettes 1053.60 1082.02 1080.85 1077.33
© 2014, IJCSMC All Rights Reserved 729
The Figure 2 represents the result of comparison the Sum of Squared Error for Gene-colon & vehicle silhouettes dataset. From the results, it can be observed that minimum Sum of the Squared Error is resulted for the proposed clustering technique when compared to the existing clustering techniques.
V. CONCLUSION
The proposed clustering technique is evaluated using different dataset, namely Gene-colon, Vehicle silhouttes. The parameters used for the comparison are accuracy and Sum of the Squared Error. From the results, it can be observed that the proposed technique will produce better accuracy for clustering. When Sum of the Squared Error is considered, the proposed clustering technique results in lesser Sum Squared Error. Considering all these results, the proposed clustering algorithm results in better clustering result when compared to the other existing techniques. This is satisfied for all the considered dataset.
REFERENCES
[1]. A.K. Jain, M.N. Murty, and P.J. Flynn, “Data Clustering: A Review,” ACM Computing Surveys, vol. 31, no. 3, pp. 264-323, Sept. 1999.
[2]. R. Xu and D. Wunsch, “Survey of clustering algorithms.,” IEEE transactions on neural networks / a publication of the IEEE Neural Networks Council, vol. 16, no. 3, pp. 645-78, May. 2005.
[3] A. Likas, N. Vlassis and J.J. Verbeek, “The Global k-means Clustering algorithm”, Pattern Recognition , Volume 36, Issue 2, 2003, pp. 451- 461.
[4] Fahim A.M, Salem A. M, Torkey A and Ramadan M. A, “An Efficient enhanced k-means clustering algorithm,” Journal of Zhejiang University, 10(7):1626–1633, 2006.
[5] P.S. Bradley and U.M. Fayyad, “Refining initial points for K-means Clustering”, Proceeding of The Fifteenth International Conference on Machine Learning, Morgan Kaufmann, San Francisco, CA, 1998, pp. 91 99.
[6] Merz C and Murphy P, UCI Repository of Machine Learning Databases, Available:
ftp://ftp.ics.uci.edu/pub/machine-learningdatabases
[7] Mondal and Choudhury “A Comparative Study on K Means and PAM Algorithm using Physical Characters of Different Varieties of Mango in India”, Volume 78– No.5, September 2013